Clinicians have long been frustrated by the disproportionate role that intraocular pressure (IOP) plays in glaucoma care. As the only factor amenable to medical or surgical intervention, its role is vital. Yet tonometry is inherently limited: A single reading taken every few months fails to depict IOP’s diurnal ebb and flow. Even bringing patients in for multiple tonometry readings doesn’t provide an ideal sense of the patient’s IOP characteristics.
| |
|
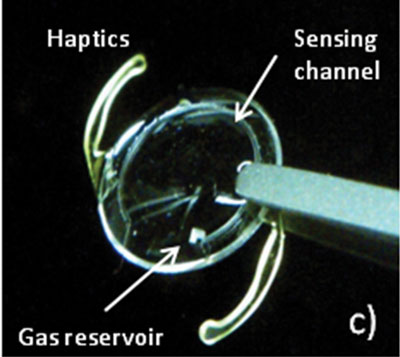
This implantable micro-fluidic 24-hour IOP monitoring sensor is currently in development at Stanford University. Photo: Ishmail E. Araci |
Experts believe you’ll eventually fit patients with a tiny sensor housed on a contact lens or pair of glasses, or send them to an ophthalmologist to have one implanted in the eye. It would continuously measure IOP, exponentially increasing the quantity—and, hopefully, the value—of the data you receive. If the current approach to IOP documentation is like taking a snapshot, continuous 24-hour IOP monitoring is more akin to capturing a video that records change over time rather than just giving one static reading.
These gadgets are still under development. Are they ready for prime time? Let’s take a look at how IOP fluctuates, the clinical challenges it creates and the current state-of-the-art technologies that attempt to better track IOP to allow for greater clinical understanding.
A Moving Target
Setting up a treatment plan based on achieving a target IOP is tricky when the target itself is moving. IOP fluctuates throughout the day—hour by hour, minute by minute, even second by second—based on a variety of endogenous and exogenous factors.
Within the ocular system, IOP can depend on the balance of aqueous humor production, outflow facility (how easily aqueous humor leaves the eye), episcleral venous pressure (the pressure in the veins on the surface of the eye) and uveoscleral outflow (a secondary pathway for aqueous humor to leave the eye).
For example, an increase in outflow facility or decrease in aqueous humor production would lower IOP, says Arthur J. Sit, MD, a glaucoma researcher at the Mayo Clinic in Rochester, Minn. Short-term jumps in IOP can also occur due to pressure on the eye from blinking or rubbing the eye or even during eye movement or blood pressure pulsations.
Intraocular pressure also fluctuates because of body position, time of day (peaks at night, troughs during the day), blood pressure and the related concept of ocular perfusion pressure (OPP), stress or pain levels, water and caffeine consumption.
Furthermore, vigorous activity and stress can make blood pressure, IOP and OPP peak, says Kaweh Mansouri, MD, MPH, an ophthalmologist at the University of Geneva and the University of Colorado Denver. Measurement of blood pressure in conjunction with IOP has value to determine how blood pressure affects IOP, says Dr. Mansouri. Researchers are currently using 24-hour IOP monitoring devices to explore these effects on glaucoma progression.
|
Dos and Don’ts of IOP Measurement
Don’t diagnose or treat after just one measurement. Dr. Sowka advises optometrists not to start treatment immediately unless the pressure is excessively high or the optic nerves are already severely damaged and vulnerable; instead, measure pressure several times. It’s also a good idea to get several pressure readings after initiating therapy to determine whether the medication is working, says Dr. Sowka. One IOP reading after starting a medication is really not enough to judge true efficacy. Do tell patients to relax. As mentioned earlier, patients may strain or hold their breath during tonometry. Tell them regularly to relax and breathe normally during the process, urges Dr. Mansouri. Don’t let go of your suspicion. If the patient’s IOP measurements don’t seem to match with your visual field and optic nerve assessments, there may be more going on with the patient’s IOP than you realized, says Dr. Hartwick. Have them come back and measure their IOP at a different time of day, he adds. Do consider a diurnal curve in select patients. Recording a diurnal curve tonometrically is impractical and tedious for most patients. But if the level of IOP and the extent of damage seem incongruous—for instance, when you suspect normal tension glaucoma—consider the possibility, says Dr. Davey. If the patient is agreeable, bring them in early in the morning and record IOP every hour for eight to 10 hours. “That gives you the office diurnal curve, which might not be fully representative of the day/night values, but at least it gives you more than one measurement,” he says. |
Here’s how these variables affect IOP:
• Body position. Depending on the patient’s position in the chair, the pressure can increase or decrease. For example, IOP is lowest when the patient is sitting in a neutral position. “Almost anything else causes IOP to increase, including bending the neck forward, bending the head backwards, turning the head to the side, lying down, bending over, blinking or rubbing your eyes,” says Dr. Sit.
• Water consumption. Drinking a large volume of water causes the patient’s blood volume to increase for a short time. Venous pressure also goes up when the patient consumes more water. “All they have to do is consume 16 to 32oz, which is one or two small bottles of water, and within five minutes the pressure will be up by 6mm Hg,” says Pinakin Gunvant Davey, PhD, OD, professor and glaucoma expert at the College of Optometry at Western University of Health Sciences in Pomona, Calif.
• Time of day. The literature has shown peak IOP occurs at night in two-thirds of patients. The reason: aqueous is under-secreted at night, says Joseph Sowka, OD, professor of optometry at Nova Southeastern University College of Optometry in Ft. Lauderdale, Fla.
For instance, Dr. Mansouri observed patients for 24 hours in sleep labs and found the highest IOPs at night. Even though your patients won’t be subject to sleep studies, they may come to your office in the evening—if so, expect to see elevated IOPs relative to other times of day.
• Blood pressure. Baseline IOP is based on cardiac cycle, systolic and diastolic blood pressure. The force used to bring blood into the eye is the ocular perfusion pressure, explains James L. Fanelli, OD, of Cape Fear Eye Institute in Wilmington, NC.
If blood pressure is low, there is less force to “push” blood into the eye, and therefore, less perfusion pressure to the eye. Factors that cause IOP to elevate will have an effect on lowering perfusion pressure, and factors that lower blood pressure also will result in lower perfusion pressure—or a combination of any of those factors can play a role, Dr. Fanelli says. Blood pressure tends to downregulate during sleep hours in the early morning, which is also the time of day where IOP tends to be the highest.1 These two opposing factors can have a duplicative effect in reducing OPP during nocturnal hours, which may allow increased damage to the ocular nerve head.
• Stress. An increase or decrease in stress causes hormonal changes that push IOP levels up or down. One of Dr. Mansouri’s patients—studied using a 24-hour IOP monitoring sensor on a contact lens—had pressure spikes whenever her dog had epileptic fits at night.
– General “nerves.” It’s possible that, in some patients, the stress of the eye exam itself—for instance, if they are worried about being diagnosed with glaucoma—may cause their IOP to go up, says Andrew Hartwick, OD, PhD, associate professor at Ohio State University College of Optometry in Columbus. For example, they may squeeze their eyes because they’re stressed about the exam, and IOP readings spike.
– Pain also causes surges in IOP because it causes stress. One of Dr. Mansouri’s patients banged her leg badly in a parking lot. There was a spike in her IOP level at the exact moment she recalled her accident occurred, according to 24-hour monitoring data.
Consequences of Inaccurate IOP Readings
Studies have indicated that peaks in IOP could contribute to glaucoma progression.2,3 But if you examine a patient when IOP is at its lowest or highest, you may overestimate or underestimate the diagnosis of glaucoma or treatment required for the patient.
“If we catch a patient at a trough, where IOP is lowest, it may lead us away from a consideration of glaucoma,” especially if the reading falls within a statistically normal range, says Dr. Sowka. “Other times, we may get them at a peak IOP, where it’s a little above normal—a scenario that tends to make practitioners worry needlessly.”
|
|
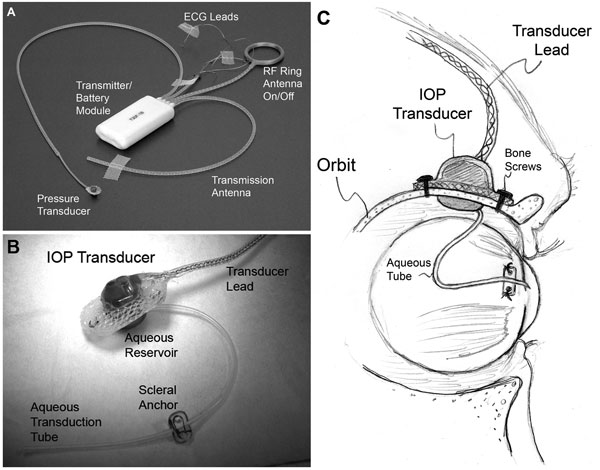
| (A) A typical T30F total implant system (Konigsberg Instruments). (B) The extraorbital surface of the custom IOP transducer housing. (C) A 23-gauge silicone tube delivers aqueous from the anterior chamber to a fluid reservoir on the intraorbital side of the transducer (partially hidden from view in B); The tube (with appropriate slack to allow for eye movement) was trimmed and inserted into the anterior chamber. |
Recording an IOP range would potentially allow improvement in glaucoma diagnosis and management. “If researchers could show that specific 24-hour IOP patterns are related to progression of glaucoma, then there is hope that detecting these patterns might help to identify patients at increased risk for progression and allow us to adapt their treatment accordingly,” says Dr. Mansouri.
Glaucoma could be identified sooner, allowing surgery or medications to commence more quickly, he adds. Eye doctors could also determine whether IOP-lowering drugs are effective at night or during specific activities that raise IOP.
Establishing a true IOP range would require continuous 24-hour IOP monitoring. This is a challenge, because a single IOP measurement collected during normal office hours doesn’t capture the range of a patient’s IOP, its peaks or changes during the day.4
Right now, determining IOP range is possible using Goldman applanation tonometry (GAT) through a diurnal tension curve (DTC), where IOP readings are captured at different time points during clinic hours. But this is problematic for both practitioner and patient. Nighttime curves are not recorded, and fewer than 1% of patients undergo DTC or IOP monitoring in a sleep lab.4
Indeed, researchers measured IOP for 24 hours and documented not only that IOP peaks nocturnally, but that IOP fluctuation was far greater during non-office hours.5 In a study of 35 patients whose IOP was recorded using a pneumatonometer in a sleep lab for 24 hours, most peak IOPs were recorded at night in older glaucoma patients compared to healthy people, whether sitting or lying down.6
More recently, investigators using 24-hour monitoring have learned that average IOP not only rises at night, but is actually spiking constantly—and more so during the day than at night.7 Researchers at the Devers Eye Institute in Portland, Ore., used a telemetry system implanted in monkey eyes to record 500 IOP measurements per second.
They found that IOP fluctuates much more than previously believed. “Blinks and eye movements generate large IOP spikes that occur about 12,000 times per hour and constitute about 12% of the total IOP energy that the eye must absorb during waking hours,” the researchers found. They believe that this data in monkeys will be about the same in humans. “IOP must now be viewed as dynamic and ever-changing, and IOP fluctuations may prove to be an important contributor to glaucoma.”8
They also found that the diurnal cycle does not repeat from day to day. Hence the need for continuous IOP monitoring. Current prototypes include implanted sensors and contact lens-based devices.
Intelligent Implantables
Several start-up companies have been developing telemetric pressure sensors that can be implanted during cataract or glaucoma surgery. “Telemetric means that the pressure readings are captured remotely (i.e., from inside the eye) and transmitted wirelessly to an external reader,” says Dr. Sit.
Implantable devices currently being studied include:
| |
|
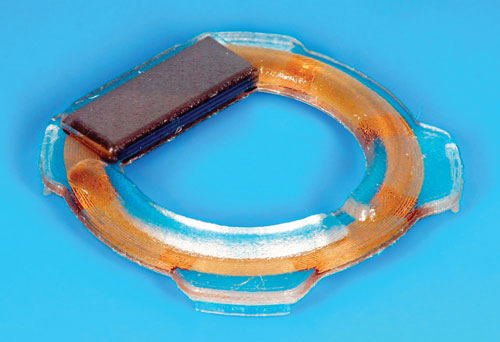
The Pro-IOP Sensor is a telemetric devices that is implanted like an IOL. Photo: Implandata Ophthalmic Products GmbH |
• Pro-IOP. German-based Implandata Ophthalmic Products is working on the Pro-IOP, a wireless intraocular pressure transducer (WIT) that is powered telemetrically by a hand-held device. Resembling a tiny plastic ring, the WIT measures 11.3mm in diameter.9 It incorporates pressure sensors, a temperature sensor, identification encoder, analog-to-digital encoder and telemetry unit into a single microelectromechanical system.9
An RFID chip with a built-in antenna broadcasts 24-hour IOP readings to an external hand-held reader. The patient and doctor may also eventually have the ability to receive the data via a smartphone app. The patient could also communicate with the doctor about IOP readings on the app.
The device has not yet received CE marks in Europe or FDA approval in the US, but researchers in Germany recently inserted the Pro-IOP into the first human subject, a woman in her 60s; no data has been published yet.9
• AcuMEMs. An implantable in development by an American company of the same name, AcuMEMs functions similarly to the Pro-IOP. The sensor is a capacitive pressure sensor that changes shape with fluctuations in IOP. “When it changes shape, the electrical capacitance is altered and this can be detected externally with the reader,” says Dr. Sit.
The sensor can be implanted in the anterior chamber as a standalone procedure or as part of glaucoma surgery; it can also be inserted into the capsular bag during cataract surgery.
• Microfluidic IOL implant. Researchers at Stanford University and Bar-Ilan University in Israel are jointly developing an implantable microfluidic sensor. IOP would be measured “based on an established equilibrium pressure interface between an intraocular liquid and gas” contained in chambers in the sensor, according to the device patent. Patients and doctors could use their smartphones or an external reader to check their IOP.10 The inventors are awaiting patent approval for the sensor.
The signal transmitted from devices implanted in the eye may be more accurate than those attached to contact lenses, in theory, says Dr. Davey. The signal strength depends on how much energy the device puts out. “We implanted both devices (Pro-IOP and AcuMEMs) and they were not working so good,” Dr. Davey says.
Both the Pro-IOP and AcuMEMs readers could potentially be attached to a pair of glasses, and data would be collected the same way, Dr. Sit says.
Clever Contact Lenses
Researchers first investigated contact lens sensors in the 1970s, but the available hard contact lenses were too uncomfortable and changed the structural integrity of the patient’s eye, according to Dr. Davey.
| |
|
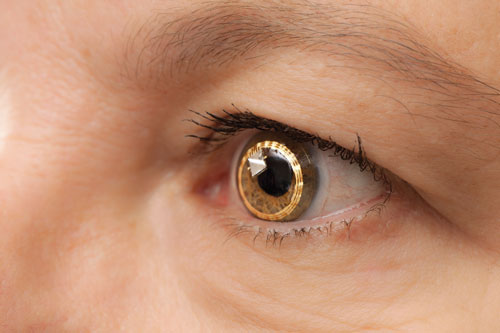
The Sensimed Triggerfish on the eye. It’s still undergoing clinical trials in the US. |
The sensors were also not sensitive enough. “The person with a ‘softer’ eye had more accurate readings than a person with a more rigid eye,” says Dr. Davey. “The technology was not good enough to get IOP values.” A thicker cornea responds less readily to IOP changes, making tonometry (and contact lens sensors) less accurate.
Contact lens-based IOP sensors include:
• The Triggerfish (Sensimed). At the University of Geneva in Switzerland, ophthalmologists conducted early investigations of a contact lens dubbed the Triggerfish, led by Dr. Mansouri and others.
The Triggerfish is a hydrophilic soft contact lens fitted with a contact lens sensor (CLS). The CLS has two strain gauges located around the limbus that detect changes in ocular circumference. “These changes in ocular circumference are believed to be related to changes in IOP and intraocular volume, and this has been proven in enucleated eyes,” says Dr. Mansouri. The device measures a mixture of IOP, intraocular volume and biomechanical property changes (a combination of corneal and scleral hysteresis and rigidity) that correlate with fluctuations in IOP. An external reader captures the data over a 24-hour period.
|
|
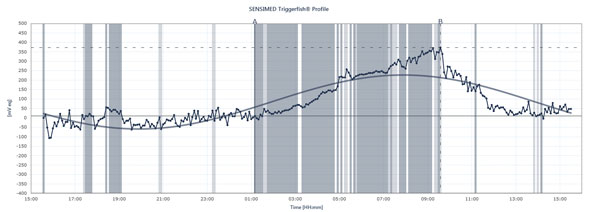
The flow chart shows the peaks and troughs of IOP in a patient wearing the Sensimed Triggerfish over a 24-hour period. |
The Triggerfish is CE mark-approved in Europe. FDA approval has not been reached in the US and the device is still undergoing clinical trials.
|
Triggerfish Tracks IOP Differently
The data displayed on the external reader are a combination of intraocular pressure, intraocular volume and biomechanical properties of the eye, explains Dr. Mansouri. “It’s useful to give you an idea of the qualitative changes over 24 hours more than the quantitative changes because we cannot translate them into millimeters of mercury,” he says. The Triggerfish provides valuable information nonetheless. Future studies using the device could help explain how unstable or stable pressure has been over 24 hours, when nighttime IOP peaks occur, how introducing treatment or treatment changes affects 24-hour IOP patterns and how specific activities affect 24-hour IOP patterns, such as yoga positions, caffeine intake, stressful situations and other causes of IOP spikes described above. Dr. Mansouri also has normal or low-tension glaucoma patients undergo simultaneous 24-hour blood pressure and 24-hour IOP monitoring, as peaks may affect OPP. But will the Triggerfish show a correlation between 24-hour IOP patterns and glaucoma progression? Many studies are underway to answer this essential question. |
• Resonance circuit sensor contact lens. Another smart CLS device in development is a resonance circuit made of a thin-film capacitor combined with a sensing coil that detects corneal curvature deformation. It’s in the early stages of development under David C.C. Lam at the Department of Mechanical and Aerospace Engineering at the Hong Kong University of Science and Technology.
In a September 2014 study, the CLS was tested on a silicone rubber eye model. The sensor was found to accurately track fluctuating IOP.11
Like measuring glucose levels once a day for patients with diabetes or blood pressure once a day for heart disease patients, reliance on one IOP measurement could result in erroneous IOP data. But perhaps in the not-too-distant future, devices right out of a science fiction movie—contact lens and implantable sensors—could let you track IOP with greater understanding and less hassle for you and your patients.
1. Liu JH1, Gokhale PA, Loving RT, Kripke DF, Weinreb RN. Laboratory assessment of diurnal and nocturnal ocular perfusion pressures in humans. J Ocul Pharmacol Ther. 2003 Aug;19(4):291-7.
2. Zeimer RC, Wilensky JT, Gieser DK, Viana MA. Association between intraocular pressure peaks and progression of visual field loss. Ophthalmology. 1991 Jan;98(1):64–69.
3. Konstas AG, Quaranta L, Mikropoulos DG, et al. Peak Intraocular Pressure and Glaucomatous Progression in Primary Open-Angle Glaucoma. J Ocul Pharmacol Ther. 2012 Feb;28(1):26-32.
4. Mansouri K, Weinreb RN, Medeiros FA. Is 24-hour intraocular pressure monitoring necessary in glaucoma? Semin Opththalmol. May 2013: 28(3):157-164.
5. Barkana Y, Anis S, Liebmann J, Tello C, Ritch R. Clinical utility of intraocular pressure monitoring outside of normal office hours in patients with glaucoma. Arch Ophthalmol. 2006 Jun;124(6):793-7.
6. Mosaed S, Liu H, Weinreb RN. Correlation between peak nocturnal intraocular pressures in healthy subjects and glaucoma patients. Am J Ophthalmol. 2005; Feb;139(2):320-4.
7. Downs JC, Burgoyne CF, Seigfreid WP, et al. 24-hour IOP telemetry in the nonhuman primate: implant system performance and initial characterization of IOP at multiple timescales. Invest Ophthalmol Vis Sci. 2011 Sep 21;52(10):7365-75.
8. Association for Research in Vision and Ophthalmology: Emerging trends and hot topics. Presented Monday, May 5, 2014 at the ARVO Annual Meeting. Available at: www.arvo.org/About_ARVO/Press_Room/Emerging_Trends_and_hot_topics__Presented_Monday,_May_5_at_the_ARVO_Annual_Meeting. Accessed Nov 19, 2014.
9. Melki S, Todani A, Cherfan G. An Implantable Intraocular Pressure Transducer Initial Safety Outcomes. JAMA Ophthalmol. 2014 Oct 1;132(10):1221-5.
10. Mandel Y, Araci IE, Quake SR. Google Patents. Implantable micro-fluidic device for monitoring intra-ocular pressure. Available at: www.google.com/patents/WO2014137840A1?cl=en. Accessed October 17, 2014.
11. Chen GZ, Chan IS, Leung LK, Lam DC. Soft wearable contact lens sensor for continuous intraocular pressure monitoring. Med Eng Phys. 2014 Sep;36(9):1134-9.
12. Mottet B, Aptel F, Romanet JP, et al. 24-hour intraocular pressure rhythm in young healthy subjects evaluated with continuous monitoring using a contact lens sensor. JAMA Ophthalmol. 2013 Dec;131(12):1507-16.