Retinal Vascular Miniseries |
| Follow the links below to read the other installments of this miniseries: Part 1: Recognizing Abnormal Vasculature Part 2: Read the Retinal Vasculature Like a Pro Part 4: Identify and Manage Retinal Vascular Tumors |
The eye is unique in that it allows for direct, noninvasive visualization of the body’s microvasculature. Studying these retinal vessels during clinical examination can give insight into a patient’s overall vascular health. Changes in the shape, color and caliber of vessels can represent ocular manifestations of many systemic conditions. Examining the arteriolar-venular caliber ratio can assist in diagnosing vascular abnormalities and associated pathology. A reduced ratio could indicate retinal venular dilation, arteriolar attenuation or both.
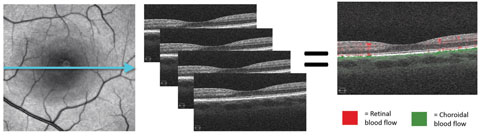 |
| Fig. 1. These images demonstrate the principle of motion contrast, during which the same location is imaged four consecutive times. Differing reflectance patterns between scans represent red blood cell movement and blood flow. In the last image, red represents retinal blood flow and green is choroidal flow. |
This article—the third in a four-part series on the retinal vasculature—reviews the potential of this budding technology to image maladies of the retinal vasculature system.
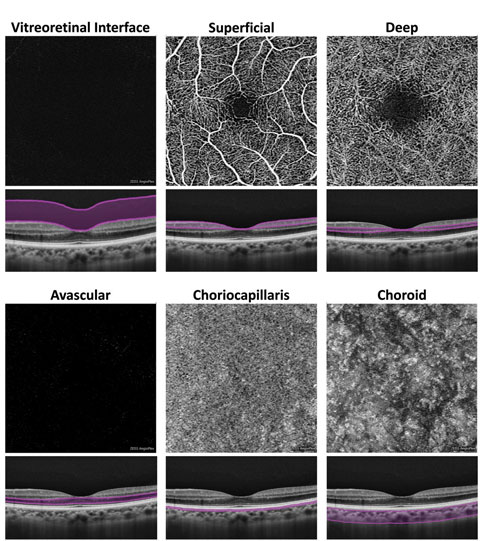 |
| Fig. 2. At left, these en face OCT-A images, and corresponding segmentation boundaries, were derived from a 3mm x 3mm macular cube scan in a healthy eye. |
Retinal Blood Supply
The neurosensory retina is nourished by a dual blood supply consisting of both the central retinal artery (CRA) and choroidal microcirculatory systems.4 The CRA supplies the inner layers of the retina and gives rise to two capillary networks:
- The superficial capillary plexus, located within the nerve fiber layer (NFL) or the ganglion cell layer (GCL).
- The deep capillary plexus, located within the inner nuclear layer (INL).4 The choroid supplies the outer retinal layers and consists of three vessel layers (from anterior to posterior):4
- Choriocapillaris.
- Sattler’s medium-sized vessel layer.
- Haller’s large-sized vessel layer.
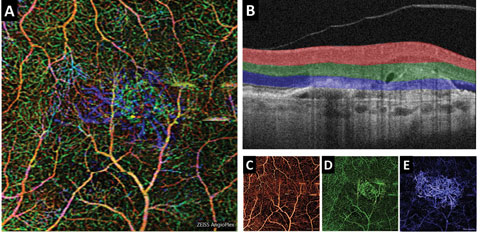 |
| Fig. 3. (A) This color en face OCT-A image shows a combination of retinal layers in an eye with a choroidal neovascular membrane. (B) Shows the segmentation boundaries and color codes for each of the individual en face OCT-A images below. The en face OCT-A images are (C) the superficial retina (D) the deep retina and (E) avascular. Click image to enlarge. |
Technologies
Currently, two FDA-cleared OCT-A systems are commercially available in the US, the AngioPlex (Carl Zeiss Meditec) and the AngioVue (OptoVue).6,7 Several other systems are either still in development or awaiting FDA clearance, such as the AngioScan (Nidek) and the Triton Swept Source OCT (Topcon).8,9OCT machines with OCT-A capabilities require additional software, but the general hardware and scan acquisition techniques are relatively unchanged. OCT-A imaging is based on the principle of motion contrast portraying differing patterns of reflectance across time due to red blood cell movement within tissue.1,2
To detect motion, we must image the exact same retinal location four consecutive times (similar to acquiring four macular cube scans).1,2 Software then compares these four scans for differences, referred to as the decorrelation signal (Figure 1).1,2 Greater decorrelation signals refer to faster blood flow and result in brighter pixel values on the resultant en face OCT-A images.1,2 Red blood cells that are moving either too slowly or too quickly, such that no reflectance changes are apparent between the consecutive scans, will not be imaged.1,2 Slow flow is often found in extravascular areas that demonstrate late-stage hyperfluorescence patterns with conventional fluorescein angiography (FA).1,2 For this reason, and since moving fluid in extravascular areas is typically optically empty, OCT-A cannot image conventional FA late-stage hyperfluorescence patterns such as leakage, pooling or staining.1,2
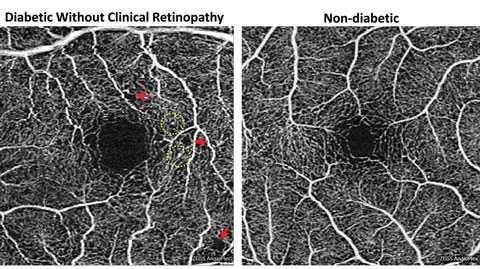 |
| Fig. 4. Foveal enlargement and perifoveal capillary remodeling detected with OCT-A in a diabetic eye without funduscopically visible diabetic retinopathy. Red arrows point to subtle areas of capillary nonperfusion, while yellow circles highlight microaneurysms. Click image to enlarge. |
Display and Normal Findings
An inherent challenge of OCT-A systems is finding a way to display 3D data in a 2D format that is easy for clinicians to understand and analyze. Each OCT angiogram represents a slab of data, including several retinal layers, compressed into a 2D plane and presented en face.1-3,10 These en face OCT angiograms are commonly displayed alongside a corresponding structural en face image with identical segmentation boundaries.1-3,10Some differences exist between brands. For instance, the AngioPlex offers six predefined macular en face OCT angiograms (Figure 2).1-3,10 The first, and most anterior, is the vitreoretinal interface (VRI) and includes data from the internal limiting membrane (ILM) and 300µm into the vitreous. In a healthy eye, the VRI OCT angiogram should be void of signal, since no vascular movement occurs in the vitreous. The VRI OCT angiogram is particularly useful for detecting and visualizing preretinal neovascularization.
The second en face OCT angiogram, available on both commercially available OCT-A platforms, is the superficial retina. The superficial retina OCT angiogram includes vascular data from the NFL, GCL and IPL.1-3,10 A normal superficial retina OCT angiogram contains the larger vascular branches of the CRA, the superficial capillary plexus of the CRA, and the radial peripapillary capillaries if the scan location is within the peripapillary zone.
The third en face OCT angiogram, which is also available on both OCT-A platforms, is the deep retina. This angiogram includes vascular data from the inner nuclear and the outer plexiform layers and contains the deep capillary plexus of the CRA. A healthy deep retina OCT angiogram appears as a uniform organization of mini vortexes.1-3,5,10 The normal foveal avascular zone (FAZ) can be visualized in both the superficial retina and the deep retina OCT angiograms.11
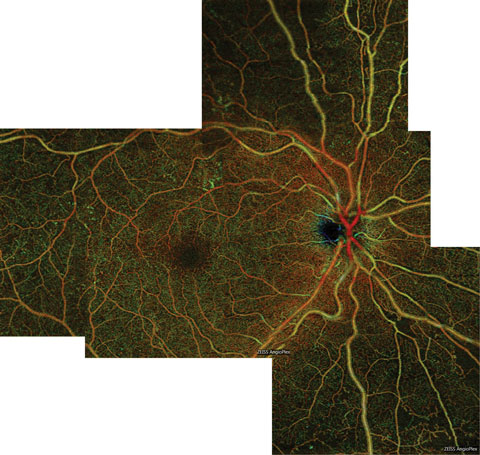 |
| Fig. 5. This color en face OCT-A montage of an eye with severe NPDR shows large areas of capillary nonperfusion inferior to the optic nerve, which extend into the inferior midperiphery. Areas of nonperfusion are bordered by intramicrovascular abnormalities. Click image to enlarge. |
The fifth en face OCT angiogram, available on both platforms, is the choriocapillaris, which includes vascular information from a thin slab, approximately 20µm in thickness, just beneath the posterior aspect of the RPE.
The final en face OCT angiogram on the AngioPlex is the choroid, which includes vascular information from a 50µm thick slab beneath the choriocapillaris. Due to fast flow and limited depth penetration, the larger choroidal vessels typically appear dark instead of light as would be expected.1-3,5,10 Several OCT-A systems, including the OptoVue AngioVue and the Nidek AngioScan, include predefined en face angiograms for optic nerve scans and include visualization of the radial peripapillary capillaries.
Another way to display OCT-A volumetric data in a 2D manner is to create a color en face image (Figure 3).10 In such an image, multiple en face OCT angiograms are color-coded based on depth and superimposed upon each other. The AngioPlex also automatically creates a video of each scan with an en face image that changes as a thin segmentation slab is moved from anterior to posterior.
Lastly, the user can superimpose vascular information upon cross sectional B-scans, allowing precise localization of vascular lesions (Figure 1).1-3,10
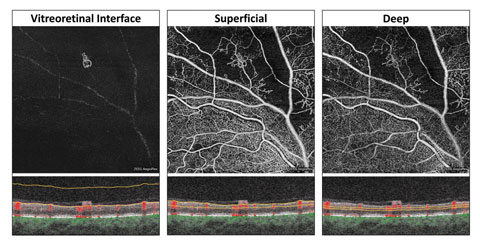 |
| Fig. 6. These three en face OCT-A images are displayed with their corresponding segmentation boundaries below. The vitreoretinal interface en face OCT-A highlights a small area of neovascularization elsewhere within the superior temporal arcade. The superficial and deep retinal OCT-A scans show extension of the neovascular network within the retina. Massive areas of nonperfusion are seen within the superficial and the deep capillary plexus surrounding the area of neovascularization. |
Comparison with Conventional FA
Since it uses no dye, OCT-A is not truly angiography.1-3 FA provides information on where dye, either intravascular or extravascular, has traversed over time.1-4 In contrast, OCT-A provides a snapshot of red blood cell motion at the moment the scan was acquired.1-3 Because OCT-A cannot capture slow extravascular flow, conventional FA late-stage hyperfluorescence patterns (such as leakage, pooling or staining) cannot be imaged with OCT-A.1-4 This inability to image late-stage leakage has both disadvantages and advantages.1-3,5,7 The presence of leakage on FA identifies a breakdown of the blood-retinal barrier and can be used to detect areas of neovascularization or sources of macular edema.4 OCT-A’s disadvantage is that, without leakage, it may be harder to detect neovascular membranes or plan focal laser treatment for macular edema. Leakage, however, frequently obscures details of underlying neovascular membranes and makes precise delineation of neovascular complexes difficult.1-3,5,7 For this reason, OCT-A provides much higher resolution images of neovascular complexes.1-3,5,7OCT angiography does offer some advantages over FA. For instance, the potential side effects associated with intravenous fluorescein use, and the injection procedure itself, no longer exist.1-3 OCT-A can be performed even when not medically necessary and can be safely performed in circumstances when FA is contraindicated.1-4 OCT-A can be performed repeatedly within the same day, which is advantageous for confirming restoration of blood flow following treatment for central retinal artery occlusion (CRAO).1-3,12 The acquisition time for OCT-A is rapid and similar to conventional OCT imaging, while FA requires that late-phase photographs be taken at approximately 10 minutes post injection.1-4 OCT-A generally provides higher resolution imaging of the microcirculation and capillary beds, providing better delineation of capillary nonperfusion.1-3
One of the most beneficial aspects of OCT-A is simultaneous acquisition of conventional OCT structural and vascular information that can be viewed in tandem or superimposed.1-3 This allows the user to precisely locate vascular lesions and draw structural correlations, helping ODs target more appropriate referrals to the correct specialists.1-3
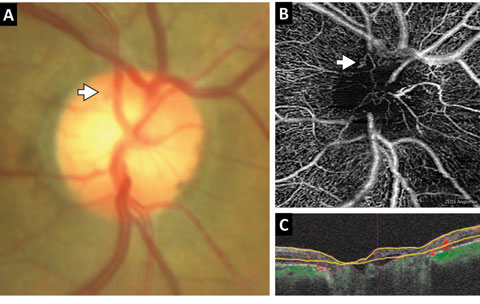 |
| Fig. 7. This patient with diabetes was found to have questionable early neovascularization of the disc. (A) A color photography of the disc with the area in question defined by the white arrow is limited in quality and funduscopic views due to dense posterior capsular opacity. (B) A custom segmentation en face OCT-A with the white arrow exposes an early tuft of neovascularization. (C) The segmentation boundaries corresponding to the en face OCT-A. Note an anterior layer of tissue within the cup that represents the neovascular membrane. |
Also, OCT-A motion detection has fast flow and slow flow cut-offs.1-3 Vascular structures with very fast flow such as large choroidal vessels are poorly imaged.1-3,5 Likewise, vascular structures with very slow flow such as microaneurysms, fibrotic CNV membranes, or capillaries within areas of ischemia may be poorly imaged or not imaged at all.1-3,13 However, despite these limitations the instrument is an excellent auxiliary tool, intended to augment the clinical examination, not replace it.
Finally, OCT angiography and OCT in general are subject to artifacts.14 Motion and blink artifacts are relatively uncommon due to incorporation of new eye tracking systems on most OCT machines with OCT-A capability. Motion artifacts may appear as horizontal gray or white bars or image doubling or ghosting.14 Shadowing of larger branches of the CRA often appear on choriocapillaris and choroidal en face OCT angiograms.
The most hindering artifacts unique to OCT-A are projection artifacts.7,14 These are due to the motion of shadows cast by the superficial retinal vasculature onto the photoreceptors and RPE below.7,14 They appear as a duplication of the superficial retinal vasculature on the photoreceptors and RPE and commonly produce false positive results on the AngioPlex avascular and the AngioVue outer retina en face OCT angiograms.7,14 They may also hinder the user’s ability to detect and visualize CNV complexes. Fortunately, software algorithms have been developed to minimize projection artifacts and are expected to continually improve.
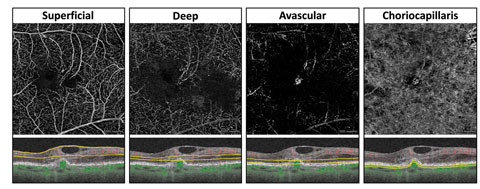 |
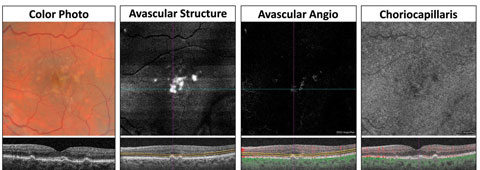
| Fig. 8. This en face OCT-A with corresponding segmentation boundaries shows an eye with exudative AMD and retinal angiomatous proliferation. Retinal vessels within the superficial and deep retinal angiograms temporal to the fovea can be seen diving down and anastomosing with a circular subRPE choroidal neovascular membrane visualized on the avascular and the choriocapillaris angiograms. Loss of flow signal within the choriocapillaris surrounding the neovascular complex may represent choriocapillaris hypoperfusion. Click image to enlarge. |
OCT-A in Selected Diseases
OCT-A is suitable for use in several conditions routinely seen in optometric practice, including:Diabetes. For patients with this condition, OCT-A can detect vascular abnormalities prior to the development of funduscopically evident diabetic retinopathy (DR), a condition referred to as “subclinical” diabetic retinopathy.15 Commonly, the earliest funduscopic finding of nonproliferative diabetic retinopathy (NPDR) is microaneurysm formation, but other early vascular abnormalities, such as enlargement of the FAZ (macular ischemia) or remodeling of the perifoveal capillaries are not obviously apparent with routine fundus examination.15,16 OCT-A highlights these subtle vascular abnormalities and provides detailed evaluation of the FAZ.1-3 Until the advent of OCT-A, FA was the only method for detecting macular ischemia in eyes with DR and significant vision loss without observable macular edema.4,16
FAZ enlargement and remodeling can be detected in diabetic eyes without funduscopically visible DR using OCT-A (Figure 4). One study looked at 61 diabetes patients’ eyes that did not have clinically apparent DR.15 Using OCT-A, they found FAZ remodeling in 36%, capillary nonperfusion in 21% and microaneurysms/venous beading in less than 10% of diabetic eyes.15 Both FAZ remodeling and nonperfusion were significantly more common among diabetic eyes than normal controls.15 They and other study groups have also found a significant enlargement of the FAZ in diabetic eyes, suggesting that early macular ischemia may be present before clinical DR development.11,15 The presence of subclinical DR may predispose the eye to DR development and likely signifies the need for tighter systemic control.15
Another clinical application of OCT-A in diabetes is the detection and quantification of capillary nonperfusion (Figures 5 and 6).13,17-19 Due to higher microvascular resolution and the lack of obscuring leakage, nonperfusion is better detected and delineated via OCT-A than FA.17,18 Greater nonperfusion area fuels vascular endothelial growth factor (VEGF) release and is correlated with DR severity.20,21 Quantifying the degree of nonperfusion may prove a useful tool for predicting the risk of progression to proliferative diabetic retinopathy (PDR) even among eyes within the same DR stage.21 Individuals with NPDR found to have large areas of nonperfusion with OCT-A should be monitored more closely for the development of PDR and should have their control status reviewed.21 Recent evidence suggests that anti-VEGF therapy may reverse DR and prove to be a useful treatment to prevent PDR in high risk patients.21-23
For patients with diabetes, OCT-A may help detect PDR earlier than was previously possible. The hallmark of PDR is the growth of preretinal neovascularization between the ILM and the posterior hyaloid of the vitreous. Differentiating intraretinal microvascular abnormalities (IRMA) from early neovascularization elsewhere (NVE) can be difficult with ophthalmoscopy alone, even with good stereopsis, yet differentiating severe NPDR from early PDR is important for monitoring and treatment purposes. OCT-A definitively distinguishes IRMA from NVE (Figure 6) and aids in detection of early neovascularization of the disc (Figure 7). With early NVE, the lesion will be present in the VRI en face OCT angiogram, while IRMA, which is confined to the retina, will be absent. Due to higher microvascular resolution and the lack of obscuring leakage, areas of neovascularization can be precisely delineated and measured.19 This will allow for future automated quantification of neovascularization that can be used to track treatment responses and assess the need for retreatment.24
While OCT-A is useful in questionable cases, it should not be viewed as a replacement for the clinical examination.
 |
| Fig. 9. These images show an eye with nonexudative AMD. From left to right: a color fundus photograph, en face structural OCT image using the same segmentation boundaries as the avascular angiogram, avascular en face OCT angiogram and choriocapillaris en face OCT-A. The avascular angiogram shows areas of false positive reflectance that correspond to areas of drusen on the structural image to the left. These false positive areas represent projection artifacts due to drusenoid RPE elevation that encroaches within the segmentation boundaries seen on the B-scan image below. The choriocapillaris angiogram demonstrates dark areas corresponding to areas of drusen likely due to a combination of shadow artifact and vascular compromise. |
Anticipated analytic software updates will provide quantitative information regarding CNV flow and area that will be valuable for monitoring and quantifying response to treatment.28,31-33 In addition, OCT-A is a helpful complement to conventional structural OCT, FA, fundus examination and visual acuity testing when trying to determine whether retreatment is warranted during a “treat as needed or treat and extend” phase of anti-VEGF management.31-33
CNV membranes typically appear on the avascular and choriocapillaris OCT angiograms, and the presence of any bright area on the avascular OCT angiogram alerts the user that a CNV complex may be present. Note that non-exudative AMD with large drusen commonly produces false positive bright signal areas on the avascular angiogram due to projection artifact (Figure 9). These false positive areas occur because the photoreceptors/RPE containing the projection artifact signal become elevated from drusen formation and become included in the segmentation.
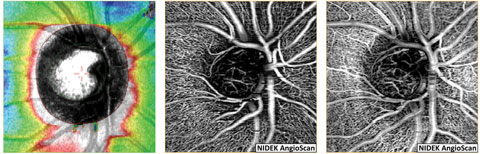 |
| Fig. 10. NFL and en face OCT angiograms of an eye with normal tension glaucoma shows the loss of NFL superior nasal (left) with corresponding thinning of the radial peripapillary capillaries (middle). Imaging of the vasculature at the level of the lamina cribrosa and neuroretinal rim (right) demonstrates loss of capillaries within the superior nasal aspect of the cup and rim tissue. Click image to enlarge. |
OCT-A provides detailed optic nerve head microcirculation structural and flow imagery, which, in normal subjects, presents as a dense microvascular network. However, in eyes with glaucoma, OCT-A shows visible attenuation of the optic disc vasculature globally and focally prior to visual field loss with 100% sensitivity and specificity, whereas, the difference in microvasculature between normal and glaucomatous eyes could not be visualized via disc photographs (Figure 10).36,37
Peripapillary vessel density is the percentage of area occupied by the large vessels and microvasculature in the peripapillary region. Investigators have revealed a mean peripapillary vessel density in glaucomatous eyes of 80.6%, which is significantly less than the 93.0% found in normal eyes.39
OCT-A vessel density measurements may have similar diagnostic accuracy to retinal nerve fiber layer (RNFL) thickness measurements for differentiating between healthy and glaucoma eyes. These results suggest that OCT-A measurements may be a tool for detecting damage to tissues relevant to the pathophysiology of open-angle glaucoma (Figures 10 and 11).37
Researchers found that the OCT-A flow index was reduced by 35% before visual field loss in glaucoma patients compared with normal.39 They also found that flow index was significantly correlated with the severity of glaucoma, visual field mean deviation and pattern standard deviation, RNFL, and ganglion cell complex thickness in glaucomatous eyes.38,40 Hence, quantitative OCT-A may have potential usefulness in the diagnosis, staging and monitoring of glaucoma.37,39
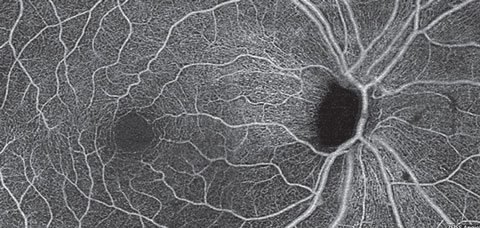 |
| Fig. 11. A superficial retina en face OCT-A montage of an eye with primary open angle glaucoma and severe thinning of the inferior NFL. OCT-A reveals darkening of the image representing loss of radial peripapillary capillaries and the superficial capillary plexus in a wedge shape fashion and extending into the macular region. Click image to enlarge. |
A Bright Future
OCT-A provides highly detailed microvascular imagery.1-3 The information it can obtain is volumetric and allows for depth resolution of lesions. It also provides tandem vascular and structural information so clinicians can draw valuable correlations between the two.1-3 The major clinical applications of OCT-A include:
- Detection and quantification of retinal nonperfusion as well as high resolution evaluation of the FAZ enabling identification of macular ischemia in retinal diseases such diabetic retinopathy, venous occlusive disease, and arterial occlusive disease.
- Detection of early diabetic retinal vascular changes prior to development of clinically evident DR.
- Detection and quantification of preretinal and CNV.
- Detection and quantification of neural retinal rim and peripapillary perfusion compromise in optic nerve diseases such as glaucoma.1,11,15,18,19,28,31-33,37-43
OCT-A may not completely replace FA, but it will serve as a complement to FA to provide valuable depth and structural information.1-3
Dr. Majcher is an assistant clinical professor at Rosenberg School of Optometry, University of the Incarnate Word in San Antonio, Texas.
Dr. Johnson is a resident at the Rosenberg School of Optometry.
| 1. De Carlo TE, Romano A, Waheed NK, et al. A review of optical coherence tomography angiography. International Journal of Retina and Vitreous. 2015 April;1(1):1-15. 2. Chalam KV, Sambhav K. Optical coherence tomography angiography in retinal diseases. J Ophthalmic Vis Res. 2016;11(1):84-92. 3. Nagiel A, Sadda S, Sarraf D. A promising future for optical coherence tomography angiography. JAMA Ophthalmol. 2015 Jun;133(6):629-30. 4. Chopdar A. Fundus fluorescein and indocyanine green angiograpy. Tunbridge Wells, UK: Anshan Ltd.; 2007. 5. Wang M. OCTA workshop Sing 2016 retinal and choroidal anatomy for the interpretation of OCTA. Online video. Available: www.youtube.com/watch?v=GkD8mHRVJ18. Accessed: Sept. 12 2016. 6. Zeiss sets the pace in oct innovation with first fda 510(k) clearance of oct angiography technology. Available: www.zeiss.com/meditec/en_us/media-and-news/latest-news/zeiss-sets-the-pace-in-oct-innovation-with-first-fda-510-k-clearance-of-oct-angiography-technology.html. Accessed: Sept 12, 2016. 7. Staurenghi G, Pellegrini M. OCTA workshop Sing 2016 Interpretation of OCTA: pearls, pitfalls artefacts part 1. Available: www.youtube.com/watch?v=YpZ41PdD4bs. Accessed: Sept. 12, 2016. 8. Non-Invasive technology that visualizes blood vessels of the retina available in US. Available: www.optovue.com/news/optovues-angiovue-imaging-system-receives-fda-clearance/. Accessed: Sept 12, 2016. 9. Nidek launches AngioScan OCT angiography software for RS-3000 advance. Available: www.nidek-intl.com/news-event/news/entry-2401.html. Accessed: Sept 12, 2016. 10. Staurenghi G, Cunha-Vaz J, Korobelnik J. Optical coherence tomography angiography of the retinal microvasculature using the zeiss AngioPlex. European Ophthalmic Review. 2015;9(2):147–56 11. Takase N, Nozaki M, Kato A, et al. Enlargement of foveal avascular zone in diabetic eyes evaluated by en face optical coherence tomography angiography. Retina. 2015 Nov;35(11):2377-83. 12. Bhanushali DR, Yadav NK, Dabir S, et al. Spectral domain optical coherence tomography angiography features in a patient of CRAO before and after paracentesis. Retina. 2016 May;36(5):e36-8. 13. Couturier A, Mané V, Bonnin S, et al. Capillary plexus anomalies in diabetic retinopathy on OCT angiography. Retina. 2015 Nov;35(11):2384-91. 14. Spaide R, Fujimoto JG, Waheed NK. Image Artifacts in OCTA. Retina. 2015 Nov;35(11):2163-80. 15. De Carlo TE, Chin AT, Bonini Filho MA, et al. Detection of microvascular changes in eyes of patients with diabetic retinopathy using optical coherence tomography angiography. Retina. 2015 Nov;35(11):2364-70. 16. Cunha-Vaz J. Diabetic retinopathy. Toh Tuk, Singapore: World scientific publishing Co. Pte. Ltd.; 2011. 17. Hwang TS, Gao SS, Liu L, et al. Automated quantification of capillary nonperfusion using optical coherence tomography angiography in diabetic retinopathy. JAMA Ophthalmol. 2016;134(4):367-73. 18. Hwang TS, Jia Y, Gao SS, et al. OCT angiography features of diabetic retinopathy. Retina. 2015 Nov;35(11):2371-6. 19. Matsunaga DR, Yi JJ, De Koo LO, et al. Optical coherence tomography angiography of diabetic retinopathy in human subjects. Ophthalmic Surg Lasers Imaging Retina. 2015 Sep;46(8):796-805. 20. Campochiaro PA, Wykoff CC, Shapiro H, et al. Neutralization of vascular endothelial growth factor slows progression of retinal nonperfusion in patients withdiabetic macular edema. Ophthalmology. 2014 Sep;121(9):1783-9. 21. Silva PS, Dela Cruz AJ, Ledesma MG, et al. Diabetic retinopathy severity and peripheral lesions are associated with nonperfusion on ultrawide field angiography. Ophthalmology. 2015 Dec;122(12):2465-72. 22. Kernt M, Cserhati S, Seidensticker F, et al. Improvement of diabetic retinopathy with intravitreal Ranibizumab. Diabetes Res Clin Pract. 2013 Apr;100(1):e11-3. 23. Brown DM, Schmidt-Erfurth U, Do DV, et al. Intravitreal aflibercept for diabetic macular edema: 100-week results from the vista and vivid studies. Ophthalmology. 2015 Oct;122(10):2044-52. 24. Ishibazawa A, Nagaoka T, Takahashi A. et al. Optical coherence tomography angiography in diabetic retinopathy: a prospective pilot study. Am J Ophthalmol. 2015 Jul;160(1):35-44.e1. 25. Lane M, Moult EM, Novais EA, et al. Visualizing the choriocapillaris under drusen: comparing 1050-nm swept-source versus 840-nm spectral-domain optical coherence tomography angiography. Invest Ophthalmol Vis Sci. 2016 Jul 1;57(9):OCT585-90. 26. Gelfand BD, Ambati J. A revised hemodynamic theory of age-related macular degeneration. Trends Mol Med. 2016 Aug;22(8):656-70. 27. Choi W, Moult EM, Waheed NK, et al. Ultrahigh-speed, swept-source optical coherence tomography angiography in nonexudative age-related macular degeneration with geographic atrophy. Ophthalmology. 2015 Dec;122(12):2532-44. 28. Jia Y, Bailey ST, Wilson DJ, et al. Quantitative optical coherence tomography angiography of choroidal neovascularization in age-related macular degeneration. Ophthalmology. 2014 Jul;121(7):1435-44. 29. Pauleikhoff D. Neovascular age-related macular degeneration: natural history and treatment outcomes. Retina. 2005 Dec;25(8):1065-84. 30. Viola F, Massacesi A, Orzalesi N, et al. Retinal angiomatous proliferation: natural history and progression of visual loss. Retina. 2009 Jun;29(6):732-9. 31. Muakkassa NW, Chin AT, de Carlo T, et al. Characterizing the effect of anti-vascular endothelial growth factor therapy on treatment-naïve CNV using OCT angiography. Retina. 2015 Nov;35(11):2252-9. 32. Coscas G, Lupidi M, Coscas F, et al. Optical coherence tomography angiography during follow-up: qualitative and quantitative analysis of mixed type I and II choroidal neovascularization after vascular endothelial growth factor trap therapy. Ophthalmic Res. 2015;54(2):57-63. 33. Marques JP, Costa JF, Marques M, et al. Sequential morphological changes in the cnv net after intravitreal anti-vegf evaluated with OCT angiography. Ophthalmic Res. 2016;55(3):145-51. 34. Coscas GJ, Lupidi M, Coscas F, et al. OCT angiography versus traditional multimodal imaging in assessing the activity of exudative age-related macular degeneration: a new diagnostic challenge. Retina. 2015 Nov;35(11):2219-28. 35. Palejwala NV, Jia Y, Gao SS, et al. Detection of nonexudative CNV in age-related macular degeneration with OCT angiography. Retina. 2015 Nov;35(11):2204-11. 36. Jia Y, Morrison J, Tokayer J, et al. Quantitative OCT angiography of optic nerve head blood flow. Biomedical optics express. 2012 Dec 1;3(12):3127-37. 37. Yarmohammadi A, Zangwill L, Diniz-Filho A, et al. Optical coherence tomography angiography vessel density in healthy, glaucoma suspect, and glaucoma eyes. Invest Ophthalmol Vis Sci. 2016 Jul 1;57(9):Oct451-9. 38. Jia Y, Wei E, Wang X, et al. Optical coherence tomography angiography of optic disc perfusion in glaucoma. Ophthalmology. 2014 Jul;121(7):1322-32. 39. Liu L, Jia Y, Takusagawa HL, et al. Optical coherence tomography angiography of the peripapillary retina in glaucoma. JAMA Ophthalmol. 2015 Sep;133(9):1045-52. 40. Wang X, Jiang C, Ko T, et al. Correlation between optic disc perfusion and glaucomatous severity in patients with open-angle glaucoma: an optical coherence tomography angiography study. Graefes Arch Clin Exp Ophthalmol. 2015 Sep;253(9):1557-64. 41. Kashani AH, Lee SY, Moshfeghi A, et al. OCT angiography of retinal venous occlusion. Retina. 2015 Nov;35(11):2323-31. 42. Suzuki N, Hirano Y, Yoshida M, et al. Microvascular abnormalities on optical coherence tomography angiography in macular edema associated with branch retinal vein occlusion. Am J Ophthalmol. 2016 Jan;161:126-132.e1. 43. Bonini Filho MA, Adhi M, de Carlo TE, et al. OCT angiography in retinal artery occlusion. Retina. 2015 Nov;35(11):2339-46. |