While none of the imaging technologies has definitively changed the standard of care in glaucoma management, they have proven beneficial in many practices. Although certain imaging technologies have been validated to some extent in clinical studies, there are still many unanswered questions about their role in glaucoma management.
Glaucoma imaging technologies work by detecting thinning of the retinal nerve fiber layer (RNFL), as with ocular coherence tomography (OCT) and scanning laser polarimetry (GDx VCC, Carl Zeiss Meditec Inc.), or through topographic evaluation of the optic nerve and peripapillary retina, as with confocal scanning laser ophthalmoscopy (Heidelberg Retina Tomograph-3, Heidelberg Engineering). This article focuses on using OCT to enhance your glaucoma work-up and management, while recognizing its limitations.
SD-OCT vs. TD-OCT
In general, OCT’s role in glaucoma management cannot be translated to other technologies such as GDx VCC or HRT-3. The inherent differences in the way that these devices measure structural changes secondary to glaucoma require looking at the devices individually to determine their effectiveness for the various stages of glaucoma. So, for simplicity, this article discusses only OCT.
OCT is a dynamic imaging device that generates a high-resolution, in vivo cross sectional view of the retina that enables accurate measurement of the RNFL thickness.1 It is well known that thinning of the RNFL can occur before visual field defects manifest, and that progressive RNFL thinning is a hallmark of advancing glaucoma.2 So, OCT RNFL analysis has great potential for early detection and management of the disease.
Two different OCT technologies are currently commercially available: time-domain OCT (TD-OCT: Stratus OCT, Carl Zeiss Meditec) and spectral-domain OCT (SD-OCT). There are clear clinical advantages to using SD-OCT over the older TD-OCT technology: improved resolution of the retinal layers, repeatability, and faster scans. However, much of the clinical research that verifies OCT’s ability to detect glaucoma is based upon the Stratus OCT. Additionally, the Stratus OCT is still widely used in clinical practice, so it is worthwhile to consider its clinical attributes.3
GPA for RNFL
For diagnostic purposes, the Stratus OCT has been proven to differentiate most normal eyes from glaucomatous eyes.1 Therefore, the Stratus OCT can be an important management tool for glaucoma suspects and ocular hypertensives. For patients with known glaucoma, the Stratus OCT can be used to monitor glaucomatous RNFL loss over time, but with some caveats.
Recent studies have shown that the Stratus OCT is capable of recognizing glaucomatous RNFL progression.1,3,4 Despite this, we know that the Stratus OCT is incapable of measuring the same peripapillary location on consecutive scans. This is due to subjective peripapillary ring placement and slow scan speed, which has a deleterious effect on repeatability because of eye movement. So, when you compare follow-up RNFL scans with your baseline values, you must consider that the changes in RNFL thickness may be secondary to variability in the measurements. In general, when integrating OCT RNFL analysis into your glaucoma management decisions, you must be able to recognize errant OCT findings that do not fit the overall clinical picture.
A more sophisticated way to track RNFL thickness changes over time is to utilize the guided progression analysis software (GPA Advanced Serial Analysis) for the Stratus OCT. The OCT GPA software performs a trend-based analysis of serial RNFL measurements and looks for changes in RNFL thickness compared to the baseline scan.4 A recent study has shown that the OCT GPA is capable of detecting significant RNFL thinning, both locally (quadrants) and globally (average thickness).4
OCT GPA can also determine the rate of RNFL thinning, which could impact how aggressively you treat your patients. Glaucoma patients with RNFL progression that was detected by OCT GPA did not always show progression of their visual field defects.4 At present, it is unclear what the impact is on functional vision loss if RNFL progression is detected by OCT GPA.
Review of New SD-OCTs
As OCT continues to be tested in clinical studies for its use in glaucoma management, there are indications that it may outperform other imaging modalities, such as confocal scanning laser polarimetry and scanning laser polarimetry.5-8 A recent study showed that visual field defects correlated better with RNFL thinning detected by SD-OCT compared to scanning laser polarimetry.6 In another study, SD-OCT was found to have better diagnostic sensitivity for detecting glaucoma than HRT.5
The profound advantages of SD-OCT over TD-OCT have further solidified OCT’s role in glaucoma imaging, making it more relevant now than ever before. There are multiple SD-OCTs commercially available, and each one continues to undergo clinical studies to validate its role in glaucoma management. This review focuses on two new SD-OCT units: Cirrus HD-OCT (Carl Zeiss Meditec) and Spectralis SD-OCT (Heidelberg Engineering).
While Spectralis OCT and Cirrus HD-OCT are both SD-OCT devices, they take a different approach to data acquisition. Cirrus HD-OCT measures RNFL thickness within a cubed area, allowing point-by-point evaluation of nearly all areas within it. The Optic Disk Cube 200 x 200 protocol is a 6mm square grid composed of 200 horizontal scan lines that each render 200 A-scans.9 The Cirrus HD-OCT automatically generates a 3.46mm diameter peripapillary calculation circle utilizing the acquired cube data, identifies the optic disc center, and positions the ring accordingly.
In comparison, the Spectralis OCT RNFL imaging protocol requires manual centration of its 3.45mm peripapillary ring. This process is made easier with the TruTrack software that stabilizes the scan image and eliminates the need to “chase” the optic nerve head while trying to center the ring. The Spectralis OCT utilizes confocal scanning laser ophthalmoscopy to employ its TruTrack system, which allows for retina recognition.
This feature allows the OCT to lock in on the retina so that even if the patient’s eye is moving, the image is stable. This improves cross-section resolution by filtering out image noise. Also, it allows for unprecedented repeatability of scans (within 1µm), which is crucial when comparing follow-up RNFL scans.10
However, unlike the Cirrus HD-OCT, which has OCT GPA software available, the Spectralis OCT does not currently have any means to decipher statistically significant changes with serial RNFL thickness readings.
Suspects and Early Glaucoma
Ideally, we should be able to detect the earliest signs of glaucoma to ensure proper oversight of this lifelong disease and for timely medical intervention to prevent functional vision loss. RNFL imaging devices offer a means to objectively detect early glaucoma in some patients who have subtle or subclinical changes. If a reliable scan (i.e., good scan quality and centered ring placement) is obtained, then the OCT is able to detect RNFL thinning in early glaucoma patients, making it a valuable diagnostic tool.11
OCT can be used to differentiate suspicious optic nerves that have abnormal structural characteristics (i.e., large cupping, thin neuroretinal rims, optic disc tilt, peripapillary atrophy) that are not secondary to glaucoma. For instance, a tilted or obliquely inserted optic disc often obscures the appearance of the neuroretinal rim and cup-to-disc ratio, to the point that a healthy optic nerve may appear glaucomatous.
Using OCT to verify normal RNFL thickness will help prevent a misdiagnosis of glaucoma. OCT is capable of detecting RNFL thinning in glaucomatous eyes with tilted discs, and has good correlation with the severity of visual field loss.12 (One study found that patients with tilted disc syndrome, who did not have glaucoma, tended to have thinning of the superior RNFL compared to normals. So, be cautious when using OCT to analyze the superior neuroretinal rim in tilted discs.13)
Although OCT provides valuable information about RNFL thickness, it is not essential for making a diagnosis of glaucoma. So, for diagnostic purposes, OCT at this time cannot replace a detailed optic nerve and RNFL evaluation with a fundus lens. However, it can add credibility to subtle clinical findings and is an important tool in any glaucoma practice.
OCT and Progression
The current standard for monitoring structural changes in glaucoma is by longitudinally tracking stereophotographs of the optic nerve. Although this can be an effective method of detecting subtle optic nerve head changes over time, stereophotography is not readily available in most clinics, and it requires a trained reader.
Given the difficulty in detecting structural progression of glaucoma, most clinicians monitor changes with optic nerve drawings, 2-D fundus photographs or cup-to-disc ratio measurements. These methodologies have well known inherent flaws, such as inter- and intra-clinician variability and, in the case of 2-D fundus photography, the lack of stereopsis precludes detailed evaluation of the neuroretinal rim. Thus, imaging devices that can objectively detect RNFL thinning would be invaluable.
Measuring glaucoma progression using visual fields is very difficult, even with sophisticated progression software. Humphrey visual field-guided progression analysis software is useful in patients who are good visual field testers.
But, many of our glaucoma patients are poor visual field testers, and subjective analysis of glaucoma progression in these patients is very difficult. The ability to measure RNFL thickness accurately and objectively over time could circumvent the confounding findings of visual fields.
As discussed above, we can accurately measure the RNFL thickness over time, but we do not have a full understanding of what the changes mean. More studies are needed to answer important questions such as: What is a normal amount of RNFL change due to aging? Are there racial differences in age-related RNFL changes? How does RNFL thickness change correlate with visual field change? And, how do various glaucoma therapies affect RNFL progression?
We know that RNFL loss can precede visual field loss, but we don’t know what amount of glaucomatous RNFL thinning will manifest visual field loss. As we gather more data and as technologies improve further, there is a real chance that monitoring the RNFL with imaging devices will become standard of care. At this point, it is too early to make it a gold standard.
|
Clinical Pearl: Segmentation Line Errors
|
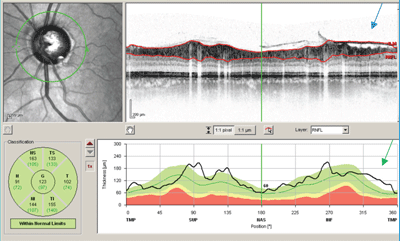
| When used for RNFL analysis, OCT automatically determines the anterior and posterior boundaries of the RNFL, which are displayed as segmentation lines (seen as red lines on the cross-sectional view). Occasionally, the OCT erroneously demarcates the anterior and posterior borders of the RNFL, resulting in unreliable RNFL measurements (below). This typically happens with poor scan quality, disruption of the structural integrity of the retina, or if there are prominent vitreous opacities. Don’t overlook segmentation line errors; the abnormal findings are not always reflected in the RNFL analysis report. |
|
|
This Spectralis OCT RNFL scan shows a segmentation line error (blue arrow) at the inferior temporal quadrant secondary to interception of the signal by the posterior vitreous face. In this case, the inferior temporal RNFL thickness is measured as abnormally thick (green arrow). The classification chart notes that the RNFL thickness is within normal limits. |
OCT and Advanced Glaucoma
The most important and often the most difficult aspect of managing patients with advanced glaucoma is determining progression. In general, these patients have severely attenuated neuroretinal rims and RNFL, making it even more difficult to track structural progression. Visual field analysis can also be confounding in patients with advanced glaucoma, and detection of functional progression can sometimes be impossible. So, the ability to measure minimal RNFL thinning would be a significant advantage in managing advanced glaucoma.
Because SD-OCT has a resolution of up to 5µm of thickness, and because the repeatability of this device can be within 1µm, SD-OCT could become an important management tool for detecting subclinical structural changes in advanced glaucoma.
However, as the RNFL thins to the point that there is almost no residual ganglion cell layer, it becomes very difficult to detect significant change with OCT. There is essentially a “floor” effect that occurs with advanced RNFL loss, in which the OCT can no longer differentiate thickness change from glaucoma as opposed to noise in the measurements (see “Clinical Pearl: Segmentation Line Errors”).14 In this regard, using OCT to detect change in patients with advanced glaucoma may be less beneficial compared to monitoring visual field status.
Overall, when looking at rate of glaucoma progression, OCT tends to perform worse in patients with advanced glaucoma compared to visual fields. In advanced disease, it may be more beneficial to detect progression using threshold visual fields.4
Furthermore, OCT is unable to detect optic disc hemorrhages, which are important and easily identifiable indicators of glaucoma progression in patients with advanced disease.15 So, the use of imaging devices in these patients is not likely to yield useful information until more studies are conducted about these relationships.
Glaucoma imaging devices and visual field progression software are providing new insight in management, but we have yet to fully understand their role for diagnosis and monitoring disease progression.
Despite the many advantages of these sophisticated imaging and software systems, integrating them into your practice will not always simplify your ability to diagnose and manage glaucoma.
Rather, it forces the clinician to draw upon a full understanding of the disease to effectively integrate the results into your patient’s glaucoma picture. Furthermore, the clinician must recognize the limitations of the information generated with these technologies. Only then can you take advantage of the unique capabilities of these devices, and use them toward your patients’ benefit.
Dr. Anthony currently practices at the Louis Stokes VA Medical Center in Cleveland, Ohio.
1. Lee EJ, Kim TW, Park KH, et al. Ability of Stratus OCT to detect progressive retinal nerve fiber layer atrophy in glaucoma. Invest Ophthalmol Vis Sci. 2009 Feb;50(2):662-8.
2. Mardin CY, Horn FK, Jonas JB, Budde WM. Preperimetric glaucoma diagnosis by confocal scanning laser tomography of the optic disc. Br J Ophthalmol. 1999 Mar;83(3):299-304.
3. Medeiros FA, Zangwill LM, Alencar LM. Detection of glaucoma progression using Stratus OCT retinal nerve fiber layer, optic nerve head, and macular thickness measurements. Invest Ophthalmol Vis Sci. 2009 Dec;50(12):5741-8.
4. Leung CK, Cheung CY, Weinreb RN, et al. Evaluation of retinal nerve fiber layer progression in glaucoma: A study on optical coherence tomography guided progression analysis. Invest Ophthalmol Vis Sci. 2010 Jan;51(1):217-22.
5. Leung CK, Ye C, Weinreb RN, et al. Retinal nerve fiber layer imaging with spectral-domain optical coherence tomography: A study on diagnostic agreement with Heidelberg Retinal Tomograph. Ophthalmology. 2010 Feb;117(2):267-74.
6. Horn FK, Mardin CY, Laemmer R, et al. Correlation between local glaucomatous visual field defects and loss of nerve fiber layer thickness measured with polarimetry and spectral domain OCT. Invest Ophthalmol Vis Sci. 2009 May;50(5):1971-7.
7. Schrems WA, Mardin CY, Horn FK, et al. Comparison of scanning laser polarimetry and optic coherence tomography in quantitative retinal nerve fiber layer assessment. J Glaucoma. 2010 Feb;19(2):83-94.
8. Moreno-Montañés J, Antón A, García N, et al. Comparison of retinal nerve fiber layer thickness values using Stratus optical coherence tomography and Heidelberg Retina Tomograph-III. J Glaucoma. 2009 Sep;18(7):528-34.
9. Vizzeri G, Weinreb R, Gonzalez-Garcia A, et al. Agreement between spectral-domain and time-domain OCT for measuring RNFL thickness. Br J Ophthalmol. 2009 Jun;93(6):775-81.
10. Wolf-Schnurrbusch UE, Ceklic L, Brinkmann CK, et al. Macular thickness measurements in healthy eyes using six different optical coherence tomography instruments. Invest Ophthalmol Vis Sci. 2009 Jul;50(7):3432-7.
11. Yüksel N, Altintas O, Ozkan B, et al. Discriminating ability of optical coherence tomography data in staging glaucomatous damage. Can J Ophthalmol. 2009 Jun;44(3):297-307.
12. Yu S, Tanabe T, Hangai M, et al. Scanning laser polarimetry with variable corneal compensation and optical coherence tomography in tilted disk. Am J Ophthalmol. 2006 Sep;142(3):475-82.
13. Moschos MM, Triglianos A, Rotsos T, et al. Tilted disc syndrome: an OCT and mfERG study. Doc Ophthalmol. 2009 Aug;119(1):23-8.
14. Knight OJ, Chang RT, Feuer WJ, Budenz DL. Comparison of retinal nerve fiber layer measurements using time domain and spectral domain optical coherent tomography. Ophthalmology. 2009 Jul;116(7):1271-7.
15. Lan YW, Henson DB, Kwartz AJ. The correlation between optic nerve head topographic measurements, peripapillary nerve fiber layer thickness, and visual field indices in glaucoma. Br J Ophthalmol. 2003 Sep;87(9):1135-41.