43rd Annual Technology ReportCheck out the other feature articles in this month's report:- Glaucoma: How to Build a Better Baseline - The Many Uses of Orbital Ultrasonography - Tighten Your Testing Protocols to Pass an Audit |
Optical coherence tomography angiography (OCT-A) is a noninvasive, dyeless imaging modality that has emerged as an important tool in eye care. It provides three-dimensional, volumetric images of the retinal and choroidal vasculature, which are ideal for evaluating any number of ocular conditions such as diabetic retinopathy (DR), age-related macular degeneration (AMD) and glaucoma.
This imaging technology has widespread clinical utility as a noninvasive alternative to traditional fluorescein angiography (FA) for viewing retinal and choroidal microvasculature in detail.
OCT-A was developed as a special application of standard spectral-domain OCT (SD-OCT) B-scans. By analyzing both standard OCT and OCT-A scans, clinicians have a comprehensive look at the retina, optic nerve and choroid, with information about the structure, vascular perfusion and the dynamic changes in blood flow.
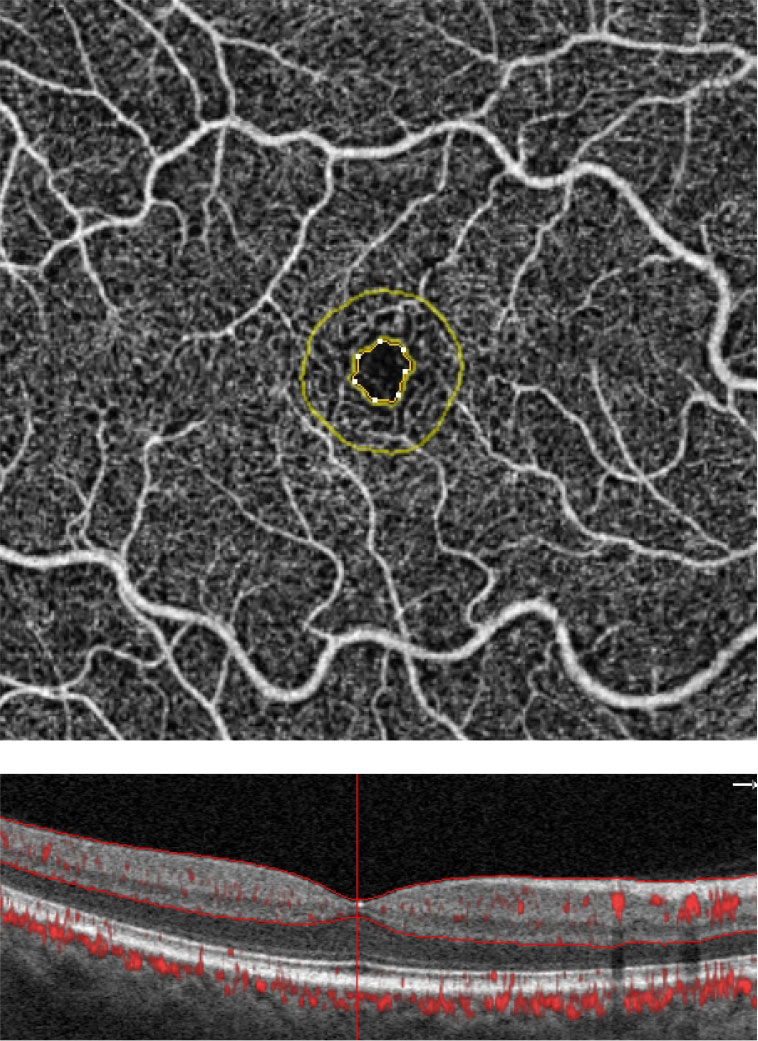 |
| These are the FAZ metrics in a normal patient. Software analytics allow for an objective means of quantifying the FAZ and the surrounding area. The FAZ’s perimeter is outlined in yellow. Simultaneous visualization of the OCT angiogram alongside the structural B-scan provides optimal image interpretation. Click image to enlarge. |
Scan Anatomy
Each OCT-A angiogram is based on predefined segmentation slabs that provide precise visualization of the vascular supply to the specified area. Automated slabs or preset maps vary by device but often include: vitreoretinal interface map, superficial capillary plexus (SCP) map, deep capillary plexus (DCP) map, outer retinal or avascular map, choriocapillaris map and choroidal map.
OCT-A in Practice
As with any new device, OCT-A’s adoption in clinical practice has been slow. Many clinicians remain unsure of its utility within their practice, as it depends largely on each practice’s existing patient base and future plans. For instance, if the patient base is generally young and healthy, OCT-A is not essential.
OCT-A also has a few limitations that make some doctors wary. For example, because the technology uses a motion decorrelation algorithm, any motion—including blinks and saccades—may result in image artifacts. This can make image interpretation challenging for novice users. In addition, OCT-A does not image leakage, which limits its usefulness in some respects.
OCT-A is also more expensive than a standard SD-OCT device. However, if a practice has a patient base that includes a steady flow of people over the age of 50 at risk for AMD, glaucoma and diabetes, then the practice could justify the upgrade to OCT-A. For practices looking to focus on posterior segment disease management, OCT-A could be a true game-changer for both the practice and patients.
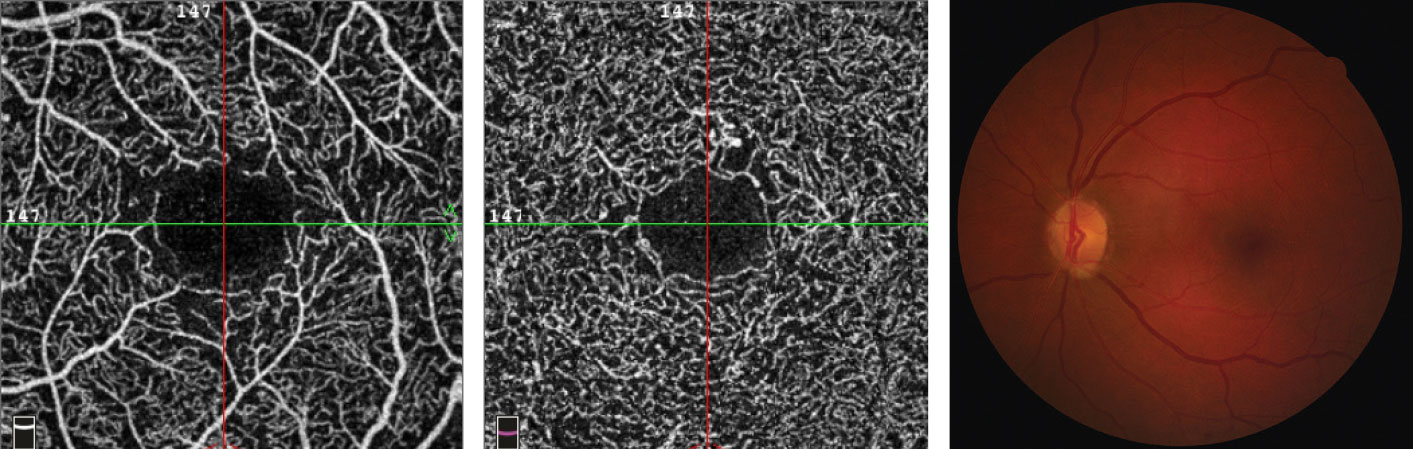 |
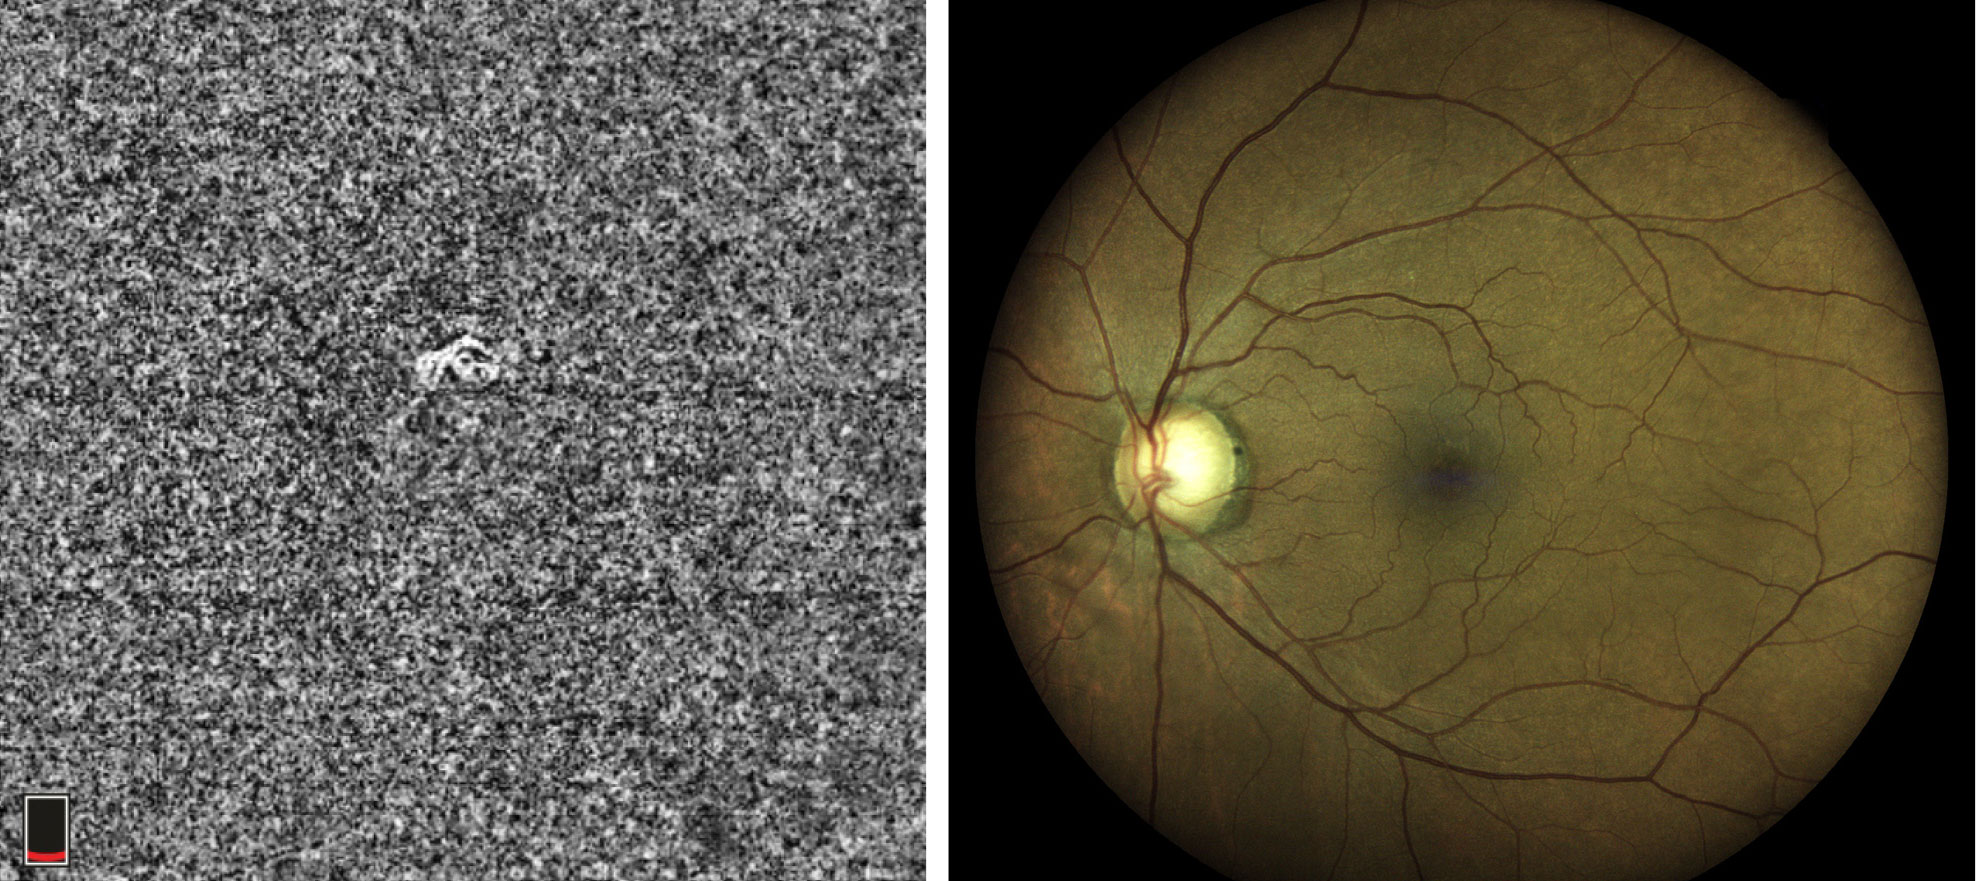
| This 65-year-old female with a 14-year history of diabetes shows no signs of retinopathy on fundus imaging, right. However, she has an HbA1C of 6.8% with unknown daily blood sugar levels. Her SCP OCT-A images, left, and DCP B-scans, center, show an enlarged FAZ with indistinct borders, capillary non-perfusion surrounding the fovea with scattered areas devoid of flow and microaneurysms. Click image to enlarge. |
Clinicians who answer “Yes” to any of these three questions could benefit from an OCT-A device in their practice:
1. Do you see a lot of patients with diabetes? This condition has become a worldwide epidemic and the leading cause of vision loss among working-age adults in the developed world.1 Optometrists are at the forefront of providing eye care for these patients. Despite better medication and therapeutic options, diabetic retinopathy is a mounting healthcare concern.
Before the advent of OCT-A, patients with mild or no diabetic retinopathy were considered well controlled and seen annually. Research now shows that OCT-A can provide early, pre-clinical identification of microvascular abnormalities such as microaneurysms, enlarged foveal avascular zone (FAZ), capillary non-perfusion, vascular remodeling, capillary tortuosity and dilatation and impairment of choriocapillaris flow.2-4 In addition, OCT-A parameters may also assist in the detection of diabetic macular ischemia.
Familiarity with these morphological changes common in diabetes can assist in early identification of disease. For example, the FAZ is defined as a round, “capillary-free” zone within the central macula with a homogenous, dense capillary network.5 Its size, contour and border characteristics on OCT-A have been studied extensively with regards to diabetic retinopathy, and research shows FAZ perfusion and architecture is directly correlated with a patient’s visual function.2
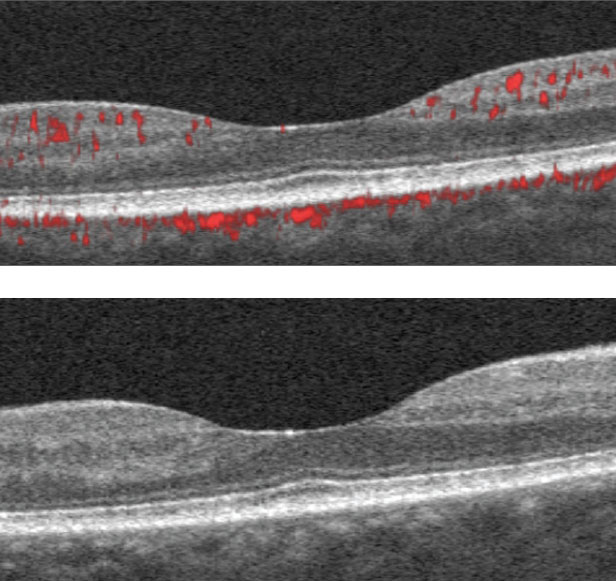 |
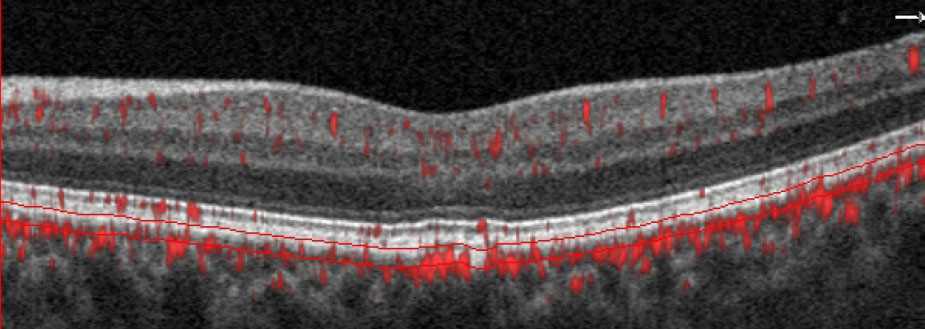
| The SD-OCT B-scans show scattered hyper-reflective foci within the inner retina consistent with mild diabetic retinopathy. Click image to enlarge. |
In diabetic retinopathy, the borders of the FAZ may become irregular and patchy due to the loss of integral vascular capillary networks. This results in an overall enlargement of the area of the FAZ within the SCP and DCP, which may be present even before ophthalmoscopic evidence of retinopathy develops.4,6
Research suggests assessing the size and characteristics of the FAZ can provide insight into both the disease severity and visual prognosis.7,8 FAZ assessment can also help to determine efficacy of various treatment modalities.9-11 Similarly, fewer microaneurysms within the SCP and DCP on OCT-A correlates with a better outcome for patients with diabetic macular edema treated with anti-vascular endothelial growth factor injections.12
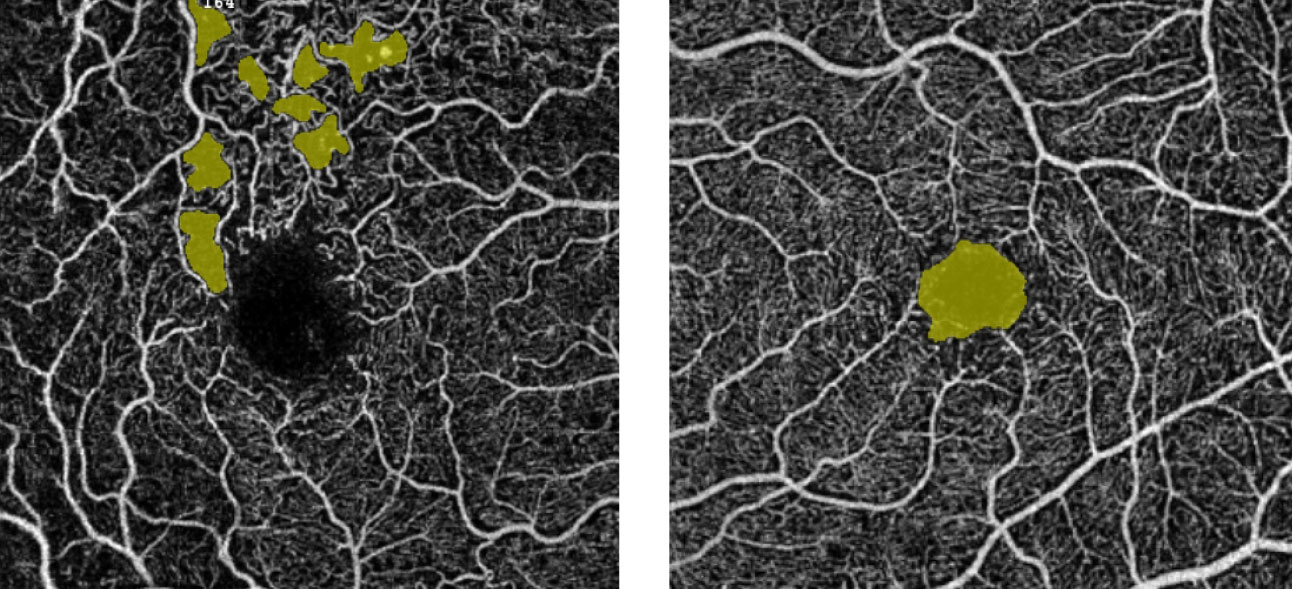 |
| The “no-flow” tool measurement for a patient with diabetes allows for quantification of flow voids in pre-selected areas. The left panel shows scattered areas of non-perfusion highlighted in yellow; the right panel highlights the FAZ. Click image to enlarge. |
Another quantitative measure of particular use in assessing diabetic retinopathy is vessel density. Vessel density is defined as the proportion of blood vessel area over the total measured area.13 Patients with diabetic retinopathy will typically have less vessel density in their SCP and DCP, indicating a state of altered vascular perfusion. Even in patients with diabetes not manifesting retinopathy, the vessel density within the DCP is reduced compared with normal eyes, suggesting that the initial source of parafoveal capillary non-perfusion may be at the level of the deep plexus.14-16
Getting a close look at these microvascular changes before they are visible ophthalmoscopically can have a huge impact on how clinicians manage patients with diabetes—it may even alter the course of the disease and help to eradicate sight-threatening sequelae.17 Quantifying the FAZ and non-perfused areas using OCT-A can help clinicians stage non-proliferative DR and can be an accurate means of predicting possible disease progression.18-20
Visualizing early signs of disease will ultimately allow for more timely communication with the patient’s internist and optimize the overall outcome. Clinicians can repeat OCT-A imaging after modulation of glycemic control, and reassess perfusion values to help determine efficacy of treatment.
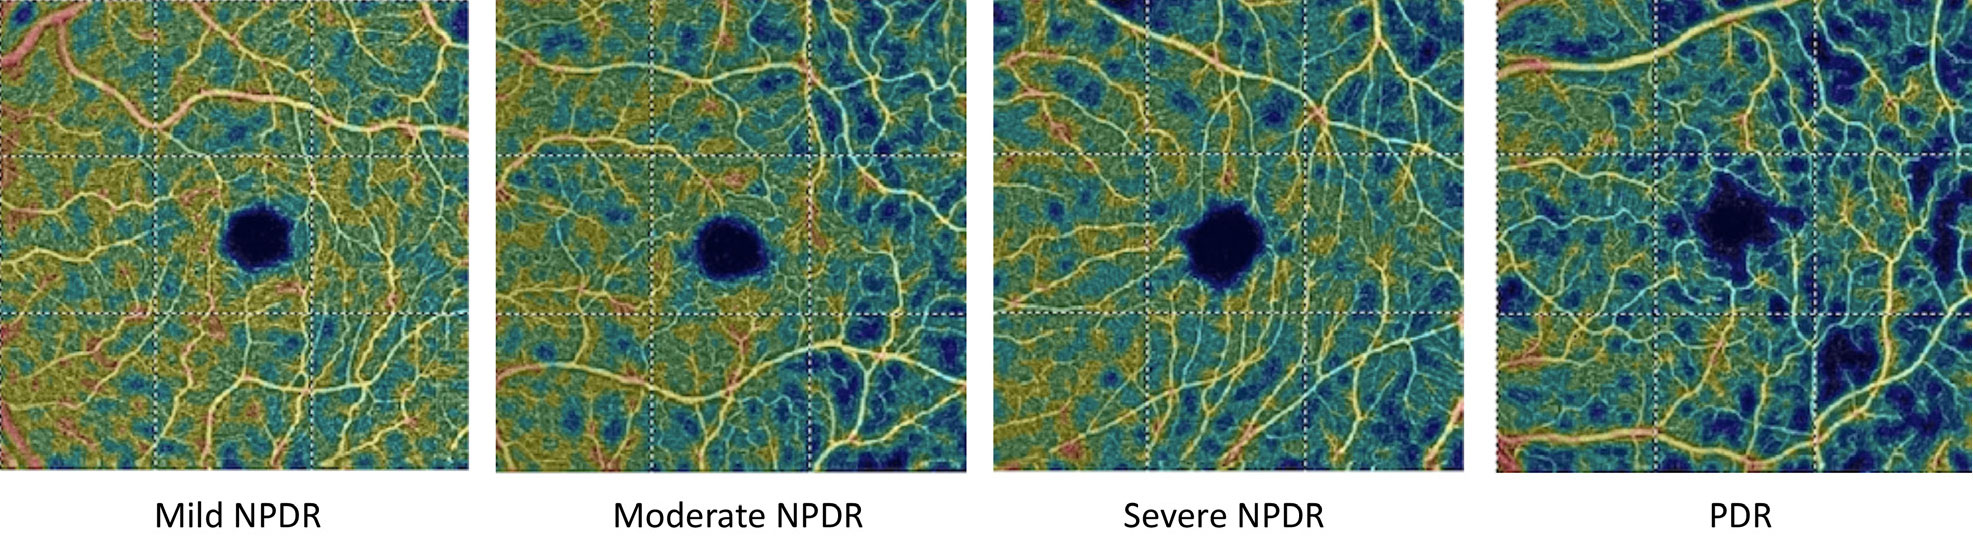 |
| These OCT-A vessel density analysis images depict the decreased blood flow with increasing diabetic retinopathy severity. Click image to enlarge. |
2. Do you want to avoid unnecessary AMD referrals? Clinicians often encounter SD-OCT B-scans on which it’s difficult to discern evidence of neovascular activity. Perhaps a patient has a history of dry AMD but their fundus exam looks suspicious for conversion. The SD-OCT B-scans show soft, confluent drusen, extensive pigment epithelial detachments of variable hyper-reflectivity and serous fluid that may be suggestive of underlying vascular activity; yet, the clinical picture leaves a measure of doubt. Without OCT-A, clinicians must obtain FA or indocyanine green angiography (ICGA), which usually involves consulting with a retina specialist.
Historically, AMD has been classified as non-exudative, or dry, and exudative, or wet. Exudative AMD is characterized by the presence of fluid, lipid exudate or blood.21 The membrane extends from the choriocapillaris anteriorly towards the retinal pigment epithelium (RPE); classic membranes course over the RPE while occult membranes reside under the RPE.
FA and ICGA capture the source of leakage through dye visualization of the anomalous vasculature.21 Occult membranes are best visualized with ICGA, and patients should be referred to a retinal specialist that uses this technology. Proper identification and classification of the lesion can streamline the referral process and guide the management.
 |
 |
| This 63-year-old African American male is a glaucoma suspect with no visible abnormality noted in the macula on fundus examination. However, the choriocapillaris slab and the B-scan with segmentation lines set at the choriocapillaris depict a non-exudative occult choroidal neovascular membrane. In this case, OCT-A identified a naïve macular lesion that was not visible clinically, allowing for timely referral and comanagement. Click images to enlarge. |
While beneficial diagnostic tools, these technologies involve the use of intravenous dyes that can cause adverse effects for certain patients and are even contraindicated in high-risk populations.22 Reported side effects range from mild, including nausea, vomiting, itching/hives and fainting, to more severe concerns such as heart attack, bronchospasm, laryngeal edema and anaphylaxis. Dye-based procedures should be avoided in pregnant women and patients with a history of renal failure or allergy to dye/iodine or shellfish.22 In addition, the retinal consult can be costly for patients and requires additional time out of work.
In cases of suspected wet AMD or other conditions that cause choroidal neovascularization (CNV), OCT-A now allows for visualization of potential abnormal blood vessels in-office—reserving referrals for necessary cases.
OCT-A can provide detailed visualization of CNV secondary to AMD and other maculopathies, and the automated angiogram segmentation maps of the outer retina and choriocapillaris allow for precise identification of lesion location and characteristics. Such evaluation of CNV structure can assist in the classification and differentiation of the lesion and can drive management and referral decisions.
When to Consider Upgrading Your OCTBy Jane Cole, Contributing Editor Since OCT came on the market nearly two decades ago, this ever-evolving technology has become a staple for diagnosing and monitoring myriad ocular conditions, from detecting retinal nerve fiber layer (RNFL) loss in glaucoma patients to tracking corneal epithelial thickness following refractive surgery. As new OCT applications hit the market, optometrists who already have an OCT may wonder when to upgrade and whether switching platforms is worth the headaches. “You need to consider upgrading your OCT device when it is no longer able to measure with the precision and resolution required to diagnose and treat conditions that are commonly managed by doctors of optometry,” says Jeannette Wong-Powell, OD, clinical assistant professor at the Rosenberg School of Optometry in San Antonio. Ten years ago, clinicians marveled at OCT’s ability to measure retinal thickness and used it extensively to detect diabetic macular edema and RNFL thinning in glaucomatous eyes, she adds. But the OCTs of today are far more advanced in their capabilities. These five considerations can help you make the right decision when pondering whether or not to upgrade your OCT: 1. Get the facts. It’s important to research and check peer-reviewed studies that offer evidence that prove these new technologies offer superior diagnostic and progression analysis, says Lee Vien, an optometrist at the Veterans Affairs Palo Alto Healthcare System. New technology is constantly being developed, but as a clinician, you have to consider if these new platforms are clinically applicable and supported by the literature, he says. 2. Weigh the cost. A doctor’s biggest consideration is likely the cost association with upgrading to a newer model OCT, Dr. Vien says. With this in mind, you must consider an instrument that is advanced in hardware but also supports software upgrades in the future, he adds. “Many OCT instruments release new software upgrades that allow new scans and analysis without the need for new hardware,” Dr. Vien says. “You want an instrument that will be supported by the manufacturer for many years. In addition, it’s best not to seek out an equivalent level of technology but instead take the next step despite the increased price, says optometrist Mile Brujic of Bowling Green, Ohio. In 2006, Dr. Brujic bought his first spectral-domain OCT after debating whether to opt for a time-domain system that was significantly less expensive. “We realized if we bought time-domain, literally in a few years it would’ve been obsolete. So you always want to incorporate the newest technology,” Dr. Brujic says. 3. Count the clinical uses. Clinicians should consider whether the instrument allows scans and analysis of both anterior and posterior segment, including optic nerve/RNFL thickness, macula/retina thickness, angle assessment, corneal thickness/pachymetry and OCT-A, Dr. Vien suggests. “This allows you to have an instrument that can be versatile,” he says. “You can do a full glaucoma evaluation and get an optic nerve scan, a ganglion cell scan, angle assessment and corneal pachymetry all in one instrument.” One potential plus: you may not need to purchase all the licenses right away if cost is an issue, Dr. Vien says. As long as the hardware is built-in, you can always upgrade the software in the future. 4. Look at patient care. Whatever instrument you have your eye on, it must provide a benefit to patient care. Newer anterior segment OCTs provide larger corneal scans, which gives the clinician even more information for diagnosis and management of the patient, Dr. Brujic explains. These advanced scans can also help determine whether a patient is qualified for a medically necessary lens, he adds. As for posterior segment imaging, OCT-A may be the next step, Dr. Brujic says. He treats dozens of healthy diabetes patients who say their HbA1c levels are fine and their physicians are generally happy with their measurements. However, Dr. Brujic says these patients sometimes admit that they cheat on their diet. In these instances, Dr. Brujic uses OCT-A to measure the patient’s FAZ. Even in the absence of traditional diabetic retinopathy, angiography’s advanced measurements of the retina can show increased FAZ and capillary dropout outside of that macular region. 5. Investigate other manufacturers. Switching between technology platforms may pose some challenges. For example, changing OCT manufacturers could create some difficulty in monitoring the optic nerve for subtle RNFL thinning/progression due to variability between machines. “Since each instrument has its own proprietary technology for acquiring data and analysis, this will pose an issue when tracking disease progression between different instruments,” Dr. Vien says. “This can even occur with instruments from the same manufacturer.” In addition, the normative database used for each instrument is different, he says. When Dr. Vien adds a new OCT instrument or upgraded software with a different normative data, he obtains a new baseline with the new instrument once the patient is stable on the older OCT platform, and the patient will then be followed with the new technology. “These challenges are present but manageable, given the benefits offered by having multiple manufacturers and platforms to choose from,” Dr. Wong-Powell says. “It’s also worthwhile to remember that despite OCTs being very accurate, there is a constant need and responsibility by the doctor to integrate OCT information with other clinical findings to see the big picture.”
One final piece of advice from Dr. Brujic: “If you’re thinking about upgrading your OCT, make sure you’re using the most advanced technology because technology will change. If you don’t get the most advanced technology now, you’ll be left behind.” |
In 2015, researchers introduced a novel form of CNV called non-exudative, occult choroidal neovascular membranes. As the term implies, these membranes manifest with anomalous flow within the choriocapillaris angiogram but no signs of exudation on SD-OCT or leakage on FA and ICGA.23 Data suggests the presence of these lesions increases the risk of future exudation compared with unaffected eyes.24 Now, more frequent follow-up with OCT and OCT-A is recommended in this subset of patients.24
In AMD, research shows OCT-A metrics provide qualitative and quantitative analysis of choroidal neovascular membranes. Measurements of CNV flow area (area of abnormal vascular activity within the lesion) and flow index can be used to assess treatment efficacy, including response or relapse.25
 |
| OCT-A software analytics allow for quantification of the lesion size, which can be used to monitor a patient over time. The objective measurement correlates to the “flow” within the lesion. Click image to enlarge. |
3. Do you manage glaucoma? There is growing evidence suggesting that vascular dysfunction plays a role in the pathogenesis of glaucoma. By monitoring blood flow within the retina, OCT-A provides a way to assess the health of the ganglion cells that are affected in glaucoma. Vessel density measurements provide a means of measuring vascular function and are highly repeatable and reproducible.
Vessel density assessment of the peripapillary retina and macular region are strong diagnostic indicators and may be negatively impacted in glaucoma.26,27 Glaucoma affects the superficial vascular complex, comprised of the nerve fiber layer (NFL) plexus and the ganglion cell layer (GCL) plexus. Evaluation of the vessel density within the peripapillary NFL and macular GCL is a new and informative way of identifying focal, glaucomatous defects.
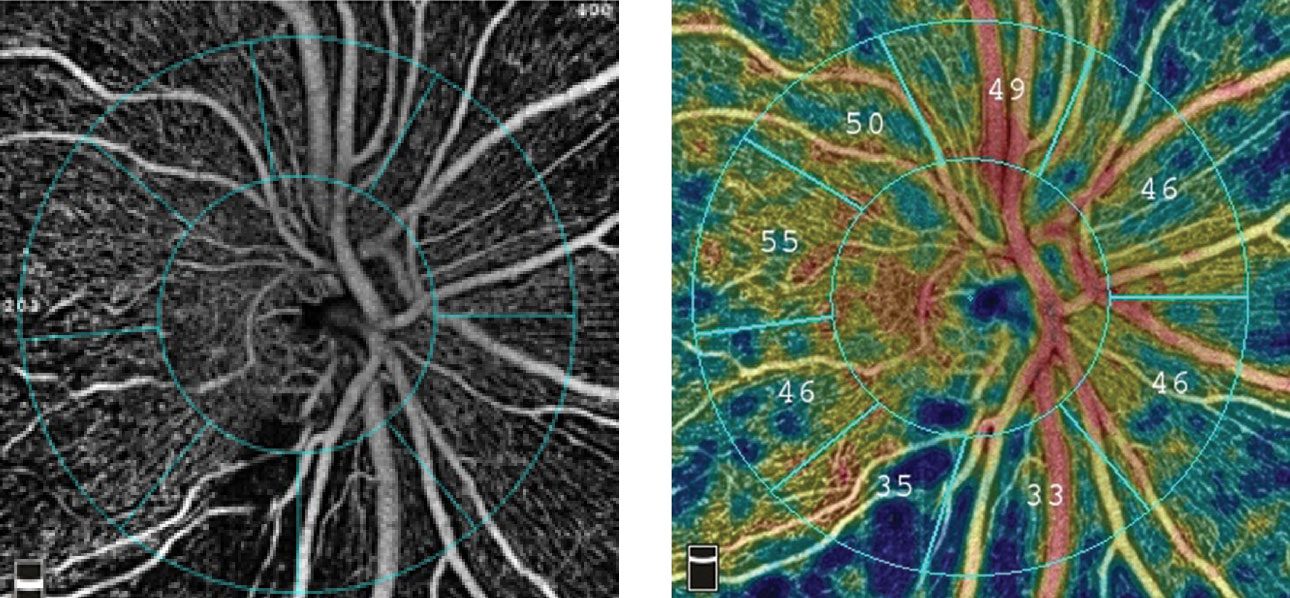 |
| The radial peripapillary capillary angiogram, at left, and vessel density map, at right, show an inferior temporal wedge defect with reduced vessel density in a patient with primary open-angle glaucoma. Images: Optovue. Click image to enlarge. |
Studies show that OCT-A can detect early, pre-perimetric glaucoma better than structural OCT.28,29 In addition, OCT-A parameters correlate better with visual field parameters compared with structural OCT.26,30 Research now shows that retinal vascular changes (specifically a reduction in vessel density) in the peripapillary retina and macula may develop in all stages of glaucoma, not just advanced disease states.
The latest research is focusing on the role of OCT-A perifoveal vessel density in assessing patients with advanced glaucoma. There does not appear to be a detectable measurement floor as is seen in SD-OCT; thus, OCT-A can be used to monitor the stability of patients at all stages of disease, including end-stage.31
Optometry is constantly evolving with new technologies and advanced imaging modalities. OCT-A has proven to be a true game-changer for many practices and can elevate the delivery of care clinicians provide. This technology will only grow in the next decade and will continue to advance optometrists’ role as primary eye care providers.
Dr. Rodman is a professor and chief of the Fort Lauderdale (Broward) Eye Care Institute at Nova Southeastern University in Florida. She is a consultant and speaker for Optovue.
| 1. Virgili G, Menchini F, Casazza G, et al. Optical coherence tomography (OCT) for detection of macular oedema in patients with diabetic retinopathy. Cochrane Database Syst Rev. 2015;1:CD008081. 2. Khadamy J, Aghdam AK, Falavarjani KG. An update on optical coherence tomography angiography in diabetic retinopathy. J Ophthalmic Vis Res. 2018;13(4):487-97. 3. de Carlo TE, Chin AT, Bonini Filho MA, et al. Detection of microvascular changes in eyes of patients with diabetes but not clinical diabetic retinopathy using optical coherence tomography angiography. Retina. 2015;35(11):2364-70. 4. Takase N, Nozaki M, Kato A, et al. Enlargement of foveal avascular zone in diabetic eyes evaluated by en face optical coherence tomography angiography. Retina. 2015;35(11):2377-83. 5. Junki Kwon, Jaewan Choi, Joong Won Shin, et al. An optical coherence tomography angiography study of the relationship between foveal avascular zone size and retinal vessel density. Invest Ophthalmol Vis Sci. 2017;58:1637-45. 6. Freiberg FJ, Pfau M, Wons J, et al. Optical coherence tomography angiography of the foveal avascular zone in diabetic retinopathy. Graef Arch Clin Exp Ophthalmol. 2016;254(6):1051-58. 7. Lee H, Lee M, Chung H, et al. Quantification of retinal vessel tortuosity in diabetic retinopathy using optical coherence tomography angiography. Retina. 2018;38(5):976-85. 8. Gozlan J, Ingrand P, Lichtwitz O, et al. Retinal microvascular alterations related to diabetes assessed by optical coherence tomography angiography: A cross-sectional analysis. Medicine (Baltimore). 2017;96:e6427. 9. Ghasemi Falavarjani K, Iafe NA, Hubschman JP, et al. Optical coherence tomography angiography analysis of the foveal avascular zone and macular vessel density after anti-VEGF therapy in eyes with diabetic macular edema and retinal vein occlusion. Invest Ophthalmol Vis Sci. 2017;58(1):30-34. 10. Toto L, D’Aloisio R, Di Nicola M, et al. Qualitative and quantitative assessment of vascular changes in diabetic macular edema after dexamethasone implant using optical coherence tomography angiography. Int J Mol Sci. 2017;18(6):e1181. 11. Michalska-Małecka K, Heinke Knudsen A. Optical coherence tomography angiography in patients with diabetic retinopathy treated with anti-VEGF intravitreal injections: Case report. Medicine (Baltimore). 2017;96:e8379. 12. Lee J, Moon BG, Cho AR, et al. Optical coherence tomography angiography of DME and its association with anti-VEGF treatment response. Ophthalmology. 2016;123(11):2368-75. 13. Cicinelli MV, Carnevali A, Rabiolo A, et al. Clinical spectrum of macular-foveal capillaries evaluated with optical coherence tomography angiography. Retina. 2017;37(3):436-43. 14. Kiang L, Bailey ST, Jia Y, et al. Optical coherence tomography angiography of non-exudative choroidal neovascularization. Yan Ke Xue Bao (Hong Kong). 2016;31:243-45. 15. Palejwala NV, Jia Y, Gao SS, et al. Detection of nonexudative choroidal neovascularization in age-related macular degeneration with optical coherence tomography angiography. Retina. 2015;35(11):2204-11. 16. de Oliveira Dias JR, Zhang Q, Garcia JMB, et al. Natural history of subclinical neovascularization in non-exudative age-related macular degeneration using swept-source oct angiography. Ophthalmology. 2018;125:255-66. 17. Tey KY, Teo K, Tan ACS, et al. Optical coherence tomography angiography in diabetic retinopathy: A review of current applications. Eye and Vis. 2019;37(6):37. 18. Al-Sheikh M, Akil H, Pfau M, et al. Swept-source oct angiography imaging of the foveal avascular zone and macular capillary network density in diabetic retinopathy. Invest Ophthalmol Vis Sci. 2016;57:3907-13. 19. Carnevali A, Sacconi R, Corbelli E, et al. Optical coherence tomography angiography analysis of retinal vascular plexuses and choriocapillaris in patients with type 1 diabetes without diabetic retinopathy. Acta Diabetol. 2017;54(7):695-702. 20. Nesper PL, Roberts PK, Onishi AC, et al. Quantifying microvascular abnormalities with increasing severity of diabetic retinopathy using optical coherence tomography angiography. Invest Ophthalmol Vis Sci. 2017;58(6):BIO307-BIO315. 21. Samara WA, Shahlaee A, Adam MK, et al. Quantification of diabetic macular ischemia using optical coherence tomography angiography and its relationship with visual acuity. Ophthalmology. 2017;124(2):235-44. 22. Lira RPC, Oliveira CL, Marques RB, et al. Adverse reactions of fluorescein angiography: a prospective study. Arq Bras Oftalmol. 2007;70(4)615-18. 23. Alam M, Zhang Y, Lim JI, et al. Quantitative optical coherence tomography angiography features for objective classification and staging of diabetic retinopathy. Retina. 2020;40(2):322-32. 24. You Q, Freeman WR, Weinreb RN, et al. Reproducibility of vessel density measurement with optical coherence tomography angiography in eyes with and without retinopathy. Retina. 2017;37(8):1475-82. 25. de Carlo TE, Romano A, Waheed NK, et al. A review of optical coherence tomography angiography (OCT-A). Int J Retina Vitr. 2015;1:5. 26. Liu L, Jia Y, Takusagawa HL, et al. Optical coherence tomography angiography of the peripapillary retina in glaucoma. JAMA Ophthalmol. 2015;133(9):1045-52. 27. Takusagawa HL, Liu L, Ma KN, et al. Projection-resolved optical coherence tomography angiography of macular retinal circulation in glaucoma. Ophthalmology. 2017;124(11):1589-99. 28. Akil H, Huang AS, Francis BA, et al. Retinal vessel density from optical coherence tomography angiography to differentiate early glaucoma, pre-perimetric glaucoma and normal eyes. PLoS One. 2017;12:2:e0170476. 29. Yarmohammadi A, Zangwill LM, Manalastas PIC, et al. Peripapillary and macular vessel density in patients with primary open-angle glaucoma and unilateral visual field loss. Ophthalmology. 2018;125(4):578-87. 30. Yarmohammadi A, Zangwill LM, Diniz-Filho A, et al. Relationship between optical coherence tomography angiography vessel density and severity of visual field loss in glaucoma. Ophthalmology. 2016;123(12):2498-2508. 31. Moghimi S, Bowd C, Zangwill L, et al. Measurement floors and dynamic ranges of oct and oct angiography in glaucoma. Ophthalmology. 2019;126(7):980-88. |