 |
When glaucoma patients move in to your area and wish to establish care with you, some will have a long history of closely monitored disease, whereas others will be recently diagnosed and bring with them, essentially, no assurance that they are stable. In either case, it’s imperative that you are prepared to evaluate and manage them. Given that most cases of glaucoma fall in to the mild-to-moderate category, glaucoma is the consummate debilitating disease manageable by optometrists.
Technological advances, particularly those in optic nerve imaging, have played a huge role in expanding our ability to detect disease at earlier stages than previously possible.
But these devices also come with an almost overwhelming amount of data to sift through. Sometimes the data is daunting and doesn’t necessarily ‘fit’ with what we are seeing clinically, clouding the issue. But at the end of the day, no instrument can outrank clinical judgment.
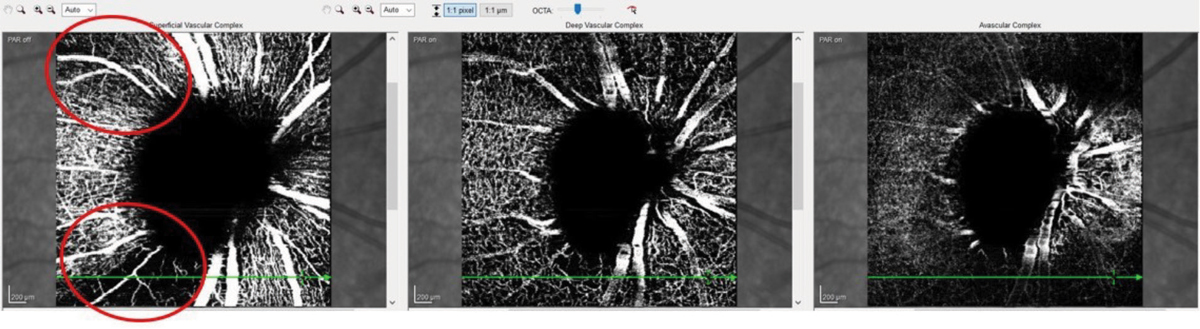 |
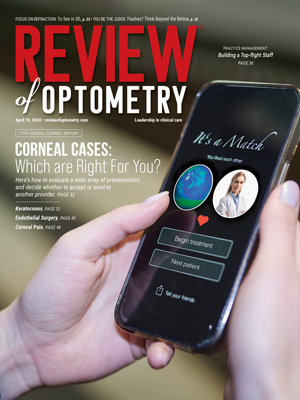
Fig. 1. These OCT-A images show a patient with advanced glaucoma. Note the areas of decreased vascular density (circled in red). They coincide nicely with the superior temporal and inferior temporal RNFL sectors that are preferentially damaged in glaucoma. Click image to enlarge. |
Diagnostic Data
Several technological developments can help us put the pieces of the glaucoma puzzle together. Over the past several years—at the Optometric Glaucoma Society meetings, in particular—world-renowned experts have offered insight into instruments that can help us with day-to-day clinical evaluations. But sometimes, simply looking at the optic nerve in a different way can help complete the picture.
Recently, a new patient presented with a history of glaucoma over nearly two decades. His disease was advanced enough that imaging was not necessary to tell us if he has disease, but it is imperative in telling us if his disease is worsening.
A review of the patient’s records demonstrated visual field defects consistent with the extent of glaucomatous damage in both eyes. OCT imaging was obtained and the processing of the images present a good opportunity to discuss new and upcoming ways that we will be looking at OCT scans in the near future.
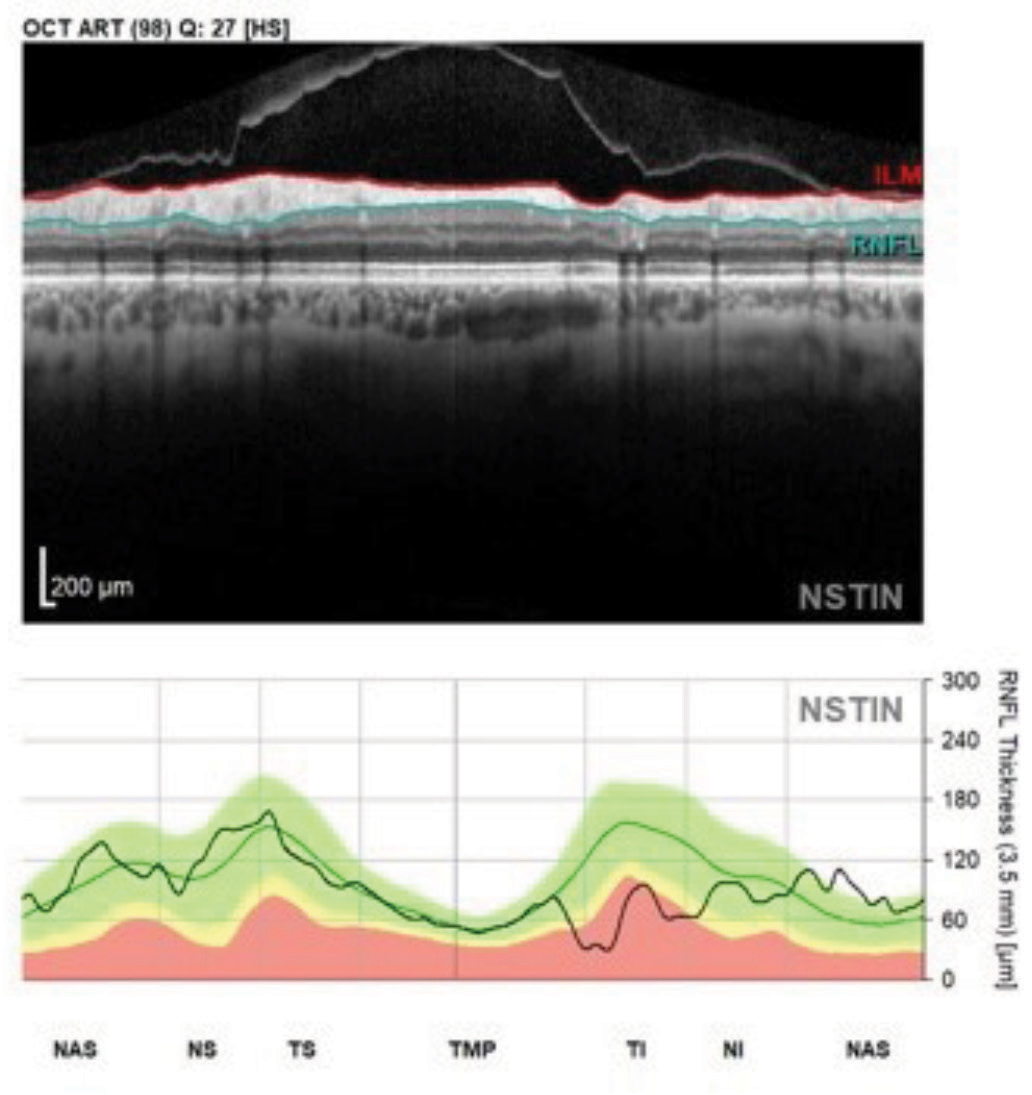 |
Fig. 2. This perioptic RNFL circle B scan image and NSTIN plot shows a patient with glaucomatous structural damage in the inferotemporal sector. Note the contiguity of the entire temporal RNFL scan in this format. Click image to enlarge. |
Tools of the Trade
One of the relatively recent advances in OCT imaging centers around identifying Bruch’s membrane opening (BMO) in the optic disc and using its edge as a landmark to evaluate the thickness of the more medial tissue, the ganglion cells. The concept of minimum rim width (MRW) is a measure of the ganglion cell thickness in the neuroretinal rim of the optic nerve as measured from the BMO to the shortest point of the innermost edge of the ganglion cells. This thickness is termed the BMO-MRW.
OCT angiography (OCT-A) is a relatively new adjunct to OCT that helps us visualize various anatomical layers of retinal and optic nerve vasculature. While this is helpful, researchers are still evaluating what constitutes a normal vascular appearance. Patients with glaucomatous damage will have concurrent ganglion cell and retinal nerve fiber layer (RNFL) aberrations (i.e., loss and reduction of tissue volume), and reduced tissue volume requires less vascular supply to nourish the remaining tissue. But what is not clear is which comes first in the course of the disease: reduced RNFL volume or a reduction in associated vascular supply to the area. The answer simply is unknown—and may potentially be a bit of both. So, while OCT-A is helpful in making sense of the clinical picture, the metrics are not yet specific enough to pinpoint exact diagnostic decisions (Figure 1).
 |
Fig. 3. These RNFL diameter circle scans show the patient’s right eye. Note the stability of the innermost RNFL circle scan of the most recent visit compared with the baseline visit obtained 18 months earlier. Where there is a difference between the scans, the thickness differences overlay major perioptic retinal blood vessels. Click image to enlarge. |
The Order of Operations
In the near future, we’ll be seeing changes in how we visualize the perioptic neuroretinal rim scans. We’ve already moved from one RNFL circle scan to three, each with varying diameters, enabling us to look at the RNFL further away from the optic nerve than previously. But all RNFL circle scans have been predicated upon the order in which the scans were obtained: temporal, superior, nasal, inferior and, finally, back to the temporal sector—this is visualized as the TSNIT graph, which, in a healthy non glaucomatous eye, will have a classic “double hump” appearance, with the humps coinciding with the ST and IT sectors of the perioptic RNFL, which typically are the thickest sectors.
But in reality, starting our RNFL circle scan in the middle of the macular fibers and ending in this same area puts the macular RNFL data at the lateral ends of the TSNIT graph. Since more than half of the ganglion cells originate in the macula early glaucomatous loss can be detected in the macula. With this in mind, instead of plotting the RNFL with the macular fibers on each end of the plot, some research is showing an advantage to starting the scan nasally and making a full, uninterrupted sweep through the temporal and macular fibers (NSTIN) where glaucoma can be detected.1
Note in imaging a familiar look to the NSTIN plotting, but with the added benefit of the superior temporal, the temporal and the inferior temporal RNFL all located adjacent to each other (Figure 2).
Furthermore, research now overlaps the points tested in a 24-2 or a 10-2 visual field to the anatomically matched macular regions.1 This is especially valuable as it allows us to use structural data gathered from OCT scans to help target the type of visual field strategy for individual patients.
Take, for example, this “retina view” map of the RNFL and ganglion cell layer thicknesses as they appear anatomically in a patient’s right eye (Figure 3). In the adjacent “field view,” the anatomical maps are turned upside down (to match the points tested in a visual field exam), over which the testing points of both a 24-2 and 10-2 strategies are superimposed. You can see in the retina views, both ganglion cell somatic loss as well as corresponding RNFL loss. But when overlaying the field testing points in the field view, you can see that only four or five points in the 24-2 testing strategy would indicate a defect, whereas we’d see many more test defective in a 10-2 strategy.
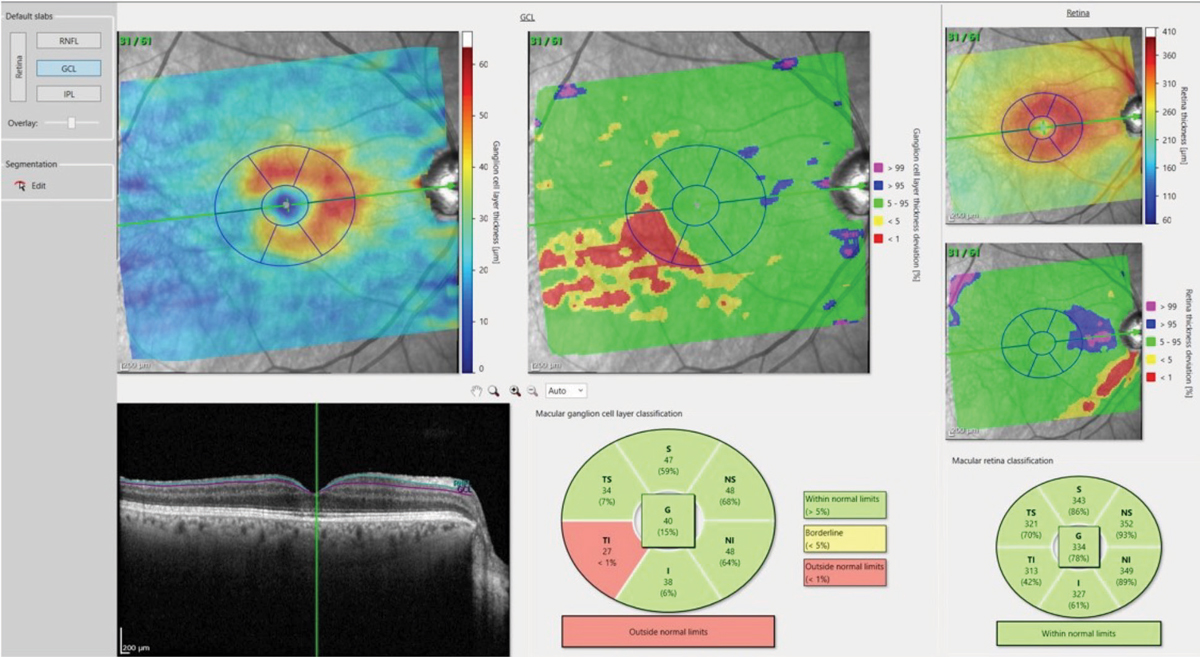 |
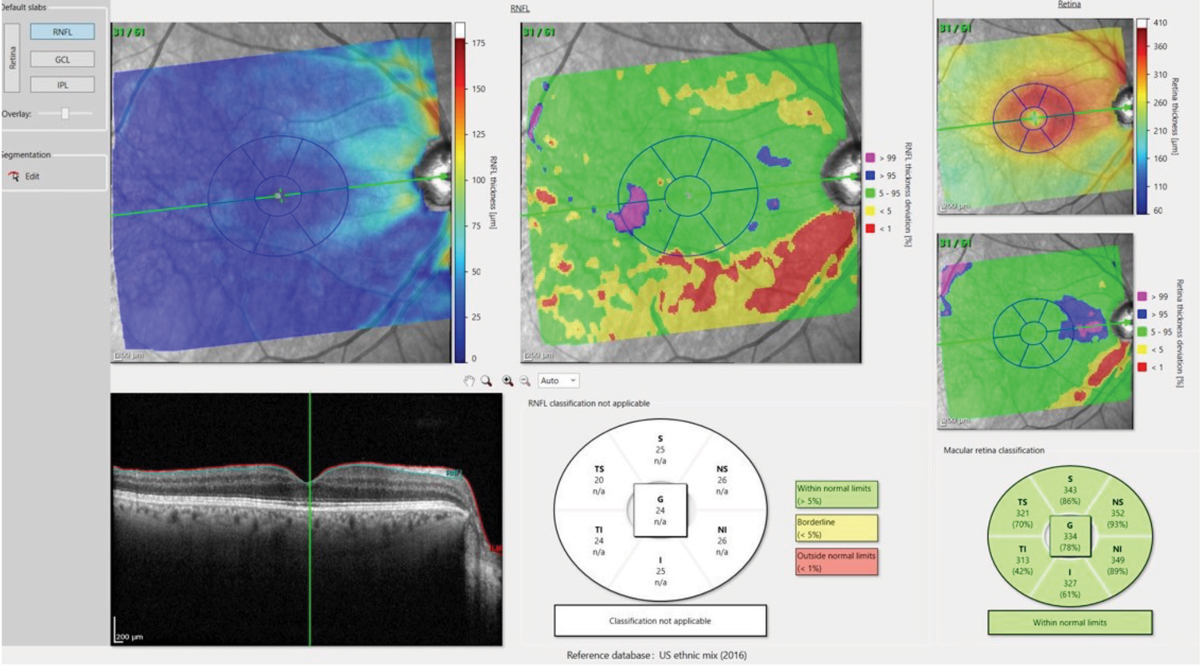
Figs. 4a and 4b. The deviation map in 4a (above) highlights an area in the temporal, inferior macula of loss of ganglion cell bodies, which matches up nicely with figure 4b (below), which shows the comparable damaged RNFL axons in the same eye. Click image to enlarge. |
 |
| Click image to enlarge. |
Deviation Maps
Coinciding with this recent research, the development of deviation maps of ganglion cell thickness and RNFL thickness measures in the macula as compared with a reference database.1 Given the high resolution available with OCT, it makes sense to look specifically at RNFL and ganglion cell layers in the macula when looking at glaucomatous eyes.
While the ganglion cell complex (GCC) has been commonly referenced in discussion of glaucoma pathogenesis, the ability to look solely at the ganglion cell layer becomes incredibly important in detecting early disease. The ganglion cell layer consists of the cell bodies of the ganglion cells, and the RNFL consists of the axons of these same cells. By visualizing these layers and comparing them with a reference database, optometrists can easily appreciate deviation from the norm (Figure 4).
Glaucoma remains a puzzle, and the pieces don’t always fit together. But with the energy behind new ideas and techniques, optometry is getting to the point where the technology is going to be facilitate fitting those pieces together. With the right marriage of our individual clinical expertise, our collective research and advanced technologies, our ability to care for glaucoma patients will ultimately be more precise.
| 1. Hood D. Improving our understanding, and detection, of glaucomatous damage: An approach based upon optical coherence tomography (OCT). Prog Retin Eye Res. 2017;57(3):46–75. |