 |
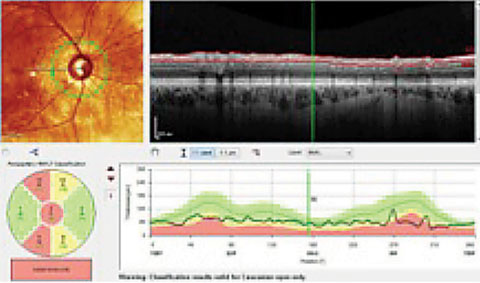
| Both the Garway-Heath sectors, lower left, and the TSNIT graph, lower right, show an RNFL that is considered, statistically, outside of normal limits (in red), compared with the reference database. Clinicians must compare these findings with actual anatomical changes. In this case, these areas do, in fact, show damage. |
Here, we discuss the ramifications of red disease and overtreatment for patients with glaucoma.
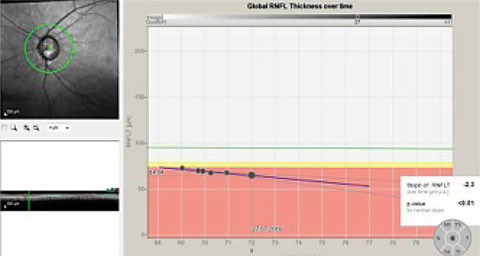 |
| This series of RNFL scans over a three-year period demonstrates progressive RNFL thinning. The downward slope of the global optic nerve trend, on the right, indicates progressive loss of tissue, indicative of worsening disease. |
Know Your Tools
As with any technology, users must first understand two primary principles: what the technology does and, just as importantly, what the technology means—is the test reliable, does is correlate with the clinical findings, is it repeatable? For example, pre-perimetric glaucoma implies you have compelling evidence of optic nerve damage consistent with glaucomatous damage, yet there are no discernible visual field defects. Although it’s generally accepted that 40% or more of ganglion cells need to be damaged before a visual field defect is noted, this generalization was based on evaluating a glaucoma suspect with standard automated white-on-white perimetry (SAP WOW).5,6 Today, selective perimetry, targeting M-type ganglion cells, seems to be able to detect visual field abnormalities earlier than SAP WOW. So when it comes to SAP strategies, pre-perimetric glaucoma does exists. But perhaps we should be using selective perimetry in these cases instead. The point is to know what your technology does and doesn’t do.The same thing can be said for optic nerve imaging technologies, with a whole host of variances across instrument manufacturers. Each instrument’s resolution, repeatability, image registration, post-image acquisition data processing and reference database all play into that technology’s ability to provide accurate diagnostic data.
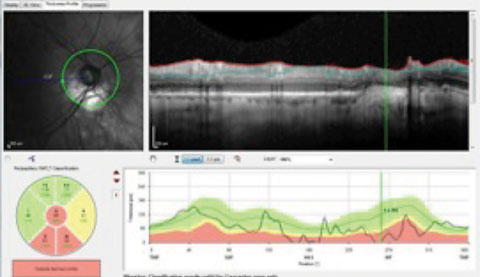 |
| The presence of peripapillary atrophy is confounding the RNFL circle scan of a patient with advanced glaucomatous disease. The questionable change to the RNFL inferiorly in the area of greatest peripapillary atrophy suggests the patient progressed, further evidenced in the TSNIT indicated by the vertical line. |
The Good and the Bad of OCT
The development of optic nerve and nerve fiber layer scanning devices has changed how glaucoma is diagnosed and monitored. OCTs supplement clinical optic nerve assessment with reproducible, quantitative measurements of the optic nerve head (ONH), retinal nerve fiber layer (RNFL) and macula.2 But this new-found information comes with its own set of technology-related concerns, as research suggests OCTs have a false positive rate of 15% to 36%.7As with visual fields, an OCT reading provides a large amount of information and, while each parameter may provide valuable information, improper interpretation increases the chance of getting a false positive or false negative and drawing a wrong conclusion. For example, with OCT scanning, RNFL is the most specific parameter, with sensitivity equal to, or better than, ganglion cell and ONH analysis; yet clinicians must understand how it plays into the whole clinical picture to avoid misinterpreting the reading. One study found the overall incidence of false positives for the Cirrus (Zeiss) RNFL clock-hour map, quadrant map or deviation map at a <5% level was 39%, and the incidence of false positives for Spectralis (Heidelberg Engineering) RNFL sector or quadrant analysis was 18%.7
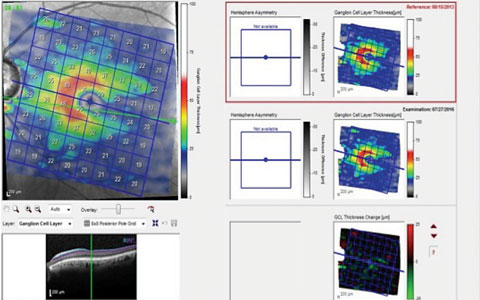 |
| This scan of the GCL in a patient with advanced disease indicates ganglion cell loss in the inferior temporal region, which results in a superior arcuate defect with a nasal step, as seen on the left. The two scans on the right are of the same area separated by a three-year period. The change analysis, lower right, shows a slight decrease in GCL thickness, occurring along the horizontal raphe both superiorly and inferiorly. |
Beware the Database
Each OCT device is accompanied by a normative database associated with several parameters such as the RNFL scan (the TSNIT graph) and the macula thickness scans. At times, the database may be misleading or even inappropriate. Current OCT reference databases (RDBs) have 95% to 99% specificity cut-offs; however, they are dependent on the inclusion/exclusion criteria of the study protocol and have been carefully assessed by technicians, investigators and reading centers.6 RDBs also do not include comorbidities and are within certain myopic constraints. But these RDBs are nothing more than statistical ranges for the index being analyzed.8Tall Tales in Tonometry |
| Measuring intraocular pressure (IOP) has generated some controversy in recent years, in part because advances in diagnostic technology allow us to better account for central corneal thickness (CCT) and rigidity when analyzing a patient’s IOP. Thicker corneas tend to give higher readings on applanation tonometry, causing undue concern if a cornea is thicker than average and IOP readings are high.1 Conversely, in the presence of thinner corneas, applanation tensions generally under-report actual IOP. Some practitioners insist on “correcting” the IOP based on corneal thickness. However, correcting IOP using CCT measurements is fraught with dangers and can lead to a false positive or false negative reading. First, no one nomogram has been found to be accurate, and most of the well-known studies (AGIS, OHTS, EMGT, etc.) did not use a nomogram to convert IOP reading based on CCT. Second, converting IOPs based on CCT becomes a moot point when considering the therapeutic effect of treatment—target IOP—rarely changes significantly after correcting the reading using CCT. For example, assuming a desired reduction in IOP of 20%, an untreated applanation pressure of 30mm Hg has a target IOP of 24mm Hg, while its converted IOP readings of 28mm Hg has a target of just 23mm Hg. 1. Bhan A, Browning AC, Shah S, et al. Effect of corneal thickness on intraocular pressure measurements with the pneumotonometer, Goldmann applanation tonometer, and Tono-Pen. Invest Ophthalmol Vis Sci. 2002;43:1389-92. |
With glaucoma, clinicians must answer two questions for all patients:
(1) Is there a condition that needs to be treated or monitored? (Asked only during the initial work up.)
(2) Is the patient stable? (Asked at every follow-up visit and is independent of the answer to #1.)
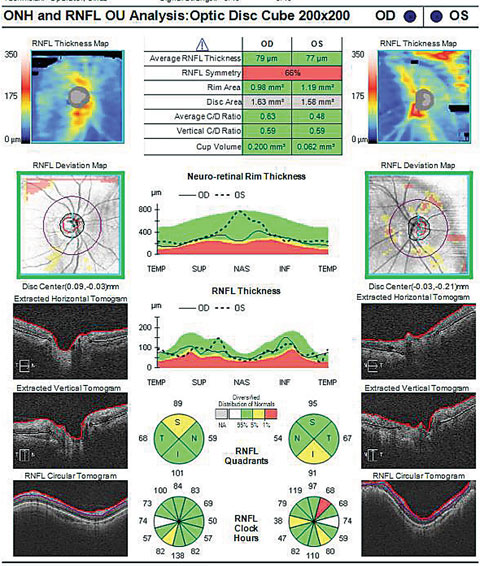 |
| Does the cup-to-disc ratio in the OCT above match the photo below? In fact, the OCT overestimates the clinical c/d ratio. Click image to enlarge. Image: Dan Carver, OD |
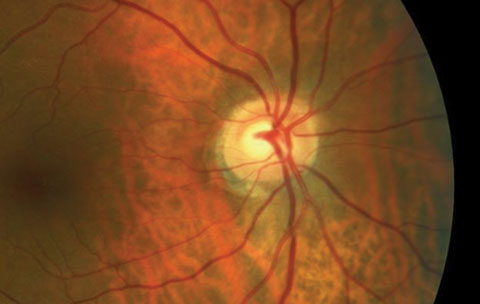 |
| Click image to enlarge. Image: Dan Carver, OD |
In the initial work-up, clinicians need to know whether or not the patient’s optic nerve characteristics fall within a like database of individuals without glaucoma. Although the RDB does not determine the presence or absence of disease, it does gives us a feel for where our patient falls in the normal bell curve distribution of data points of the index we are studying. Whether or not the patient is within the normal range, the initial visit concludes with a decision to either actively manage or passively observe. During all subsequent visits, clinicians must determine if there is change to the structure or function over time, and the RDBs have no relevance—the patient becomes their own reference.
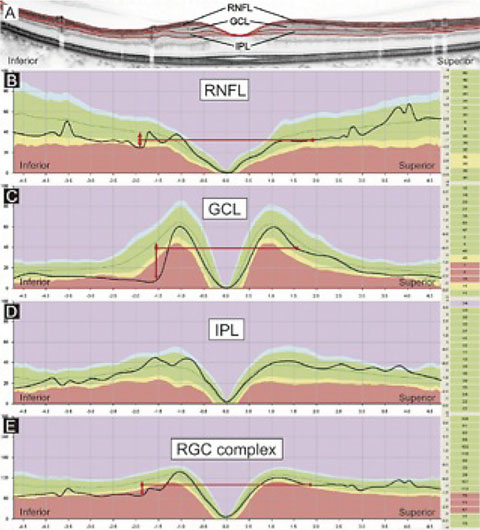 |
| This image represents several indices that may be examined in an OCT printout—RNFL, GCL, IPL and the RGC complex (GCC)—compared with a relative database. The image suggests that the most discernable variation from the RDB may be seen in GCL scans and least discernable in the IPL scans. Knowing your instrument is critical in interpreting this data. Does your OCT scanner image only the GCL, or does it image the GCL+IPL (GCC)? Interpreting data obtained by two different technologies (as in the case where a patient changes providers) can be exceedingly difficult. Click image to enlarge. |
Documenting Progression
As glaucoma involves the progressive loss of retinal nerve fibers and optic rim tissue, repeat measurements are key to identifying and managing change over time. The most common pattern of developing retinal nerve fiber defects is widening of the defect.9Evaluation of the cup-to-disc (c/d) ratio has been a mainstay in the consideration of glaucoma progression. While human examiners are subject to variability, our instrumentation cannot be considered flawless, either. Modern scanning instruments measure linear cup size and volume with apparent precision that may not agree with the clinical exam. Scleral crescents and peripapillary atrophy, for example, can cause the margin of the disc to appear ill defined, both to the examiner and to the scanning instrument. This tends to cause a larger than usual disc measurement and can subjectively affect the c/d ratio. A tilted disc, resulting from an oblique insertion of the optic nerve, could alter a scan due to parallax. Ideally, the optic nerve should be measured 90 degrees to the direction of the scan. Clinicians must be comfortable with their imaging instrument to ensure proper interpretation of its data.
Visual Fields: Facts and Fiction |
| While instrumentation errors are not common with visual fields (VFs), practitioners should still be wary of red disease when using them, especially if patient errors and fixation losses mimic defects in the visual field. VFs are dependent on the patient’s ability to navigate through the test, and though the testing strategies are controlled, patient responses to VF testing are quite variable. It’s extremely important to evaluate the error indices such as false positives, false negatives and fixation losses. Further, anatomical variations such as scotomas from a large nose, heavy eyebrows or droopy eyelids can influence the validity of the test. The practitioner must always consider glaucoma’s pathology, as the field defect must make sense with the physical examination of the optic nerve. For example, the nasal step VF defect must honor the horizontal midline, based on nerve fiber layer anatomy. Less structured defects would be more suspicious as artifacts, and should prompt practitioners to repeat the test. Even when using the correct testing strategy (selective vs. SAP), field interpretation can be clouded by confounding issues such as other disease states, a lack of defects when you expect them or a confusing defect. In most situations, clinicians should repeat the VF testing when initial results don’t correspond to the clinical picture. In the OHTS design, VFs were repeated three times in the presence of defects before the defect was considered real.1 1. Keltner JL, Johnson CA, Levine RA, et al. Normal visual field tests following glaucomatous visual field endpoints in the Ocular Hypertension Treatment Study (OHTS). Arch Ophthalmol. 2005;123(9):1201-6. |
Additionally, the early warning of the ganglion cell loss may lead to treatment of individuals whose lifespan will not outlast the development of the disease. Although this new diagnostic criteria shows promise, we are not at a point where consideration of the ganglion cell complex should be the sole indicator in glaucoma treatment, especially in the context of concurrent macular disease, such as macular degeneration.
Glaucoma is a progressive disease that is easy to misrepresent if we rely too heavily on single instrument measurements and fail to consider imperfections in serial results. Diagnosis and treatment remain quite subjective in many cases, and the consideration of false positive and false negative results is critical to avoid over-treating. To avoid the trap of red disease, clinicians should always consider the spectrum of signs and symptoms, with emphasis on treating the individual patient and not the technologic finding.
Dr. Potter is chief of Optometry and Contact Lens Services at Millennium Eye Care in West Freehold, NJ.
Dr. Fanelli is in private practice in Wilmington, NC, writes Review of Optometry’s “Glaucoma Grand Rounds” column and lectures on glaucoma and other clinical topics.
| 1. Lockwood AJ, Kirwan JF, Ashleigh Z. Optometrists referrals for glaucoma assessment: a prospective survey of clinical data and outcomes. Eye. 2010;24:1515-9. 2. Calvo-Romero JM, Lima-Rodriguez EM. Bradycardia associated with ophthalmic beta blockers. J Postgrad Med. 2003 Apr-Jun;49(2):186. 3. Leung E, Medeiros FA, Weinreb RN. Prevalence of ocular surface disease in glaucoma patients. J Glaucoma. 2008;17(5):350-5. 4. Kanthan GL, Wang JJ, Rochtchina E, et al. Use of antihypertensive medications and topical beta-blockers and the long-term incidence of cataract and cataract surgery. Br J Ophthalmol. 2009;93:1210-4. 5. Quigley HA, Addicks EM, Green WR. Optic nerve damage in human glaucoma. III Quantitative correlation of nerve fibre loss and visual field defect in glaucoma, ischaemic neuropathy, papilledema and toxic neuropathy. Arch Ophthalmol. 1982;100:135-46. 6. Kerrigan-Baumrind LA, Quigley HA, Pease ME, et al. Number of ganglion cells in glaucoma eyes compared with threshold visual field tests in the same persons. Invest Ophthalmol Vis Sci. 2000;41:741-8. 7. Leal-Fonseca M, Rebolleda G, Oblanca N, et al. A Comparison of false positives in retinal nerve fiber layer, optic nerve head and macular ganglion cell-inner plexiform layer from two spectral-domain optical coherence tomography devices. Invest Ophthalmol Vis Sci. 2016;57(10):4194-204. 8. Mazzarrella J, Cole J. The anatomy of an OCT scan. Rev Optom. 2015;152(9):58-68. 9. Cymbor M. Guidelines on glaucoma progression. Rev Optom. 2015;152(9):78-85. 10. Tan O, Chopra V, Lu AT, et al. Detection of macular ganglion cell loss in glaucoma by Fourier domain optical coherence tomography. Ophthalmology. 2009 Dec;116(12):2305-14. 11. Hwang H, Kim MK, Kim DW. Segmentation errors in macular ganglion cell analysis as determined by optical coherence tomography. Ophthalmology. 2016 May;123(5):950-8. 12. Hwang H, Kim MK, Kim DW. Segmentation errors in macular ganglion cell analysis as determined by optical coherence tomography. Ophthalmology. 2016;123(5):950-8. 13. Nakano N, Hangai M, Nakanishi H, et al. Macular ganglion cell layer imaging in preperimetric glaucoma with speckle noise-reduced spectral domain optical coherence tomography. Ophthalmology. 2011 Dec;118(12):2414-26. |