 |
In June 2017, a patient made his way back to our office after several years of absence, during which he had moved and sought care from another provider. When he presented back to me, I reviewed the old records and found that there were some early cataracts seen at the last visit, as well as a notation about him being a glaucoma suspect, based on disc asymmetry. His current medications included atorvastatin, doxazosin, finasteride and lisinopril. He reported no known allergies to medications.
Examination
At the most recent visit, entering visual acuities were 20/50- OD and 20/40- OS uncorrected. Best-corrected vision was 20/25+ OD, OS and OU through hyperopic astigmatic correction. Pupils were equal, round, responsive to light and accommodation and showed no afferent pupillary defect.
A slit lamp examination of his anterior segments was unremarkable except for corneal arcus OU. Applanation tensions at 9:10am were 12mm Hg OD and 12mm Hg OS. IOP readings were similar to previous visits, with an overall average IOP of 14mm Hg OD and OS, with max IOP readings of 18mm Hg and low readings of 10mm Hg. Van Herick angle estimations demonstrated open angles. Pachymetry readings were 557µm OD and 565µm OS.
Through dilated pupils, his crystalline lenses were characterized by mild nuclear and both anterior and posterior cortical cataracts, slightly worse in the left eye than in the right, but consistent with his best-corrected visual acuities. He had bilateral PVDs that had been noted years earlier. His cup-to-disc ratios at this visit were estimated at 0.45 x 0.45 OD and 0.3 x 0.3 OS. Previously, they were 0.3 x 0.3 OD and 0.25 x 0.25 OS. Was there inherent change over time, or is this an example of intraobserver variance? It was hard to tell at first, so we ordered imaging of the optic nerves to compare with the patient’s previous images.
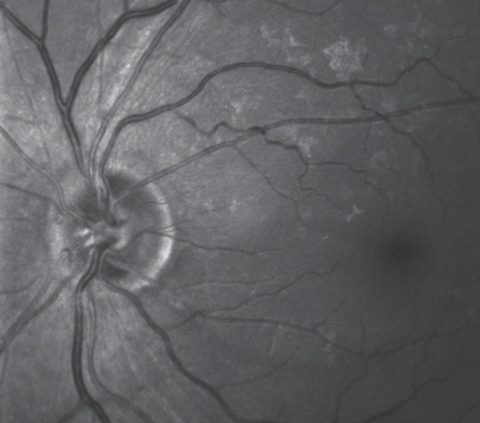 |
| This multi-modal image highlighting the retinal ganglion cells shows a wedge defect extending from the optic nerve between the four and five o’clock positions. |
Imaging
Both maculae were characterized by fine drusen centrally, in the right eye slightly more than in the left, with an epiretinal membrane (ERM) noted temporally in the left eye. The retinal vasculature was characterized by moderate arteriosclerotic retinopathy symmetric bilaterally. Posterior vitreous separations were present in both eyes. His peripheral retinal evaluations were entirely normal in both eyes.
Heidelberg retinal tomography (HRT 3), optic nerve optical coherence tomography (OCT) and multicolor disc images were obtained from both eyes. The HRT 3 imaging demonstrated no substantive change in the neuroretinal rims in either eye as compared with the baseline images from 2010. Given that, I made the assumption that the apparent change in the cup-to-disc ratio was attributed to intraobserver variance.
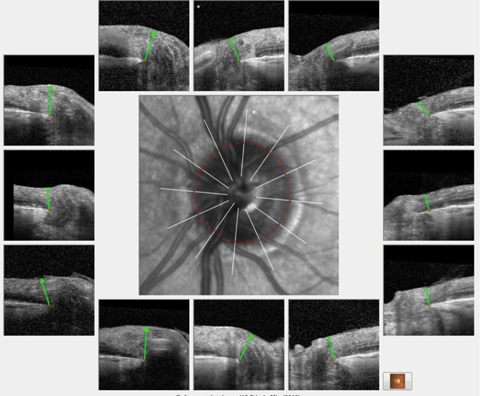 |
| Analysis of the BMO profile of the left eye demonstrated a robust ganglion cell thickness throughout the entire left optic nerve similar in appearance to these HRT 3 scans of the same eye. Click image to enlarge. |
Multimodal optic disc and macular imaging demonstrated findings consistent with the fundus views; namely, fine drusen in both eyes and an ERM in the left. Interestingly, we noticed a nerve fiber layer wedge defect in the left eye extending from the optic nerve between four and five o’clock to the temporal macular area.
OCT images of both optic nerves, using software highlighting Bruch’s membrane opening (BMO), were obtained, as well as macular scans. Analysis of the BMO profile of the left eye demonstrated a robust ganglion cell thickness throughout the entire left optic nerve similar in appearance to the HRT 3 scans of the same eye.
In regards to his macular scans and, in particular, looking for comparative thinning in the macular region that corresponds to the wedge defect seen on the multimodal images, we need to keep in mind the ERM in the left eye. While glaucomatous disease can be seen in macular scans, confounding macular diseases such as age-related macular degeneration and ERMs can complicate the interpretation of such scans. As such, while ERMs can result in increased focal retinal thickness and, subsequently, hide retinal thinning, due to glaucomatous disease, examination of the ganglion cell layer thickness alone will not be affected by an ERM. Thus, ODs must look at the macular scans specifically from the perspective of the ganglion cell layer maps.
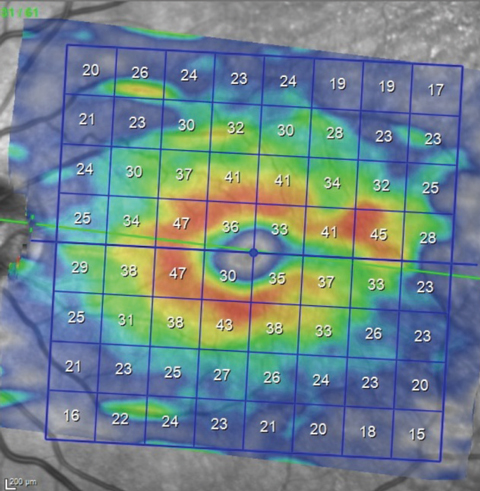 |
| Analysis of the macular region for earliest glaucomatous defects must concentrate on the ganglion cell layer. This image shows a thinning of the ganglion cell layer in the same sector as the wedge defect seen in the multimodal image. |
Discussion
When the patient was initially seen in 2010, imaging technologies at that time concentrated on the neuroretinal rim and the perioptic retinal nerve fiber layer. While macular OCT technology existed then, its use was primarily for macular disease. Given that approximately 50% of the ganglion cells in an optic nerve originate in the macula, it makes intuitive sense to look at macular ganglion cell scans to see if the findings there match up anatomically with what you are seeing clinically.
Since the original scans of this particular patient did not include macular scans, we had no reference point upon which to base any comparison of the current macular scan. As you can see in the macular ganglion cell layer thickness scan on page 88, there is thinning in the area of the RNFL wedge defect seen in the multicolor image extending to the horizontal raphe. Anatomically, that matches with a glaucomatous defect. But, in reality, this defect may very well have been present in 2010; it just wasn’t imaged.
So how is a doctor to sift through this data? While there is correlation between the ganglion cell maps and the RNFL wedge defect, we don’t know if this is a new finding or not. Put another way, we don’t know if this has changed over time. And therein lies the caveat: if this is glaucoma, there will be change over time. All other indices were stable (HRT 3 imaging, stereo nerve photography and visual fields), though we now do see a wedge defect and corresponding thinning in the same ganglion cell region.
The patient is 82 and he still has a robust neuroretinal rim. I felt it prudent to take a wait-and-see approach. There was no immediate need to begin therapy to lower IOP at this time. However, that may change as time passes and more test results are obtained. Will that wedge defect worsen? Will that ganglion cell sectoral thickness decrease? Only time will tell. Would I be surprised if we do see change over time? Not really. But if I do, and it is consistent, then I will begin medical therapy. But for the time being, slow and steady—and monitoring for change over time—is the course.