Glaucoma is a chronic, progressive disease of retinal ganglion cells that results in characteristic structural changes to the optic nerve and retinal nerve fiber layer (RNFL), as well as corresponding visual field loss. Glaucoma affects nearly three million people in the United States today, with numbers likely to reach more than six million by 2050.1 While the rate of blindness from glaucoma in the United States has decreased significantly in the past 20 years—likely due to improved diagnostic and treatment modalities—glaucoma remains a common cause of permanent blindness and disability.2 Early detection is key to slowing progression, and clinicians have many tools at their fingertips to help them with this.
This article highlights how eye care practitioners can use optical coherence tomography (OCT) to detect structural progression in glaucoma.
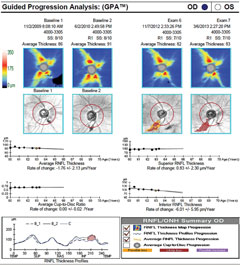 |
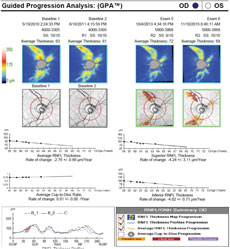
| Case one is a 66-year-old glaucoma patient. The RNFL thickness map shows a decrease in thickness inferiorly (loss of reds and yellows), which is also identified in the deviation map, with the development of a clear wedge RNFL defect over several years (event analysis). Average and inferior RNFL thickness trend analyses show significant negative trends over time. The RNFL thickness profile (TSNIT) also shows confirmed inferior progression. Click image to enlarge. |
Glaucoma Progression
Detecting progressive changes in glaucoma is an important, yet difficult, aspect of disease management. Progression detection is challenging for a variety of reasons, including: the slow but variable rate of progression among patients; the inherent variability of testing such as visual fields and OCT; the lack of agreement between test results; and the lack of consensus on what defines progression. Most glaucoma patients exhibit slow progression of structure and function over many years. However, a subset of glaucoma patients will show rapid progression and are at risk of significant visual disability or blindness.
To reduce the likelihood of visual disability, once clinicians have made the diagnosis of glaucoma and have initiated treatment, they should focus primarily on whether the disease is stable or whether there are progressive changes that require an increase in therapy.
Risk Factors For Progression
Just as risk factor assessment is important in the diagnosis of glaucoma, it can also be used to identify glaucoma patients with the highest risk of progression. Research has identified a number of risk factors for progression, including higher intraocular pressure, pseudoexfoliation, older age, lower ocular perfusion pressure, advanced disease at time of presentation and the presence of an optic disc hemorrhage.3 Patients with significant risk factors for progression should be followed more closely to ensure the treatment plan is sufficient.
Tools For Detecting Progression
According to the World Glaucoma Association’s Progression of Glaucoma consensus publication, both functional and structural testing should be conducted throughout the course of the disease.3 While visual fields and optic disc photography have been considered the gold standard for detecting progression, no one particular test is perfect for detecting progression. Furthermore, there is not always agreement among tests or those interpreting the tests. Although structural changes are thought to precede and even predict functional changes, that is not always the case.
Clinicians have used automated perimetry for decades to detect functional progression in glaucoma patients. Despite the subjective nature of the testing and the importance of patient attention and cognitive abilities, it remains a critical component of glaucoma testing. Because structural changes often occur before functional deficits, structural assessment is important even when visual function is normal. Structural progression can be detected using a variety of tools, including optic disc and RNFL photography and OCT.
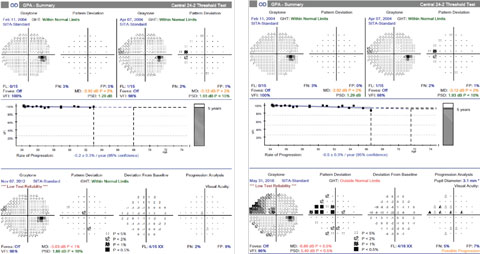 |
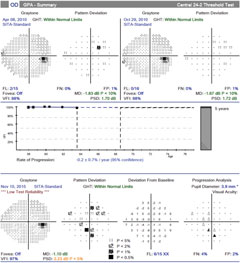
| For case one, at the time that progression of the inferior RNFL loss was confirmed, the most recent visual field, left, showed no progression. However, over the next three years, she developed a corresponding superior visual field defect, right. Click image to enlarge. |
Optic disc and fundus photography remains an important tool in the diagnosis and management of glaucoma. Changes in neuroretinal rim appearance—such as focal or diffuse neural rim thinning, enlargement of the optic cup, changes in peripapillary atrophy and disc hemorrhage development—can be detected through serial optic nerve photography. These changes are often very subtle and require careful evaluation of sequential photographs; comparison of C/D ratio, written descriptions of the optic nerve, or even drawings are not sensitive enough to detect subtle changes. In eyes with sufficient pigmentation, serial photography can help identify RNFL defects and progressive changes, which are also difficult to appreciate.
Beyond these tried-and-true tools, OCT has gained wide acceptance in clinical practice since its introduction in the early 1990s. Today’s spectral domain (SD-OCT) instruments provide high resolution and highly repeatable images that can be used in the diagnosis of glaucoma and detection of structural progression. Historically, clinicians have used optic nerve and RNFL parameters to diagnose and follow glaucoma patients. OCT can measure optic disc parameters such as disc and rim area, cup-to-disc ratio (average and vertical), minimum rim width and cup volume. RNFL measurements include average thickness and thickness subdivided by quadrant.
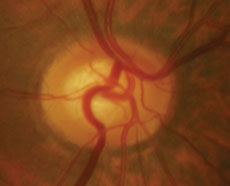 | 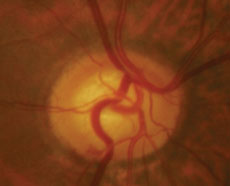 |
| Case two is a 66-year-old patient with normal tension glaucoma. Serial optic nerve photographs of the right eye demonstrate a disc hemorrhage inferiorly with corresponding thinning of the neuroretinal rim, along with more subtle thinning of the superior rim indicated by a change in the course of the blood vessel at 11:00. | |
More recently, macular imaging with OCT has emerged as an important parameter in the diagnosis of glaucoma. Currently, several commercially available OCT instruments have a glaucoma protocol that involves macular imaging. These instruments vary in the way they analyze the macula (various inner retina segmentation algorithms versus full thickness symmetry analysis). There are several advantages to using macular scans compared to optic nerve and RNFL parameters. At a fundamental level, glaucoma is a disease of retinal ganglion cells. Since the macula contains more than 50% of the ganglion cells of the entire retina, a macular scan will sample the majority of retinal ganglion cells. In addition, while the optic disc and peripapillary region have highly variable structural characteristics among normal and glaucoma patients, there is much less variability in the macular region.4,5
 |
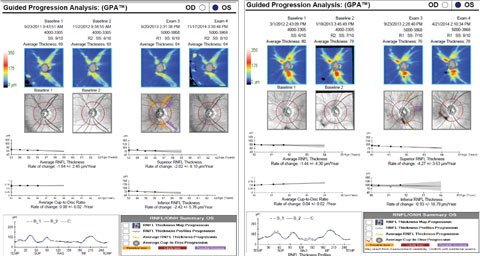
| Case two’s RNFL thickness map shows loss of superior and inferior RNFL over five years. Average, superior and inferior RNFL show a significant rate of decline. Both superior and inferior RNFL show loss on the TSNIT curve, although statistical significance is only noted superiorly. Click image to enlarge. |
Research shows macular OCT scans have a similar ability to detect glaucoma as average RNFL thickness scans. Detecting and following glaucoma progression using macular thickness is the newest area of interest, and the research is still emerging. It is important to remember that using macular OCT testing in glaucoma diagnosis and progression detection is limited to patients without concomitant macular disease such as age-related macular degeneration, epiretinal membranes and macular edema.
Substantial structural damage may occur before a visual field defect; researchers estimate that OCT could detect glaucomatous changes as early as eight years before a visual field defect develops in glaucoma suspects.6 Other studies show that OCT changes are correlated with and can predict the development of visual field progression in glaucoma. One study found that glaucoma patients with progressive RNFL thinning had a higher risk of visual field progression compared with those without progressive thinning.7
OCT Progression Software
Glaucoma progression software incorporates statistical analysis of sequential OCT scans to detect progressive changes. While different instruments analyze and present the data differently, there are two basic types of analysis: event analysis (EA) and trend analysis (TA).
EA compares a single follow-up test to baseline test(s). Progression is detected when the difference between baseline and a subsequent exam exceeds a predetermined threshold, based primarily on test-retest variability. In simple terms, EA answers the question, “Has there been a change from baseline?” For most instruments, the first time a significant difference from baseline is seen, the change is indicated in yellow, which is considered possible progression. If the same change is maintained on consecutive scans, it is indicated in red. For accurate progression analysis, it is critical that the images be aligned for serial evaluation; newer instruments employ eye tracking and other registration strategies to ensure the same areas are compared with each scan. An advantage of EA is that it does not require a large number of tests for analysis; however, it is more susceptible to artifact than TA.
TA performs regression analysis between a particular parameter and time, giving a slope that indicates the rate of change. In simple terms, TA answers the question “How quickly is this patient changing?” TA may be performed with optic disc parameters such as rim area or cup-to-disc ratio, or with RNFL parameters such as average thickness, superior thickness and inferior thickness. Progression is noted when the slope (rate of change) reaches statistical significance. Like with EA, the first exam with a significant slope is typically indicated in yellow; if the slope remains significant with repeat testing, it is indicated in red. Confidence intervals are provided, with tighter confidence intervals indicating a more reliable slope. TA is less susceptible to sudden change and artifact, and the slope is more reliable as the number of follow-up scans increases. Disadvantages of TA include the large number of tests necessary to create a reliable slope and the fact that it may be relatively insensitive to small, focal changes. Recently, in both a simulated progression model and in a study of glaucoma patients, TA performed better than EA in detecting progression.7,8
Challenges
Clinicians are well aware of the difficulties of interpreting subjective testing such as perimetry, and the objective nature of OCT testing is appealing. Although the test itself is objective, interpretation is subjective and influenced by practitioner experience. In addition, there are limitations and caveats to OCT interpretation, such as: measurement variability, age-related (non-disease related) changes, other ocular diseases, signal-to-noise ratio, instrument/image artifacts and the stage of the disease.
 |
| Over the same period of time with case two, there is no confirmed visual field progression, although numerous points tested have changed from baseline (clinician observation indicated good fixation throughout the test). Click image to enlarge. |
Measurement variability. The clinician must discriminate between instrument measurement variability, normal age-related changes and true disease-related changes. Measurement reproducibility with SD-OCT is excellent, as the test-retest variability for an average RNFL measurement is approximately 3.5µm to 5µm.9 However, when evaluating quadrants, sectors or clock hours, the variability increases as much as twofold. Fortunately, the latest instruments have faster scanning, improved image registration and technology such as eye tracking that have reduced the impact of test-retest variability.
Age-related changes. Keep in mind that every change seen in an OCT scan is not necessarily a disease-related change. Multiple studies have demonstrated age-related thinning of both RNFL and macula.10-13 Cross-sectional studies suggest an age-related decrease in average RNFL of about 0.2µm to 0.33µm per year.10 Longitudinal studies demonstrate a slightly larger decrease of approximately 0.52µm per year, and suggest that the magnitude of the natural decline varies as a function of baseline RNFL thickness, with patients with higher baseline RNFL thickness showing significantly larger changes over time.10 Studies have also reported age-related changes in macular thickness of about -0.25µm per year.11
Rates of change have been studied in glaucoma suspects as well as non-progressive and progressive glaucoma patients. In a group of glaucoma suspects followed for an average of 2.2 years, one study found that the rate of global RNFL thickness loss was more than twice as fast (-2.02µm/year vs. -0.82µm/year) in subjects who developed visual field loss compared with those who did not develop field loss.12 Even the glaucoma suspects who did not develop a visual field defect had a rate of RNFL change that exceeded the expected age-related change, although the follow-up in this study was relatively short.12 Other studies show the rate of RNFL change in progressive glaucoma is nearly twice as fast as non-progressive glaucoma (-2.12µm/year vs. -1.18µm/year).13
Other diseases. The impact of concomitant macular disease renders macular OCT scans ineffective in glaucoma. Other conditions may impact the optic nerve and RNFL measurements, as well. While it is not surprising that the presence of an epiretinal membrane would influence macular thickness scans, one study also found epiretinal membranes were a common source of artifacts in RNFL scans.14
The evolution of posterior vitreous detachment (PVD) also affects RNFL scans, as focal traction at the vitreoretinal interface may cause the RNFL to look thicker. As the PVD progresses and the traction is released, the RNFL measurement becomes thinner.14 Without careful evaluation, this thinning may be misinterpreted as progression.
Uveitis can also impact RNFL scans. Patients with this condition have thicker RNFL during periods of inflammation and thinner RNFL during periods of inactivity; this thinning after resolution may be mistaken for disease-related loss.15
In addition, other optic neuropathies and retinal conditions can impact RNFL thickness. It is important to consider non-glaucomatous causes of thinning when progression is suspected.
Signal-to-noise ratio. Anything that obstructs the path of light in the acquisition of an OCT image may reduce the signal-to-noise ratio, which is associated with thinner RNFL measurements.16 Signal strength can be reduced with the presence of dry eye or media opacities such as cataracts or vitreous floaters. When sequential scans have worsening signal strengths, thinning can be misinterpreted as disease-related progression; thus, signal strength should always be considered when analyzing serial scans.
Artifacts. Blink artifacts and motion artifacts can be misinterpreted as progression if not properly identified on the en face image.17 Artifacts may lead to improper segmentation of RNFL or inner retinal layers on macular scans; some instruments allow for manual segmentation upon discovery of an error, but others do not. Research estimates that 15% to 36% of glaucoma patient scans contain some type of artifact.14 Recognizing and accounting for these artifacts is crucial to accurate progression detection.
 |
| Beware of artifacts. In the patient on the left, note the reduced signal strength and motion artifact (discontinuity of blood vessels) on exam three. When the scan was repeated, the signal strength was improved and the suspected change was not confirmed. In the patient on the right, note the high variability of the inferior RNFL measurement, most likely the result of the vitreous floater impacting the scan. Click image to enlarge. |
Stage of the disease. This has a significant impact on OCT relevance. The RNFL layer contains blood vessels, glial tissue and ganglion cell axons; even in eyes with no light perception due to glaucoma, the RNFL does not fall below 30µm; the floor effect on most commercial instruments is considered to be around 45µm to 50µm. As the RNFL approaches this floor in advanced glaucoma, the thickness is more heavily influenced by other structural components, such as blood vessels, and less by actual RNFL thickness, making progression detection more difficult.16
Patients with mild to moderate glaucoma may show significant rates of change in both RNFL and macular/ganglion cell layer thickness. In a study of advanced glaucoma patients, however, there was a significant difference in the rate of change of macular thickness, but not RNFL thickness, between progressive and non-progressive patients.18 This study highlights both the limitations of RNFL OCT and the potential benefits of macular OCT in more advanced disease. In a recently published study evaluating severe glaucoma patients, macular ganglion cell-inner plexiform layer was able to detect change, adding evidence that macular scans may be useful late in the disease process.19
Types of Glaucoma Changes
Specific patterns of RNFL progression have been identified in glaucoma.20 The most common type of RNFL change is an expansion or widening of an existing RNFL defect. The next is the development of new RNFL defects, followed by a deepening of an existing defect (often in conjunction with expansion).
The most common location of change is in the inferotemporal quadrant, approximately 2mm from the center of the disc. This location is important because this is outside of the circle scan used by commercial instruments. Therefore, clinicians cannot look solely at the RNFL circle scan profile (TSNIT curve), as it may miss these early changes. Clinicians should look at both the circle scan profile and the RNFL thickness/deviation maps to get a better sense of overall change.
With optic disc parameters, rim area is more sensitive than the vertical C/D ratio, probably because rim area takes into account the entire rim rather than a single axis. There is often poor agreement between RNFL, disc and macular parameters in progression analysis. Corroborating changes seen on multiple parameters is a strong indicator that the change is real and not an artifact.
Progression: Now What?
Along with automated perimetry and stereo optic disc photos, clinicians should obtain OCT (RNFL and macular protocols) at the time of diagnosis. To detect the rapidly progressing patients, four to six visual fields are recommended during the first two years following diagnosis.3 No firm guidelines have been developed regarding the frequency of OCT testing, but a rule of thumb is to obtain scans at roughly the same rate as visual fields. After two years, if the patient appears to be stable, the frequency of testing can be decreased. If progression is suspected, the frequency of examinations can be increased.
When progression is suspected based on OCT, clinicians should take a systematic approach to make appropriate clinical decisions.3 Here are the steps a clinician can take:
- Repeat the test. This will confirm that the suspected change is real rather than due to artifact.
- If the suspected change is verified, decide whether or not the change is typical of the changes seen in glaucoma versus a factor of age or other disease process.
- If the change appears to be glaucomatous, ascertain the rate at which the progression has occurred. If using trend analysis, this information is provided in terms of microns per year; with event analysis, the clinician should consider the time it took for the event, or change, to occur. Assessing the rate of change relative to the patient’s life expectancy and stage of the disease is important in deciding how aggressively, or even whether, to modify therapy.
Remember, a statistically significant change is not always clinically meaningful. For example, a slow, structural change in a patient advanced in age with minimal visual field loss might not necessitate any change in therapy, as it is unlikely to cause visual disability in the patient’s lifetime. Rapid progression in a younger patient, or progression in a patient with more advanced disease, is more likely an indicator for amplifying therapy with additional medications, laser trabeculoplasty or surgical intervention. Confirming that a change is glaucomatous and that the rate of change is clinically meaningful before changing therapy helps to avoid overtreatment.
When contemplating a change in therapy, the next step’s impact is pivotal. The impact of adding a second medication or switching from a single agent to a fixed combination medication is significantly lower than the risks associated with surgical intervention. Finally, if therapy is increased, update the baseline for all testing (visual fields, OCT and photography) so future changes are compared to an appropriate baseline.
OCT has become instrumental in our ability to diagnose glaucoma and detect progression. By understanding the ways in which OCT can detect change, as well as recognizing its limitations, clinicians can use this technology to its fullest capability.
Dr. Marrelli is a clinical professor and director of the Ocular Diagnostic Service at the University of Houston College of Optometry.
|
1. National Eye Institute. Glaucoma Awareness Can Help Save Vision for Millions. Available at https://nei.nih.gov/news/briefs/awareness_help_save_millions. Accessed August 5, 2016. 2. Malihi MM, Moura Filho ER, Hodge DO, Sit AJ. Long-term trends in glaucoma-related blindness in Olmsted County, Minnesota. Ophthalmology. 2014;121(1):134-41. 3. Weinreb RN. Progression of Glaucoma: The 8th Consensus Report of the World Glaucoma Association. Amsterdam: Kugler Publications; 2011. 4. Grewal DS, Tann AP. Diagnosis of glaucoma and detection of glaucoma progression using spectral domain optical coherence tomography. Curr Opin Ophthalmol. 2013;24(2):150-61. 5. Wong JJ, Chen TC, Shen LQ, Pasquale LR. Macular imaging for glaucoma using spectral-domain optical coherence tomography: a review. Semin Ophthalmol. 2012;27(5-6):160-6. 6. Kuang TM, Zhang C, Zangwill LM, et al. Estimating lead time gained by optical coherence tomography in detecting glaucoma before development of visual field defects. Ophthalmology. 2015;122:2002-9. 7. Yu M, Lin C, Weinreb RN, et al. Risk of visual field progression in glaucoma patients with progressive retinal nerve fiber layer thinning: a 5-year prospective study. Ophthalmology. 2016;123:1201-10. 8. Yu M, Weinreb RN, Yiu C, et al. Computer simulation of progressive retinal nerve fiber layer loss in glaucoma: performance of event and trend analysis. Invest Ophthalmol Vis Sci. 2011;52:9674-83. 9. Mwanza JC, Chang RT, Budenz DL, et al. Reproducibility of peripapillary retinal nerve fiber layer thickness and optic nerve head parameters measured with cirrus HD-OCT in glaucomatous eyes. Invest Ophthalmol Vis Sci. 2010;51(11):5724-30. 10. Leung CK, Yu M, Weinreb RN, et al. Retinal nerve fiber layer imaging with spectral-domain optical coherence tomography: a prospective analysis of age-related loss. Ophthalmology. 2012;119(4):731-7. 11. Leung CK, Ye C, Weinreb RN, et al. Impact of age-related change of retinal nerve fiber layer and macular thickness on evaluation of glaucoma progression. Ophthalmology. 2013;120:2485-92. 12. Miki A, Medeiros FA, Weinreb RN, et al. Rates of retinal nerve fiber layer thinning in glaucoma suspect eyes. Ophthalmology. 2014;121(7):1350-8. 13. Wessel JM, Horn FK, Tornow RP, et al. Longitudinal analysis of progression in glaucoma using spectral-domain optical coherence tomography. IOVS. 2013;54(5):3613-20. 14. Asrani S, Essaid L, Alder BD, Santiago-Turla C. Artifacts in spectral-domain optical coherence tomography measurements in glaucoma. JAMA Ophthalmol. 2014;132(4):396-402. 15. Moore DB, Jaffe GJ, Asrani S. Retinal nerve fiber layer thickness measurements: uveitis, a major confounding factor. Ophthalmology. 2015;122(3):511-7. 16. Leung CK. Diagnosing glaucoma progression with optical coherence tomography. Curr Opin Ophthalmol. 2014;25(2):104-11. 17. Hardin JS, Taibbi G, Nelson SC, et al. Factors affecting Cirrus-HD OCT optic disc scan quality: a review with case examples. J Ophthalmol. August 13, 2015. [Epub]. 18. Sung KR, Sun JH, Na JH, et al. Progression detection capability of macular thickness in advanced glaucomatous eyes. Ophthalmology. 2012;119(2):308-13. 19. Belghith A, Medeiros FA, Bowd C, et al. Structural change can be detected in advanced-glaucoma eyes. Invest Ophthalmol Vis Sci. 2016;57:OCT511-OCT518. 20. Leung CK, Yu M, Weinreb RN, et al. Retinal nerve fiber layer imaging with spectral-domain optical coherence tomography: Patterns of retinal nerve fiber layer progression. Ophthalmology. 2012;119:1858-66. |