During the last 15 years, optical coherence tomography (OCT) has revolutionized the way eye care practitioners diagnose and evaluate sight-threatening retinal, optic nerve and anterior segment disease. The technology has the unique ability to capture cross-sectional images of the cornea, retina and other ocular structures by evaluating interference patterns of reflected laser light. It is also able to analyze retinal nerve fiber layer (RNFL) and ganglion cell complex (GCC) thickness, generate a pachymetry map of the central cornea, and determine the exact degree of the anterior chamber angle.
Additional diagnostic technologies that have gained mainstream acceptance in recent years suitably complement OCT imaging. These include photography with fundus autofluorescence (FAF), visual evoked potential (VEP), pattern electroretinogram (pERG), dark adaptation, formal visual field (VF), corneal topography, specular microscopy and B-scan ocular ultrasound. Correlating relevant clinical data can enhance and accelerate disease diagnosis and progression evaluation, as well as help guide management decisions.
OCT Correlations in
Glaucoma Testing
When diagnosing and managing glaucoma patients, daily data correlation is something we are already comfortable with. For example, a thinned inferior retinal nerve fiber layer on OCT that matches a superior nasal step on the visual field with thin pachymetry enables a straightforward diagnosis. In conjunction with gonioscopy, this is the conventional method used to diagnose early glaucomatous change and monitor carefully for progression.
Newer instruments and software are now available to make the diagnosis of glaucoma even more precise. Further, this complementary data helps us diagnose borderline or anomalous cases that are not so clear, and allows detection of early disease progression in those already being treated for ocular hypertension or glaucoma.
• VEP. Visual evoked potential and pattern electroretinogram, previously reserved for specialty clinics, recently have been used more routinely in the detection and management of glaucoma. Both tests evaluate optic nerve function (which may diminish before structural damage manifests), and can help detect other optic neuropathies and macular diseases.
VEP testing uses a reversal stimulus technique to measure visual pathway stability, as well as the conduction integrity of the optic nerve and ganglion cell axons. Electrodes are placed in standardized positions in order to detect electrical signals and the conduction rate of the visual cortex. The patient views a screen that generates a reversing black and white checkerboard pattern.
The Diopsys NOVA-VEP system for glaucoma tests at both high- and low-contrast levels, which permits separation and interpretation of the parvocellular and magnocellular pathways.1 In early glaucomatous change, the magnocellular pathway becomes dysfunctional, and thus the low-contrast amplitude of VEP appears abnormal first.2 In more advanced stages of glaucoma, the high-contrast VEP appears abnormal as the parvocellular pathway becomes involved.1 Thus, low-contrast abnormalities are a diagnostic indicator in early glaucoma cases.
Increased VEP latency is correlated with the degree of cupping and level of optic disc cupping (in the case of optic neuropathy), as well as the severity of visual field deficit on standard automated perimetry. It is not, however, associated with intraocular pressure, miotic pupils, increased age or reduced visual acuity.3
• pERG. The electrical responsiveness of retinal ganglion cells is measured by pERG with the Diopsys NOVA-ERG contrast sensitivity software. Similar to VEP testing, electrodes are placed in standardized positions––but, in this instance, can garner information about retinal (specifically macular) electrical activity when the patient looks at a contrast-reversing stimulus.
In the early stages of glaucoma, the pERG signal from the ganglion cells diminish at a rate that exceeds the expected loss from the ganglion cell axon structure, which correlates with RNFL loss observed on OCT.4 Therefore, it is reasonable to monitor glaucoma suspects or established patients more carefully when they demonstrate significant abnormal pERG amplitudes, because these individuals have a higher rate of RNFL thinning and glaucomatous progression.5
• GCC imaging. The ganglion cell complex (GCC) is comprised of the three innermost retinal layers (the nerve fiber layer, ganglion cell layer and inner plexiform layer), which likely are damaged in the earliest stages of glaucoma––even before ganglion cell axonal loss is clinically evident.7 Glaucoma preferentially affects these inner layers, as opposed to all macular layers because they contain not only the axons, but also the cell bodies and dendrites of the ganglion cells.8
GCC analysis software, available on newer OCT units, aids tremendously in glaucoma progression monitoring. When examining patients, this software is able to detect the earliest structural changes by evaluating only the inner retinal layers.6
| |
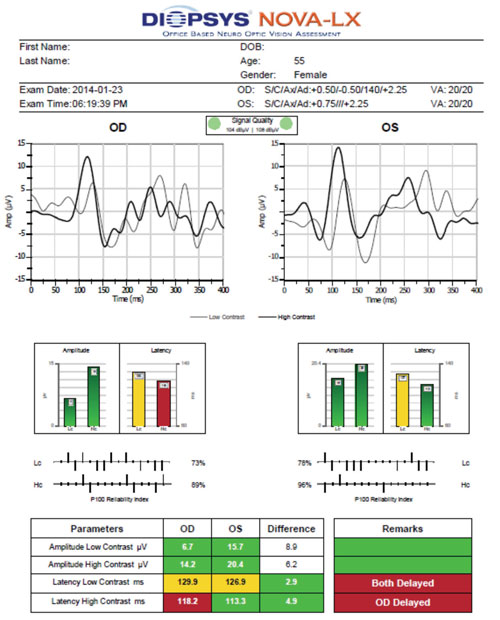
| Using visual evoked potential (VEP), the patient described in Case #1 exhibited borderline delayed latency at low contrast OU and delayed latency at high contrast OD. These findings are indicative of a functional deficit. |
Case #1
History
A 55-year old white female was referred for glaucoma testing because of an increased and asymmetric cup-to-disc ratio (CDR) noted during clinical examination. She reported no visual or ocular complaints.
Diagnostic Data
Her best-corrected visual acuity measured 20/20 OD, OS and OU at distance and near. Untreated intraocular pressure measured 19mm Hg OD and 18mm Hg OS. Gonioscopy showed a wide-open angle to the ciliary body, with minimal pigment––although a few iris processes were seen in each quadrant. The iris had a flat contour. Upon dilated fundoscopy, CDR measured 0.6 x 0.5 OD and 0.55 x 0.5 OS, with shallow cupping.
Retinal nerve fiber layer evaluation showed superior thinning and borderline inferior thinning OD, with borderline inferior thinning OS. GCC analysis showed borderline thinning OU. Global loss volume was borderline, while focal loss volume (FLV%) was normal. However, we observed a significant interocular difference in FLV% .
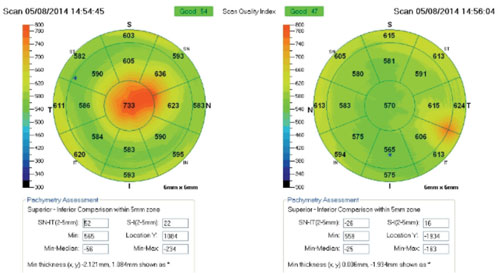
Central pachymetry was moderately thin, measuring 496µm OD and 497µm OS. Humphrey 24-2 visual field was within normal limits OD; however, we recorded a high number of fixation losses. The left eye exhibited superior central defects with non-edge points and good reliability. We noted no significant ptosis during the clinical examination that might account for this pattern.
| |
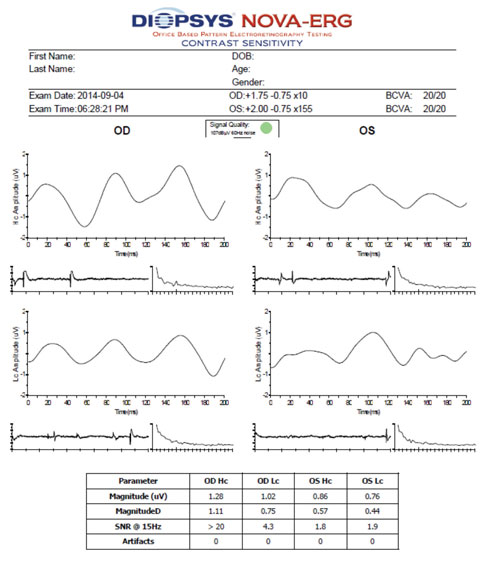
| Contrast sensitivity electroretinogram (ERG) indicated that the low-contrast waveform pattern OS was moderately abnormal in the patient described in Case #1. Together with the VEP results and ganglion cell complex findings, we diagnosed her with primary open-angle glaucoma. |
Diopsys contrast sensitivity ERG at 64-grating showed normal waveform patterns at high and low contrast OD, as well as a normal waveform pattern at high contrast OS. The N35, P50 and N95 peaks were easily identifiable, although amplitude––rather than latency––is the most sensitive electrophysiologic parameter for early glaucoma detection.9
Low-contrast waveform pattern was moderately abnormal OS. Because this ERG is not yet compared with age-related normals, interpretation is largely up to the managing clinician. Using 1.2µV as the normative cutoff, the right eye was within normal limits at high and low contrast, and the left eye was mildly abnormal at high contrast and moderately abnormal at low contrast. There also was a significant intereye difference, with amplitudes much smaller OS than OD at both high and low contrast.
The Diopsys NOVA-LX VEP is compared to age-related normal, so its results are easier to interpret. In glaucoma, the latency of VEP is more closely correlated to damage than the amplitude, which is the opposite of pERG testing.10 Both eyes exhibited borderline delayed latency at low contrast. Additionally, the right eye showed evidence of delayed high contrast.
Discussion
Although the visual field findings were not very impressive or highly indicative of early glaucomatous field loss, the pERG and VEP confirm a functional deficit––especially when correlated with retinal nerve fiber layer and GCC analysis.
Along with the knowledge of thinned pachymetry readings, the open chamber angles on gonioscopy and CDR measurements obtained via fundoscopy and fundus photography, we diagnosed patient was diagnosed with primary open-angle glaucoma.
OCT Correlations in
Anterior Segment Disease
Today, anterior segment OCT allows clinicians to evaluate corneal pachymetry from the central cornea out to 10mm, as well as more effectively quantify anterior chamber angle measurements. Further, the technology is capable of generating in vivo pseudo-histology data of anterior segment structures, including the cornea and iris.
In addition to slit lamp photography and anterior segment OCT, specular microscopy and corneal topography can help eye care providers more effectively examine corneal, iris and angle structures when diagnosing anterior segment disease.
• Specular microscopy. While OCT can evaluate the anatomic structure of all corneal layers in cross-section, specular microscopy provides a non-invasive, morphological analysis of the endothelial layer. It is the best imaging modality for analyzing corneal endothelial changes secondary to damage and cell death caused by disease, trauma or chemical toxicity.
Specular microscopy also is useful to evaluate cells that vary in size (polymegethism) and shape (polymorphism).11 This capability makes it especially helpful when evaluating contact lens-related hypoxia, because affected patients typically exhibit statistically greater polymegethism while maintaining a normal endothelial cell density.12
• Corneal topography. This diagnostic technique offers qualitative and quantitative information about corneal curvature. While some topographers generate various topographical representations and analyses, all devices share core measurement characteristics that can be used to evaluate corneal disease, unusual steepening or flattening, irregular astigmatism and contact lens fits. Particularly in corneal disease, comparing corneal topography to cross-sectional, OCT-derived, semi-histological information offers a more complete understanding of current epithelial status and long-term progression.
• Pachymetry. A measurement of corneal thickness is helpful in evaluating for the presence of edema or ectasia. Anterior segment OCT is capable of capturing a pachymetry measurement from several millimeters of cornea, rather than a single, central measurement via specular microscopy or conventional instrumentation. These measurements can be compared to corneal OCT scans taken the site of concern in order to compare anatomic variation with topographical and quantified corneal thickness.
Case #2
History
A 57-year-old white male presented six weeks after uneventful cataract surgery OU. He had no documented history of retinal disease.
 |
Diagnostic Data
His best-corrected visual acuity measured 20/40 OD and 20/30 OS. Funduscopy and OCT imaging did not reveal any evidence of macular pathology. Slit-lamp examination showed corneal endothelial disturbance and stromal edema central OD and inferotemporal OS. We then performed corneal/external slit lamp photography, as well as anterior segment OCT and specular microscopy, to determine the underlying etiology and extent of disruption.
Evidence of endothelial tear and scarring was documented central OD and paracentral OS. Overlying stromal edema also was evident on OCT.
Discussion
Based on these findings, we placed the patient on Muro 128 (Bausch + Lomb) solution BID OU and Muro 128 ointment QHS OU. We referred him to a corneal specialist, who agreed with our findings of corneal endothelial disruption and central tear following cataract surgery with secondary stromal edema.
We then scheduled him for a two-month follow-up. If we do not see improvement in his signs and symptoms at that visit, we will likely consider referring him for DSAEK.
OCT Correlations in
Macular Health
Optical coherence tomography helps eye care providers more effectively identify and treat diabetic macular edema, choroidal neovascularization, macular atrophy and central serous chorioretinopathy. Additionally, the technology helps differentiate between similar pathologies, such as vitelliform dystrophy and macular degeneration.
Certainly, spectral domain OCT’s high-resolution capabilities have made it even easier to diagnose retinal pathologies than it was using previous-generation, time-domain instruments. New OCT software also has the ability to examine the inner and outer retina, either simultaneously or separately, and can provide en face imaging for macular surface disease, such as epiretinal membrane.
In addition to OCT, macular disease can be monitored via fundus photography, fundus autofluorescence (FAF), multispectral imaging (MSI) and dark adaptation.
• FAF. Unlike other diagnostic technologies, fundus autofluorescence permits interpretation of the retinal pigment epithelium by imaging lipofuscin––a retinal fluorophore that ultimately accumulates in retinal pigment epithelium (RPE) lysozomes during photoreceptor outer segment phagocytosis. This allows indirect interpretation of the RPE’s metabolic activity.13
FAF imaging of a disease-free retina produces a uniform, granular, slightly hyperautofluorescent signal. Retinal disease and photoreceptor cell death, however, results in decreased autofluorescence secondary to diminished or non-existent metabolic demand on the RPE. Increased autofluorescence is due to rapid photoreceptor turnover or an abnormality in the phagosomal uptake of lipofuscin. In this instance, the patient has RPE compromise and active retinal disease.14
• MSI. Multispectral imaging is a noninvasive technique that permits an assessment of structural change in individual retinal layers and the choroid, based on their absorption spectra. MSI’s en face progressive imaging technique enhances the localization, and thus interpretation, of retinal pathologies.15 Some software also offers a perfusion map feature that can identify exudative retinopathy by examining oxygenated vs. deoxygenated hemoglobin to identify changes in retinal vasculature and leakage.
• Dark adaptation. AdaptDx (Maculogix) is a newly available device that is particularly useful in evaluating retinal conditions that cause impaired dark adaptation, such as retinitis pigmentosa and inherited retinal dystrophies. Additionally, the technology is extremely helpful in identifying early age-related macular degeneration (AMD).
Photoreceptors require specific nutrients to replenish pigments and clear opsin in order to regain dark vision sensitivity after light exposure. As the RPE/Bruch’s membrane complex structurally deteriorates in macular or retinal disease, nutrient and oxygen transportation to the rod and cone outer segments slows.16
Specifically in AMD, rod loss precedes, and is more severe than, cone loss in the parafovea. This holds true even in the exudative form of AMD.17 Therefore, dark adaptation is a prominent early functional marker of AMD, with greater than 90% sensitivity and specificity following AdaptDx testing.18
Case #3
History
A 55-year-old white female presented with a history of exudative AMD in her right eye and nonexudative AMD in her left eye.
Diagnostic Data
Her best-corrected visual acuity measured 20/25-2 OD and 20/25 OS. She exhibited mild central metamorphopsia in her right eye on Amsler testing; however, her left eye was normal.
|
|
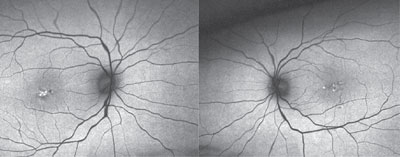
| Fundus autofluorescence imaging of our patient described in Case #3 (OD left, OS right) showed abnormal hypterautofluorescence located centrally (OD > OS). |
Fundus photography revealed RPE clumping and minimal drusen formation in both eyes. Additionally, her right eye exhibited a small disciform scar located temporal to the foveal avascular zone.
Optical coherence tomography confirmed the disciform scar’s location OD, as well as the bilateral drusen formation. Further, the OCT scan indicated that the photoreceptor integrity layer was intact OU, explaining the reasonably good visual acuity. Fundus autofluorescence showed abnormal hyperautofluorescence located centrally (OD > OS).
Dark adaptation showed delayed rod intercept of 10.69 minutes OD and 7.89 minutes OS, which matched the clinical scenario (i.e., the most severe findings were documented in the right eye). Normal dark adaptation time is 6.5 minutes or less, so the patient exhibited moderate bilateral impairment at baseline.
Discussion
The patient was already taking an AREDS supplement, and performing at-home Amsler monitoring. Because of the exudative status OD, as well as delayed dark adaptation OU, we scheduled her to return to the office every three months.
Optical coherence tomography has greatly enhanced clinical management of ocular disease; however, it only provides us with a portion of the total clinical picture. In conjunction with OCT, other technologies used to assess en face structure and tissue function give a more complete understanding of the pathology. Together, these instruments allow us to document disease progression over time, as well as evaluate the clinical efficacy of any prescribed treatment intervention.
Dr. Legge is in private practice at Wyomissing Optometric Center in Pennsylvania.
1. Rudvin I, Valberg A, Kilvak BE. Visual evoked potentials and magnocellular and parvocellular segregation. Vis Neurosci. 2000 Jul-Aug;17(4):579-90.
2. Klistorner A, Stuart G. Early magnocellular loss in glaucoma demonstrated using the pseudoramdomly stimulated flash visual evoked potential. J Glaucoma. 1999 Apr;8(2):87-154.
3. Towle V, Moskowitz A, Sokol S, Schwartz B. The visual evoked potential in glaucoma and ocular hypertension: effect of check size, field size, and stimulation rate. Invest Ophthalmol Vis Sci. 1983 Feb;24(2):175-83.
4. Ventura L, Sorokac N, De Los Santos R, et al. The relationship between retinal ganglion cell function and retinal nerve fiber layer thickness in early glaucoma. Invest Ophthalmol Vis Sci. 2006 Sep;47(9):3904-11.
5. Banitt M, Ventura L, Feuer W, et al. Progressive loss of ganglion cell function precedes structural loss by several years in glaucoma suspects. Invest Ophthalmol Vis Sci. 2013 Mar;54(3):2346-52.
6. Ou T, Chopra V, Tzu-Hiu Lu A, et al. Detection of macular ganglion cell loss in glaucoma by fourier-domain optical coherence tomography. Ophthalmology. 2009 Dec;116(12):2305-14.e2.
7. Mosca M, Rossi A, Sala R, Ratiglia R. Ganglion cell complex and peripapillary RNFL alterations in patients with open-angle glaucoma. Invest Ophthalmol Vis Sci. 2013:54:E-Abstract 2249.
8. Kendell K, Quigley H, Kerrigan L, et al. Primary open-angle glaucoma is not associated with photoreceptor loss. Invest Ophthalmol Vis Sci. 1995 Jan;36(1):200-5.
9.Ucles P, Almarcequi C, Fernandez F, Honrubia F. Early diagnosis of glaucoma with pattern-ERG. J Fr Ophthalmol. 1997 Feb;20(2):90-6.
10. Parisi V, Miglior S, Manni G, et al. Clinical ability of pattern electroretinograms and visual evoked potentials in detecting visual dysfunction in ocular hypertension and glaucoma. Ophthalmology. 2006 Feb;113(2):216-28.
11. McCarey B, Edelhauser H, Lynn M. Review of corneal endothelial specular microscopy for FDA clinical trials of refractive procedures, surgical devices, and new intraocular drugs and solutions. Cornea. 2008 Jan;27(1):1-16.
12. McLaughlin R, Schoessler J. Corneal endothelial response to refitting polymethyl methacrylate wearers with rigid gas-permeable lenses. Optom Vis Sci. 1990 May;67(5):346-51.
13. Wing G, Blanchard G, Weiter J. The topography and age relationship of lipofuscin concentration in the retinal pigment epithelium. Invest Ophthalmol Vis Sci. 1978 Jul;17(7):601-7.
14. von Rückmann A, Fitzke F, Bird A. Distribution of fundus autofluorescence with a scanning laser ophthalmoscope. Br J Ophtalmol. 1995 May;79(5):407-12.
15. Everdell J, Styles I, Calcagni A, et al. Multispectral imaging of the ocular fundus using LED illumination. Rev Sci Instrum. 2010 Sep;81(9):093706.
16. Owsley C, Jackson G, White M, et al. Delays in rod-mediated dark adaptation in early age-related maculopathy. Ophthalmology. 2001 Jul;108(7):1196-202.
17. Curcio C, Medeiros N, Millican C. Photoreceptor loss in age-related macular degeneration. Invest Ophthalmol Vis Sci. 1996 Jun;37(7):1236-49.
18. Jackson G, Scott I, Kim I, et al. Diagnostic sensitivity and specificity of dark adaptometry for detection of age-related macular degeneration. Invest Ophthalmol Vis Sci. 2014 Mar;55(3):1427-31.