With its relative ease of use, noninvasive technique and ability to aid in the diagnosis and management of a variety of retinal disorders, fundus autofluorescence (FAF) has increasingly become a mainstream imaging modality. Although FAF technology has been referenced in medical research for more than 40 years, advances over the last decade have made it increasingly relevant as an ophthalmic imaging technique suitable for daily practice.1 FAF provides a view of the disease processes from a metabolic perspective. Research has shown it to be effective in the early detection of retinal disease and the potential predictive makers for progression.1 It has also helped us understand certain pathophysiological mechanisms. Although an excellent clinical tool, FAF can be used in conjunction with conventional fundus photography, optical coherence tomography (OCT), fluorescein angiography and other imaging modalities to provide an even more complete clinical picture.
Lipofuscin
The retinal pigment epithelium (RPE) plays an important role in the normal functioning of the retina and is essential for vision. Lipofuscin, a byproduct of phagocytosed photoreceptor outer segments, is found in a number of aging and diseased tissues, including the RPE. Lipofuscin will accumulate in the RPE when its ability to break down pigmented outer segments of photoreceptors is compromised. While this occurs naturally with age, excess accumulation is considered pathologic and may occur with RPE cell dysfunction or abnormal metabolic load on the RPE.1 This makes the presence of lipofuscin a potential early indicator of degenerative retinal diseases. FAF allows us to take advantage of the autofluorescent properties of lipofuscin when exposed to short-to-medium wavelengths of light (short 500nm to medium 750nm).1-3,5,9 This lets us visualize RPE changes that are affected by lipofuscin.
FAF Images
The images produced are similar in appearance to those of fluorescein angiography images; however, unlike FA, FAF is not dependent on circulation as is fluorescein angiography. The intensity of the FAF signal corresponds to the accumulation or absence/reduction of lipofuscin and is compared to the surrounding retina. In a healthy retina, the posterior pole will have a diffuse gray appearance—a mildly hyper-fluorescent signal due to normal levels of lipofuscin in RPE cells. The optic nerve head is dark due to the absence of RPE, retinal vessels appear dark due to signal absorption from blood and the fovea appears dark due to absorption from macular luteal pigment.3,9 By evaluating this pattern of lipofuscin distribution in the RPE, we can begin to visualize disease processes. Any deviation from normal results should be evaluated, and that cause determined.
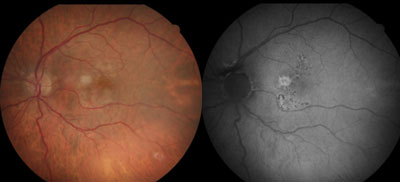 | |
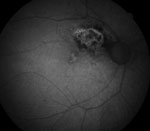
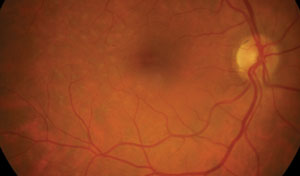
| Figs. 1a and 1b. At left, fundus photo shows early-stage dry AMD. At right, FAF image shows large soft drusen associated with increased fundus autofluorescence in a patchy FAF pattern. There are also more defined areas of hyper-AF corresponding to mixed drusen in a focal increased pattern superior and inferior to the fovea. |
When interpreting FAF images, the image quality and amount of FAF intensity from one patient to the next may vary due to several variables, such as age, media opacity and pupil size. The type of FAF device used—scanning laser ophthalmoscope (SLO) vs. fundus camera-based system—will also affect the image.2,3 These factors are important to recognize, as FAF intensity is relative to variables such as these, as well as each individual patient. Absolute FAF values therefore cannot be precisely determined between patients.
FAF in Disease
Reduced FAF signals may be indicative of RPE atrophy, cell loss or death, hyper-pigmentation, subretinal fluid or new hemorrhages. Focal areas of increased FAF signal may be caused by drusen, older hemorrhages and excess concentrations of lipofuscin in the RPE. Increased levels of autofluorescence typically indicates abnormal metabolism. Changes that are visible with FAF are often not visible clinically or with other imaging techniques such as conventional fundus photography. This means that not only can FAF be used to highlight areas of diseased retina and abnormalities that may otherwise not be visible, but it may serve as a marker of disease progression, with potential prognostic value.3,4,6
Early Macular Degeneration
In its early stages, dry age-related macular degeneration (AMD) may show a wide variety of FAF patterns that are not always visible funduscopically. These patterns were categorized into eight phenotypes and described by the Fundus Autofluorescence in Age-related Macular Degeneration (FAM) study group.3
As AMD progresses, changes may be seen with FAF imaging before the appearance of visible lesions. For example, images demonstrating several defined areas of markedly increased FAF (focal FAF pattern) have been shown to represent a higher risk of progression to geographic atrophy.3 Images with multiple large (>200µm in diameter) areas of increased FAF that correspond to soft drusen and hyperplasia (patchy pattern) have been found to represent a higher risk of conversion to wet AMD.3 (Figures 1a and 1b).
Late Macular Degeneration
We know that geographic atrophy (GA) is an important cause of severe, irreversible vision loss in patients with AMD. When lipofuscin is absent due to RPE cell loss and death, as in the case with GA, the FAF signal drastically decreases. FAF allows a more dramatic visualization of areas of atrophy than standard fundus photography. It is the area surrounding the GA, described as the junctional zone, that may serve to help predict risk of progression.
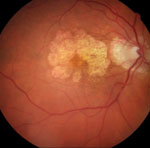  | |
| Figs. 2a and 2b. At left, fundus photograph of late dry AMD and geographic atrophy. At right, FAF image shows the intensity of the atrophic areas surrounding the macular area, markedly decreased due to loss of lipofuscin and clearly delineated. While the surrounding retina appears mostly normal on the fundus photograph, FAF gives additional information by showing increased FAF intensity in a fine granular pattern extending beyond the geographic atrophy (GA) junctional zone. This pattern has been shown to increase the likelihood of GA progression. |
The FAM study group found that, in general, the more hyper-autofluorescent the FAF signal is at the junctional zone, the more likely there will be GA progression. This is especially true when the autofluorescent signal expands in a diffuse pattern beyond the area of GA (Figures 2a and 2b). Interestingly, the FAF patterns described by the FAM study group demonstrate a stronger impact on GA progression than other risk factors—including age, history of smoking, atrophy size at baseline and systemic disease.3,6 In terms of the patient, being able to identify risk of future vision loss is functionally relevant for procurring low vision aids and maintaining quality of life.
Choroidal Nevi and Melanoma
FAF also helps to differentiate acute from chronic intraocular lesions. Benign lesions, such as choroidal nevi, are found in up to 7% of white patients, but at times may be difficult to distinguish from a small melanoma.9,10 Choroidal melanoma represents a serious and even life-threatening malignancy with approximately 2,000 new cases in the United States each year.9
When evaluating a choroidal lesion with FAF, be mindful of both the intrinsic autofluorescence of the lesion as well as its extrinsic properties, specifically overlying RPE. Generally speaking, pigmented choroidal nevi and melanoma have relatively low intrinsic autofluorescence, while the overlying RPE is often more telling, considering RPE hyperplasia and atrophy have a much more dramatic hypo-autofluorescent appearance and are more indicative of a choroidal nevus.
Drusen, also suggestive of chronic nevi, will typically display a slightly increased FAF pattern. In contrast, melanoma and high-risk nevi often demonstrate a marked amount of intense extrinsic hyper-autofluorescence due to orange pigment and to a lesser extent, subretinal fluid.8,9
  | |
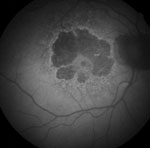
| Figs. 3a and 3b. At left, fundus photo shows a choroidal nevus with high risk for conversion. At right, orange pigment provides an intense signal and is easily visible in this FAF image. Areas of overlying RPE atrophy with low intensity are also evident. |
FAF imaging is ideal for detecting orange pigment, which is sometimes subtle or near-invisible funduscopically, especially in deep or amelanotic lesions (Figures 3a and 3b).9
Retinal Telangiectasia
Investigators have found that Type 2 idiopathic macular telangiectasia (IMT) can be seen using FAF via changes in the fovea, even in the early stages of the disease.11 While the exact mechanism of IMT itself is not completely understood, the FAF changes are likely the result of pathological changes in macular pigment distribution or changes in the RPE lipofuscin and melanin composition. In early IMT, FAF abnormalities at the macula may precede changes shown by other imaging modalities. In later stages of IMT, low areas of FAF surrounded by increased FAF may signal signs of likely progression.11
Retinal Dystrophies
Pattern dystrophies, Best’s disease, Stargardt’s disease and other vitelliform dystrophies are all conditions that may be better visualized with the aid of FAF imaging.12,13 Hyper-autofluorescence will vary depending on lipofuscin concentration, while areas of RPE atrophy (which lack lipofuscin) are easy to identify because of their low intensity. Appearance of FAF is limited in its ability to help differentiate between various forms of retinal dystrophies, especially in late stages, but is helpful for monitoring retinal changes for follow-up in addition to with genetic testing and counseling.12
In retinitis pigmentosa, FAF may show a hyper-autofluorescence parafoveal ring that will tend to constrict over time, as will a patient’s visual function.14,15 With the advent of widefield FAF images, researchers have found that peripheral areas of hypo-autofluorescence correlate with visual field loss and progression indicated by surrounding hyper-autofluorescence similar to GA in AMD.15
Other FAF Applications
In addition to traditional 10-2 threshold visual field testing, FAF is among the objective tools that may be used as part of the screening process for hydroxychloroquine maculopathy.
A ring of hyper-autofluorescence along with parafoveal dark areas will be visible. This is especially true in moderate and later stages of hydroxychloroquine maculopathy.16 Researchers speculate as to the sensitivity of FAF in early stages of hydroxychloroquine toxicity for some patients, especially compared with spectral domain OCT and mfERG, and it is always important to check for toxic hydroxychloroquine dosing during your screening.7
  | |
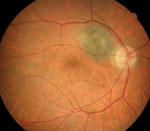
| Figs. 4a and 4b. Above, this fundus photo of a patient who has undergone past panretinal photocoagulation shows subtle hints of previous laser treatment temporal to the macular area. Below, the FAF image clearly defines the extent of the previous surgery. Note that on FAF, there is a diffuse hyper-AF signal to the image due to media opacity (cataract). |
Postoperative laser sites are often easier to visualize when using FAF. The extent of subtle focal laser or PRP atrophy is well defined using FAF and may help confirm treatment areas. Consider that not all patients are aware of their exact past ocular surgical histories, including what type of surgery or which eye, and FAF may provide a dramatic picture of a laser-treated retina (Figure 4a and 4b).
FAF is a great clinical tool for detecting and monitoring a variety of retinal conditions and has become a readily available imaging technique. In some cases, it’s not the availability of FAF limiting its use, but some uncertainty in its interpretation, as demonstrated in a recent hydroxychloroquone screening study.7
FAF is more than just another picture. It provides a metabolic map of the retina, giving us detailed insight to disease processes that may otherwise remain unseen. It allows us to manage a variety of conditions at earlier stages than ever before and gives us the chance to improve long-term visual outcomes for our patients.
Dr. Mercado is a staff optometrist at the Salisbury VA Medical Center. He is also an adjunct faculty member at the Illinois College of Optometry and the Southern College of Optometry.
Dr. Louprasong is a staff optometrist at the Cincinnati VA Medical Center.
1. Sepah, Yasir, et al. Fundus autofluorescence imaging: Fundamentals and clinical relevance. Saudi J Ophthal. 2014 Apr;28(2):111-6.2. Jorzik J, Bindewald A, Dithmar S, Holz F. Digital simultaneous fluorescein and indocyanine green angiography, autofluorescence, and red-free imaging with a solid-state laser-based confocal scanning laser ophthalmoscope. Retina. 2005;25:405-16.
3. Schmitz-Valckenberg S, Fleckenstein M, Scholl H, Holz F. Fundus autofluorescence and progression of age-related macular degeneration. Survey of Ophthalmology. 2009;54(1):96-117.
4. Ruckmann, Andrea von, et al. Macular retinal dystrophies. macular and retinal dystrophies. Atlas of Fundus Autofluorescence Imaging. 2007:79-119.
5. Biarnés M, Arias L, Alonso J, et al. Increased fundus autofluorescence and progression of geographic atrophy secondary to age-related macular degeneration. The GAIN study, Am J of Ophthal. 2015 Aug;160(2):345-53.
6. Schmitz-Valckenberg, Steffen, et al. Correlation between the area of increased autofluorescence surrounding geographic atrophy and disease progression in patients with AMD. IOVS. 2006 Jun;47(6):2648-54.
7. Browning D. Impact of the revised American Academy of Ophthalmology guidelines regarding hydroxychloroquine screening on actual practice. Am J Ophthalmol. 2013 March;155(3):418-28.
8. Shields C, Nianciotto C, Pirondini C, et al. Autofluorescence of choroidal melanoma in 51 Cases. Br J Opthalmol. 2008.92:617-22.
9. Almeidaa A, Kalikia A, Shields C. Autofluorescence of intraocular tumors. Curr Opin in Ophthalmol. 2013 May;24(3):222–32.
10. Albertus D, Schachar I, Zahid S, et al. Autofluorescence quantification of benign and malignant choroidal nevomelanocytic tumors. JAMA Ophthalmology. 2013 Aug;131(8):1004-8.
11. Wong W, Forooghian F, Majumdar Z, et al. Fundus autofluorescence in type 2 idiopathic macular telangiectasia: correlation with optical coherence tomography and microperimetry. Am J Ophthalmol. 2009 October;148(4):573–83.
12. Boon C, Klevering B, Keunen J, et al. Fundus autofluorescence imaging of retinal dystrophies. Vision Research. 2008 Nov:48(26):2569-77.
13. Maurizio B, Pierluigi I, Stelios K, et al. Retro-mode imaging and fundus autofluorescence with scanning laser ophthalmoscope of retinal dystrophies. BMC Ophthalmology. 2012 May;12:8.
14. Murakami T, Akimoto M, Ooto S, et al. Association between abnormal autofluorescence and photoreceptor disorganization in retinitis pigmentosa. Am J Ophthalmol. 2008 April:145(4):687-94.
15. Ogura S, Yasukawa T, Kato A, et al. Wide-field fundus autofluorescence imaging to evaluate retinal function in patients with retinitis pigmentosa. Am J Ophthalmol. 2014. Nov;158(5):1093-8
16. Marmor M. Comparison of screening procedures in hydroxychloroquine toxicity. JAMA Ophthalmology. 2012 April;130(4):461-9.