Choroidal and retinal vessel analysis has become easier with the introduction of the OCT-A. Currently, there is no standardized method for analyzing the images, however, and physicians primarily interpret them qualitatively rather than quantitatively. Being able to identify new vessels beneath the retina is crucial in deciding whether to initiate intravitreal treatment. Researchers based in Genoa, Italy recently investigated variability between observers in their ability to assess imaging differences in macular and optic disc/optic nerve head (ONH) glaucoma scans. The team identified an easy and reproducible method that appears to be fast and can assist physicians in assessing macular and ONH perfusion with less inter-image variability, particularly in the 70μm superficial area of the optic disc.
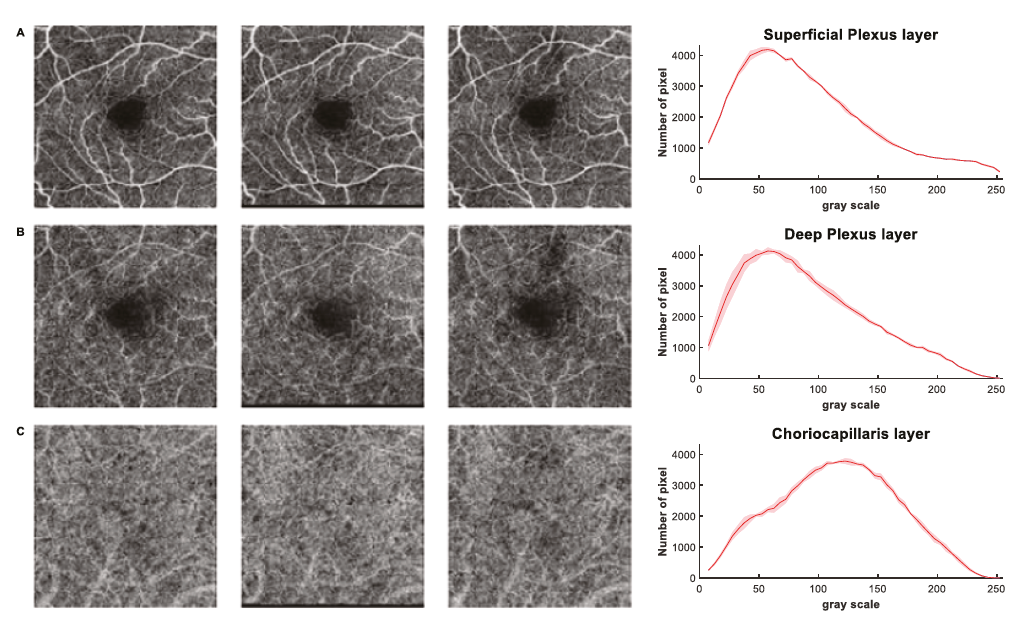 |
| The analysis quantified variations in scans of the same patient and same anatomical site to help uncover blood flow patterns characteristic of glaucoma. Photo: Cassottana P, et al. Eye (Lond). April 13, 2024. Click image to enlarge. |
The proposed method analyzed swept-source OCT-A images (DRI OCT Triton, Topcon) with the premise that black pixels indicate no flow, white pixels represent high flow and gray pixels represent varying degrees of blood cell movement within vessels. A curve was generated to summarize all the data obtained from each subgroup. The analysis focused only on the gray pixels, thereby considering only the intermediate flow levels. A total of 20 glaucomatous and 20 healthy eyes underwent three OCT-A scanning of the ONH and macula. Macular and papillary and peripapillary vascular networks were calculated.
In glaucomatous eyes, the vascular layer coefficient of variation ranged from 4.49% to 8.54%, while in the control group from 3.58% to 8.32%. Both groups exhibited higher coefficient of variations when assessing the optic disc. The papillary and macular microvasculature reproducibility was comparable between groups.
When analyzing the microvasculature in the ONH, less inter-image variability was observed in the 70μm superficial area of the optic disc, which includes the radial peripapillary capillaries and vitreous layers for the analysis of the optic disc, and in the superficial and choriocapillaris layers for macular blood flow assessment in both glaucomatous and healthy eyes.
“These layers may be the focus for the analysis of blood flow defects and could serve as promising parameters for diagnosing glaucomatous damage and early biomarkers in glaucoma pathogenesis,” the researchers proposed in their paper for the British journal Eye. “Investigating the correlation between blood flow measurements and global indices from visual field tests could help understand the relationship between vascular integrity of the optic nerve and functional progression in glaucomatous patients, shedding light on whether vascular alterations are causes or effects of optic nerve damage in glaucoma.”
Cassottana P, Iester C, Bonzano L, Traverso CE, Iester M. Quantitative evaluation of OCT angiography images in healthy and glaucomatous subjects through a novel approach: exploring inter-image variability. Eye (Lond). April 13, 2024. [Epub ahead of print]. |