 |
|
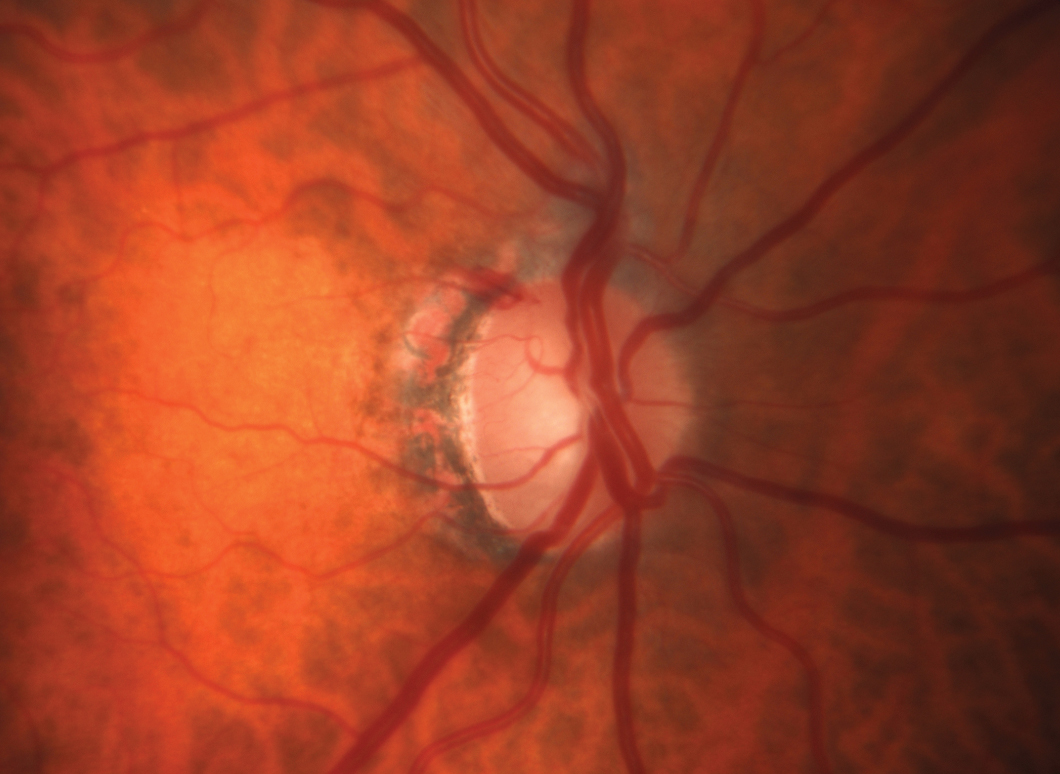
Out of the three groups measured, glaucomatous eyes with the largest systolic velocity of blood difference show the most damage, which may help doctors recognize eyes that are more at-risk of progressing. Click image to enlarge. |
The role of intraocular pressure (IOP) in glaucoma is central to discussions of disease management, as it’s the only factor modifiable by medications or surgery. Curiously, however, the interplay of IOP and blood pressure (BP) is likely a bit underemphasized in clinical practice, despite well-known influences of BP on pressure gradients within the eye.
In research presented at ARVO 2024 earlier this week, researchers used a mathematical model that was created based on the properties of blood flowing throughout the body in a large number of healthy eyes. Using color Doppler imaging (CDI), they documented a metric called the peak systolic velocity and then combined those findings with physiological principles to characterize POAG eyes and identify those at a higher risk. Higher values for peak systolic velocity indicate the presence of stenosis, often in the carotid artery, as thinner vessels cause blood to traverse more rapidly.
The model developed by this team synthesizes cardiovascular principles with ocular findings. “If we feed it values that are easily measured like blood pressure, IOP and heart rate, it can estimate properties of blood in the body related to the eye,” the researchers wrote in their abstract. “One of these properties is the systolic velocity of blood in the central retinal artery, which is important in getting the blood from the heart to the eye.”
Over 900 POAG eyes from the Indianapolis Glaucoma Progression Study with measurements of systolic velocity were taken. Each subject’s individualized IOP, blood pressure and heart rate values were then used estimate the peak velocity that would be expected from a standard healthy eye. The values estimated by the model were compared with CDI-measured values for each eye, then classified into three groups based on the difference between the model-estimated and the CDI-measured results as follows:
Group 1: <2cm/s difference
Group 2: 2-5cm/s difference
Group 3: >5cm/s difference
Eyes in Group 1 had the highest values for retinal nerve fiber layer thickness, lowest cup-to-disc ratios and the lowest mean deviation and patterned standard deviation. In contrast, Group 3 showed the worst structural and functional markers among the groups.
“We found that the eyes with the largest difference show the most damage. This shows promise for helping doctors recognize glaucoma eyes that are more at-risk of progressing,” the authors explained in their abstract.
The researchers hope future studies build on this work to develop future clinical applications. Regardless, the research continues to clarify the relationships between blood flow and IOP in ways that should help doctors to more strongly perceive that ocular health in the context of overall health and cardiovascular health specifically.
Original abstract content ©2024 Association for Research in Vision and Ophthalmology.
Rai R, Harris A, Verticchio A, et al. Physiology-guided classification of primary open-angle glaucoma eyes based on systolic velocity deviation: a structural and functional analysis. ARVO 2024 annual meeting. |