 |
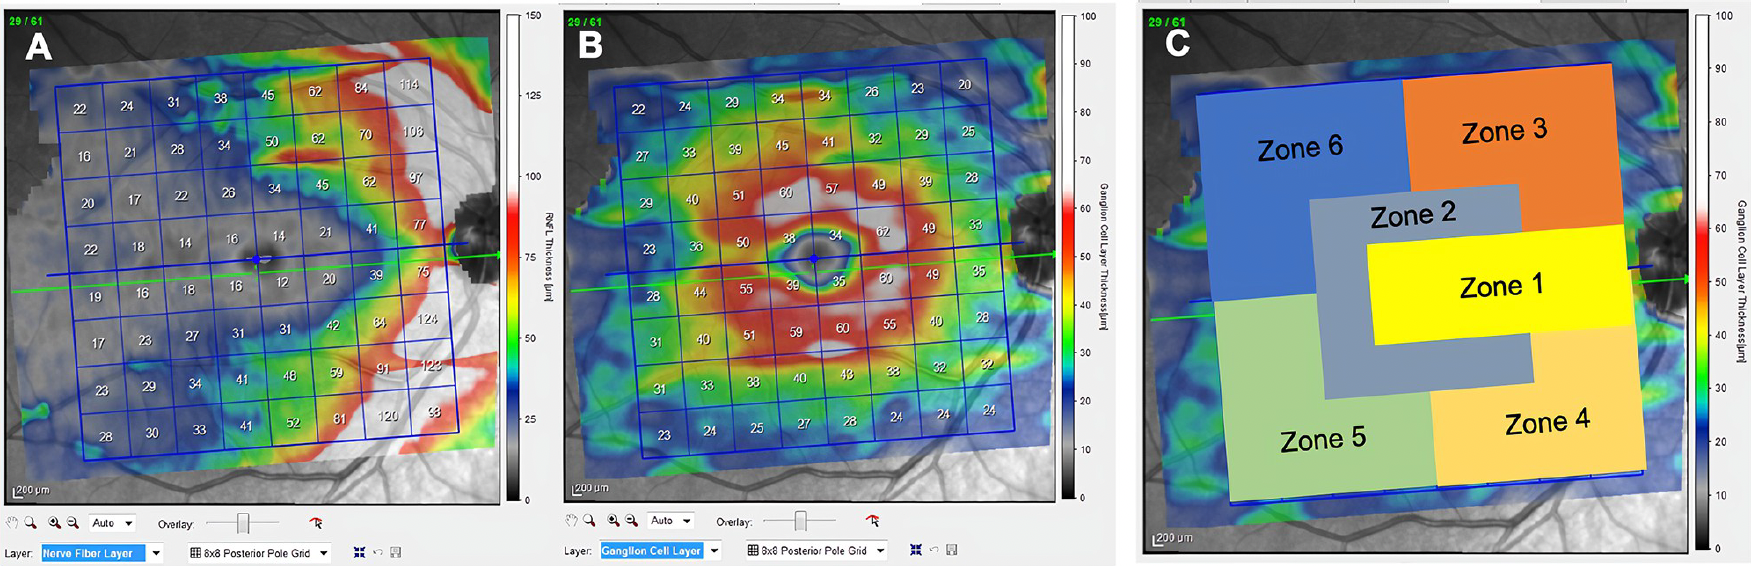
| A Spectralis OCT testing mode called the posterior pole protocol found a correlation between RNFL and GCL thickness and disability status in MS that indicates disease severity prognosis. Warm colors represent higher thickness values and cool colors show thinner regions. Fig. A shows the averaged RNFL values of all study subjects while B shows that of the GCL. Fig. C denotes six proposed zones to track that may manifest differently at various stages of the disease. Photo: Vilades E, et al. Plos One, July 13, 2023. Click image to enlarge. |
Multiple sclerosis (MS) is now considered the most common autoimmune and neurodegenerative central nervous system disease and the second leading cause of permanent disability in young adults. Given its prominence among CNS disorders, one new study clarified if OCT imaging could identify differences in structures when compared with controls.
Specifically, researchers looked at the retinal nerve fiber layer (RNFL) and ganglion cell layer (GCL) thickness in MS patients with the relapsing-remitting form (RR-MS). The team also assessed potential correlations between RNFL and GCL thickness, disease duration and scores on a measure called the Expanded Disability Status Scale (EDSS).
The RR-MS group was divided into subgroups by initial onset of symptoms and conversion to clinically definite MS. Four categories in all were studied:
- clinical symptom onset in five years or fewer (CSO-1)
- clinical symptom onset in six year or more (CSO-2)
- clinically definite MS in five years or fewer (CDMS-1)
- clinically definite MS in five years or fewer (CDMS-2)
A total of 66 control eyes were included with the 100 RR-MS eyes, with thinning seen in both the RNFL and GCL thickness layers between the two groups. Moderate to strong correlations were seen between RNFL and GCL thickness and all disease states, as well as a strong correlation with EDSS one year following OCT examination. Overall, RNFL thickness mapped more onto disability status, while GCL thickness more to disease duration.
While these results echo prior studies, the present work adds the results from a new OCT testing strategy on the Heidelberg Spectralis called the posterior pole protocol, which, as the study authors put, “offers the opportunity to analyze larger areas than the classic macular protocols based on ETDRS grid analysis.” They also note that it improves anatomical determination of the location of the papillomacular bundle, one of the first anatomopathological processes in the disease and hence a great potential early diagnostic biomarker.
The authors continue that, by their results, patients with early-stage MS exhibited most notable decline in thickness in the region around the macula and papillomacular bundle, which are areas that have a greater density of axons with smaller diameters. Smaller-diameter axons are more vulnerable to damage vis demyelination, and unfortunately, can be challenging for OCT to measure, making thinning areas’ segmentation less precise.
However, the researchers do point out that their data is indicative of placing the GCL as a structure that may be affected before the RNFL, as seen in the CSO-1 and CDMS-1 groups with zones that displayed significant GCL damage. At the same time, the inferior-temporal and superior-temporal zones did not show RNFL differences. The inferior-nasal zone did display RNFL changes but no GCL changes in the first five years in both groups and subgroups.
Clinically, the authors widen their findings to encompass disease detection. They propose that “in MS, the posterior pole protocol detects GCL affectation earlier than changes in the RNFL are detected.” They also see evidence in the results that “the RNFL is a good indicator of disease severity prognosis (EDSS score one year later); the greater the macular RNFL thinning, the greater the possibility of disease progression.”
Viladés E, Cordón B, Pérez-Velilla J, et al. Evaluation of multiple sclerosis severity using a new OCT tool. PLoS One. July 13, 2023. 18(7):e0288581. |