 |
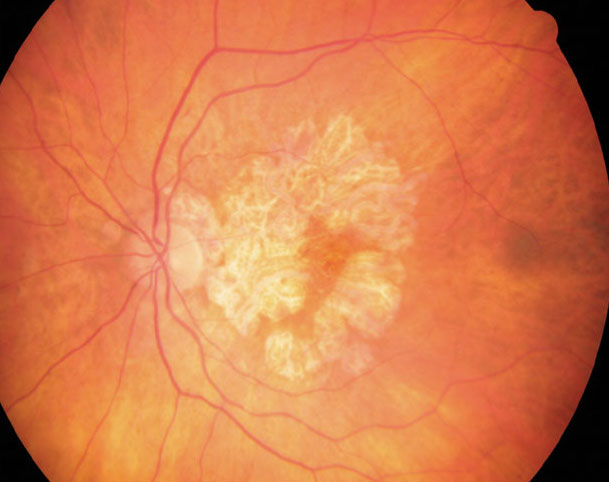
| The average geographic atrophy growth rate for this study was 1.430mm2/year and the average square root transformed geographic atrophy growth rate was 0.268mm/year. This was recorded over a mean time period of 3.7 years. Click image to enlarge. |
Geographic atrophy is of growing importance in both research and clinical circles, now that there are treatment options available. Several different imaging biomarkers have recently been discovered to be associated with the conversion from the intermediate stage of AMD to GA. “However, less is known about imaging biomarkers for rates of geographic atrophy progression once [it] is established,” University of Colorado School of Medicine researchers wrote in their latest study, published last week in American Journal of Ophthalmology. Their aim was to establish which multimodal imaging biomarkers and patient demographics were associated with geographic atrophy growth rate.
In a prospective cohort study, the team examined 121 eyes from 66 patients with advanced dry AMD with geographic atrophy. Each participant was enrolled in the University of Colorado AMD Registry from August 2014 to June 2021 and were required to follow-up with researchers through June 2023. Throughout the study, GA growth rate was measured between enrollment and final evaluation.
The study found associations between lesion growth rate and patient variables of age, sex and body mass index, mentioned the researchers in their studied. They observed that there was a statistically significant positive association between GA growth rate and patient age as well as female sex. However, BMI’s association was inversely related. Associations between growth rate and race, smoking history and family history were not significant.
After the researchers adjusted for demographic factors in their data, they discovered that growth rate showed a statistically significant positive association with the presence of non-exudative subretinal fluid, non-exudative subretinal hyperreflective material and incomplete RPE and outer retina atrophy. However, subfoveal choroidal thickness and the presence of retinal pseudocysts showed a negative association.
“Multiple imaging biomarkers considered predictive for formation of geographic atrophy, such as reticular pseudodrusen, outer retinal tubulation, drusenoid pigment epithelia detachment and calcified drusen, were not found to be significantly associated” with GA growth rate in this study, reported the researchers in their study. “This may be because certain biomarkers predict conversion to geographic atrophy but might not play a role in progression once geographic atrophy is established.”
Due to the small sample size and the exploratory nature of this study, the researchers were conservative in their conclusions. They propose that future studies are needed to validate their results and a larger sample size would increase the probability to detect changes in rates of geographic atrophy for certain biomarkers. Furthermore, they believe that a larger cohort could produce enough data for a more comprehensive risk score for geographic atrophy growth rate or an artificial intelligence model in the future. They concluded in their article that “this study as well as the proposed future analyses can help to better determine which patients would benefit from intravitreal complement inhibition or future geographic atrophy therapeutics.”
de Carlo Forest TE, Gill Z, Lisker-Cervantes A, et al. Association between quantitative and qualitative imaging biomarkers and geographic atrophy growth rate. American Journal of Ophthalmology. March 27, 2024. [Epub ahead of print]. |