 |
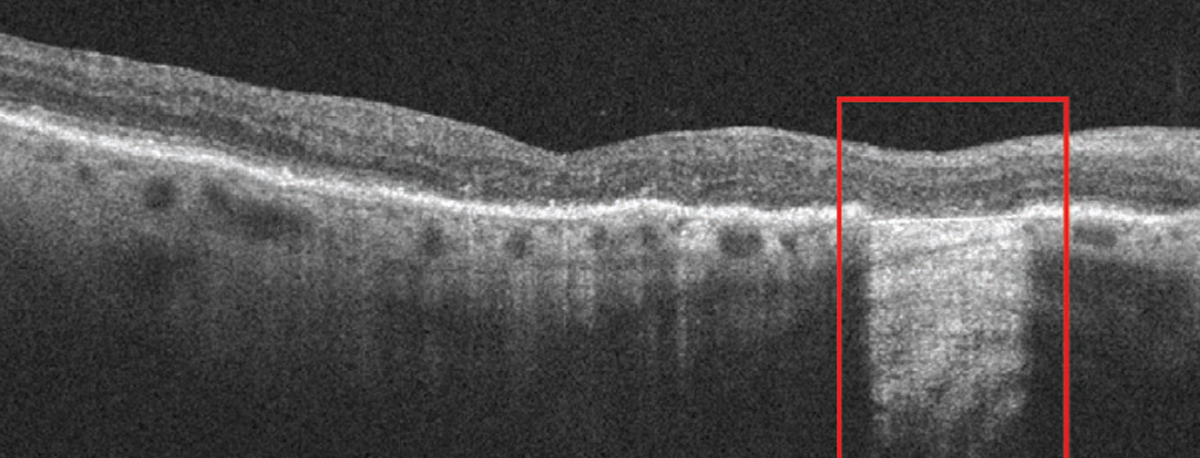
| This study found a strong correlation between the cRORA area measurements in the SD-OCT infrared image and FAF. Photo: Anna Bedwell, OD. Click image to enlarge. |
Fundus autofluorescence (FAF) has been ranked among the best imaging technologies for observing the development and progression of geographic atrophy (GA). However, recent advances in SD-OCT have given the widespread modality more potential to aid in the earlier diagnosis of GA and tracking of progression. To see how the performance of the two technologies compare in the assessment of GA, a recent study measured its enlargement rate—defined as complete retinal pigment epithelium and outer retinal atrophy (cRORA)—using both devices in a clinical routine population. The researchers reported that the area of cRORA on SD-OCT closely correlated to that shown on FAF, suggesting the GA parameter may have utility with either device.
The study included 204 eyes of 129 patients with cRORA in at least one eye and a mean follow-up of 4.2 years. FAF and SD-OCT scans were performed on all participants, and measurements from both were compared.
Initially or during follow-up, more than half of eyes (53.4%) were classified as macular neovascularization (MNV)-associated GA in age-related macular degeneration (AMD). The remaining 46.6% of eyes were classified as pure GA in AMD. In 72% of eyes, the primary lesion was unifocal, and in 28%, it was multifocal.
The researchers noted in their paper, “A strong correlation was observed between the area of cRORA (SD-OCT) and the FAF GA area.” They reported that the mean enlargement rate was 1.44mm2/year, and there was no significant difference between the enlargement rate of eyes with anti-VEGF injections (MNV-associated GA; 0.30mm/year) or without (pure GA; 0.28mm/year).
“Eyes with multifocal atrophy pattern at baseline had a significantly higher mean enlargement rate compared with eyes with unifocal pattern (0.34mm/year vs. 0.27mm/year),” the study authors also pointed out. “There were moderate significant correlations between external limiting membrane and inner-/outer-segment line disruption scores and visual acuity at baseline, five and seven years.” The multivariate regression analysis also revealed two baseline factors that were associated with a higher mean enlargement rate: a multifocal cRORA pattern and a smaller lesion size.
The data from this study shows that SD-OCT and FAF have good comparability in measuring cRORA. The researchers also noted that “despite the area measurement of GA in the FAF being easier to perform due to higher contrast differences, evaluating cRORA in the infrared image under simultaneous control in the OCT B-scan might be a good alternative.”
Cedro L, Hoffmann L, Hatz K. Geographic atrophy in AMD: prognostic factors based on long-term follow-up. Ophthalmic Res. May 12, 2023. [Epub ahead of print]. |