 |
|
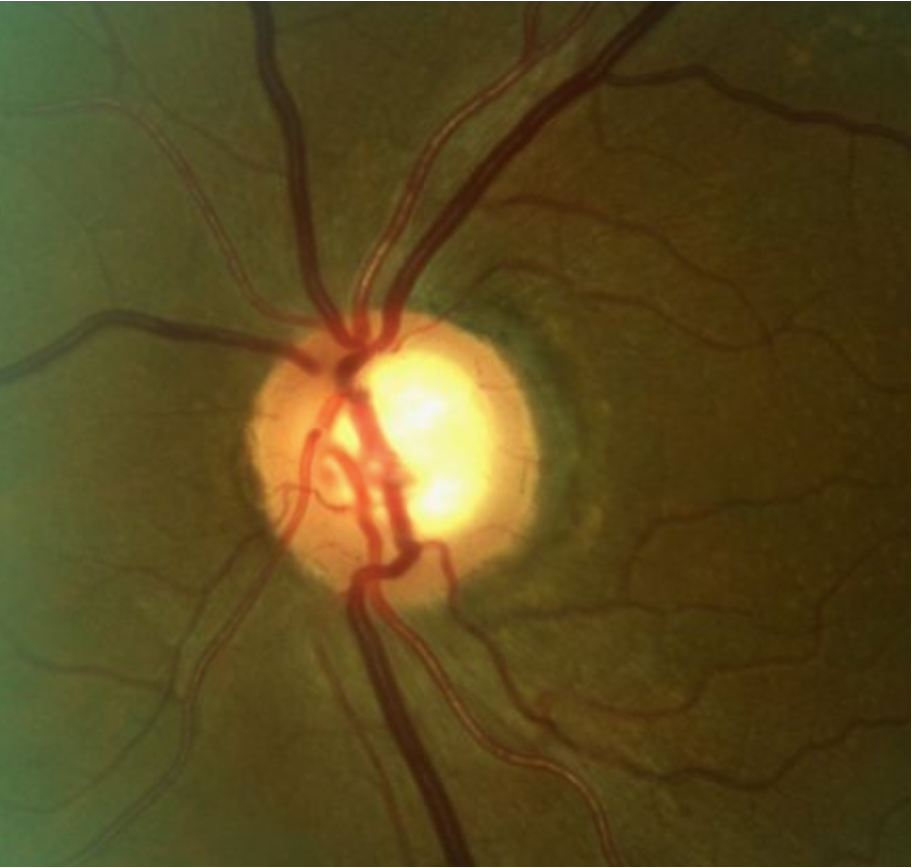
Superior temporal rim erosion and corresponding RNFL thinning in a patient with early POAG. Photo: Andrew Rixon, OD. Click image to enlarge. |
Measuring the cup-to-disc ratio (CDR) is a time-tested, simple method for disease assessment in glaucoma suspects and those early in the disease course. For a more sophisticated staging, glaucoma guru George Spaeth, MD, developed the Disc Damage Likelihood Scale (DDLS) over 20 years ago. Do these systems also work in late-stage disease? A recent post-hoc analysis says yes.
The study, published in British Journal of Ophthalmology, evaluated 382 eyes (201 participants), of which 51% had severe or end-stage glaucoma; mean IOP was 26.7mm Hg. The DDLS was determined by locating the thinnest neuroretinal rim and, if still present, calculating the rim-to-disc ratio or, if absent, estimating the circumferential extension of the absence of neuroretinal rim tissue in degrees. After measuring the disc diameter, the DDLS score was established accordingly. To determine the CDR, the vertical and horizontal cup diameters were related to the respective disc diameter.
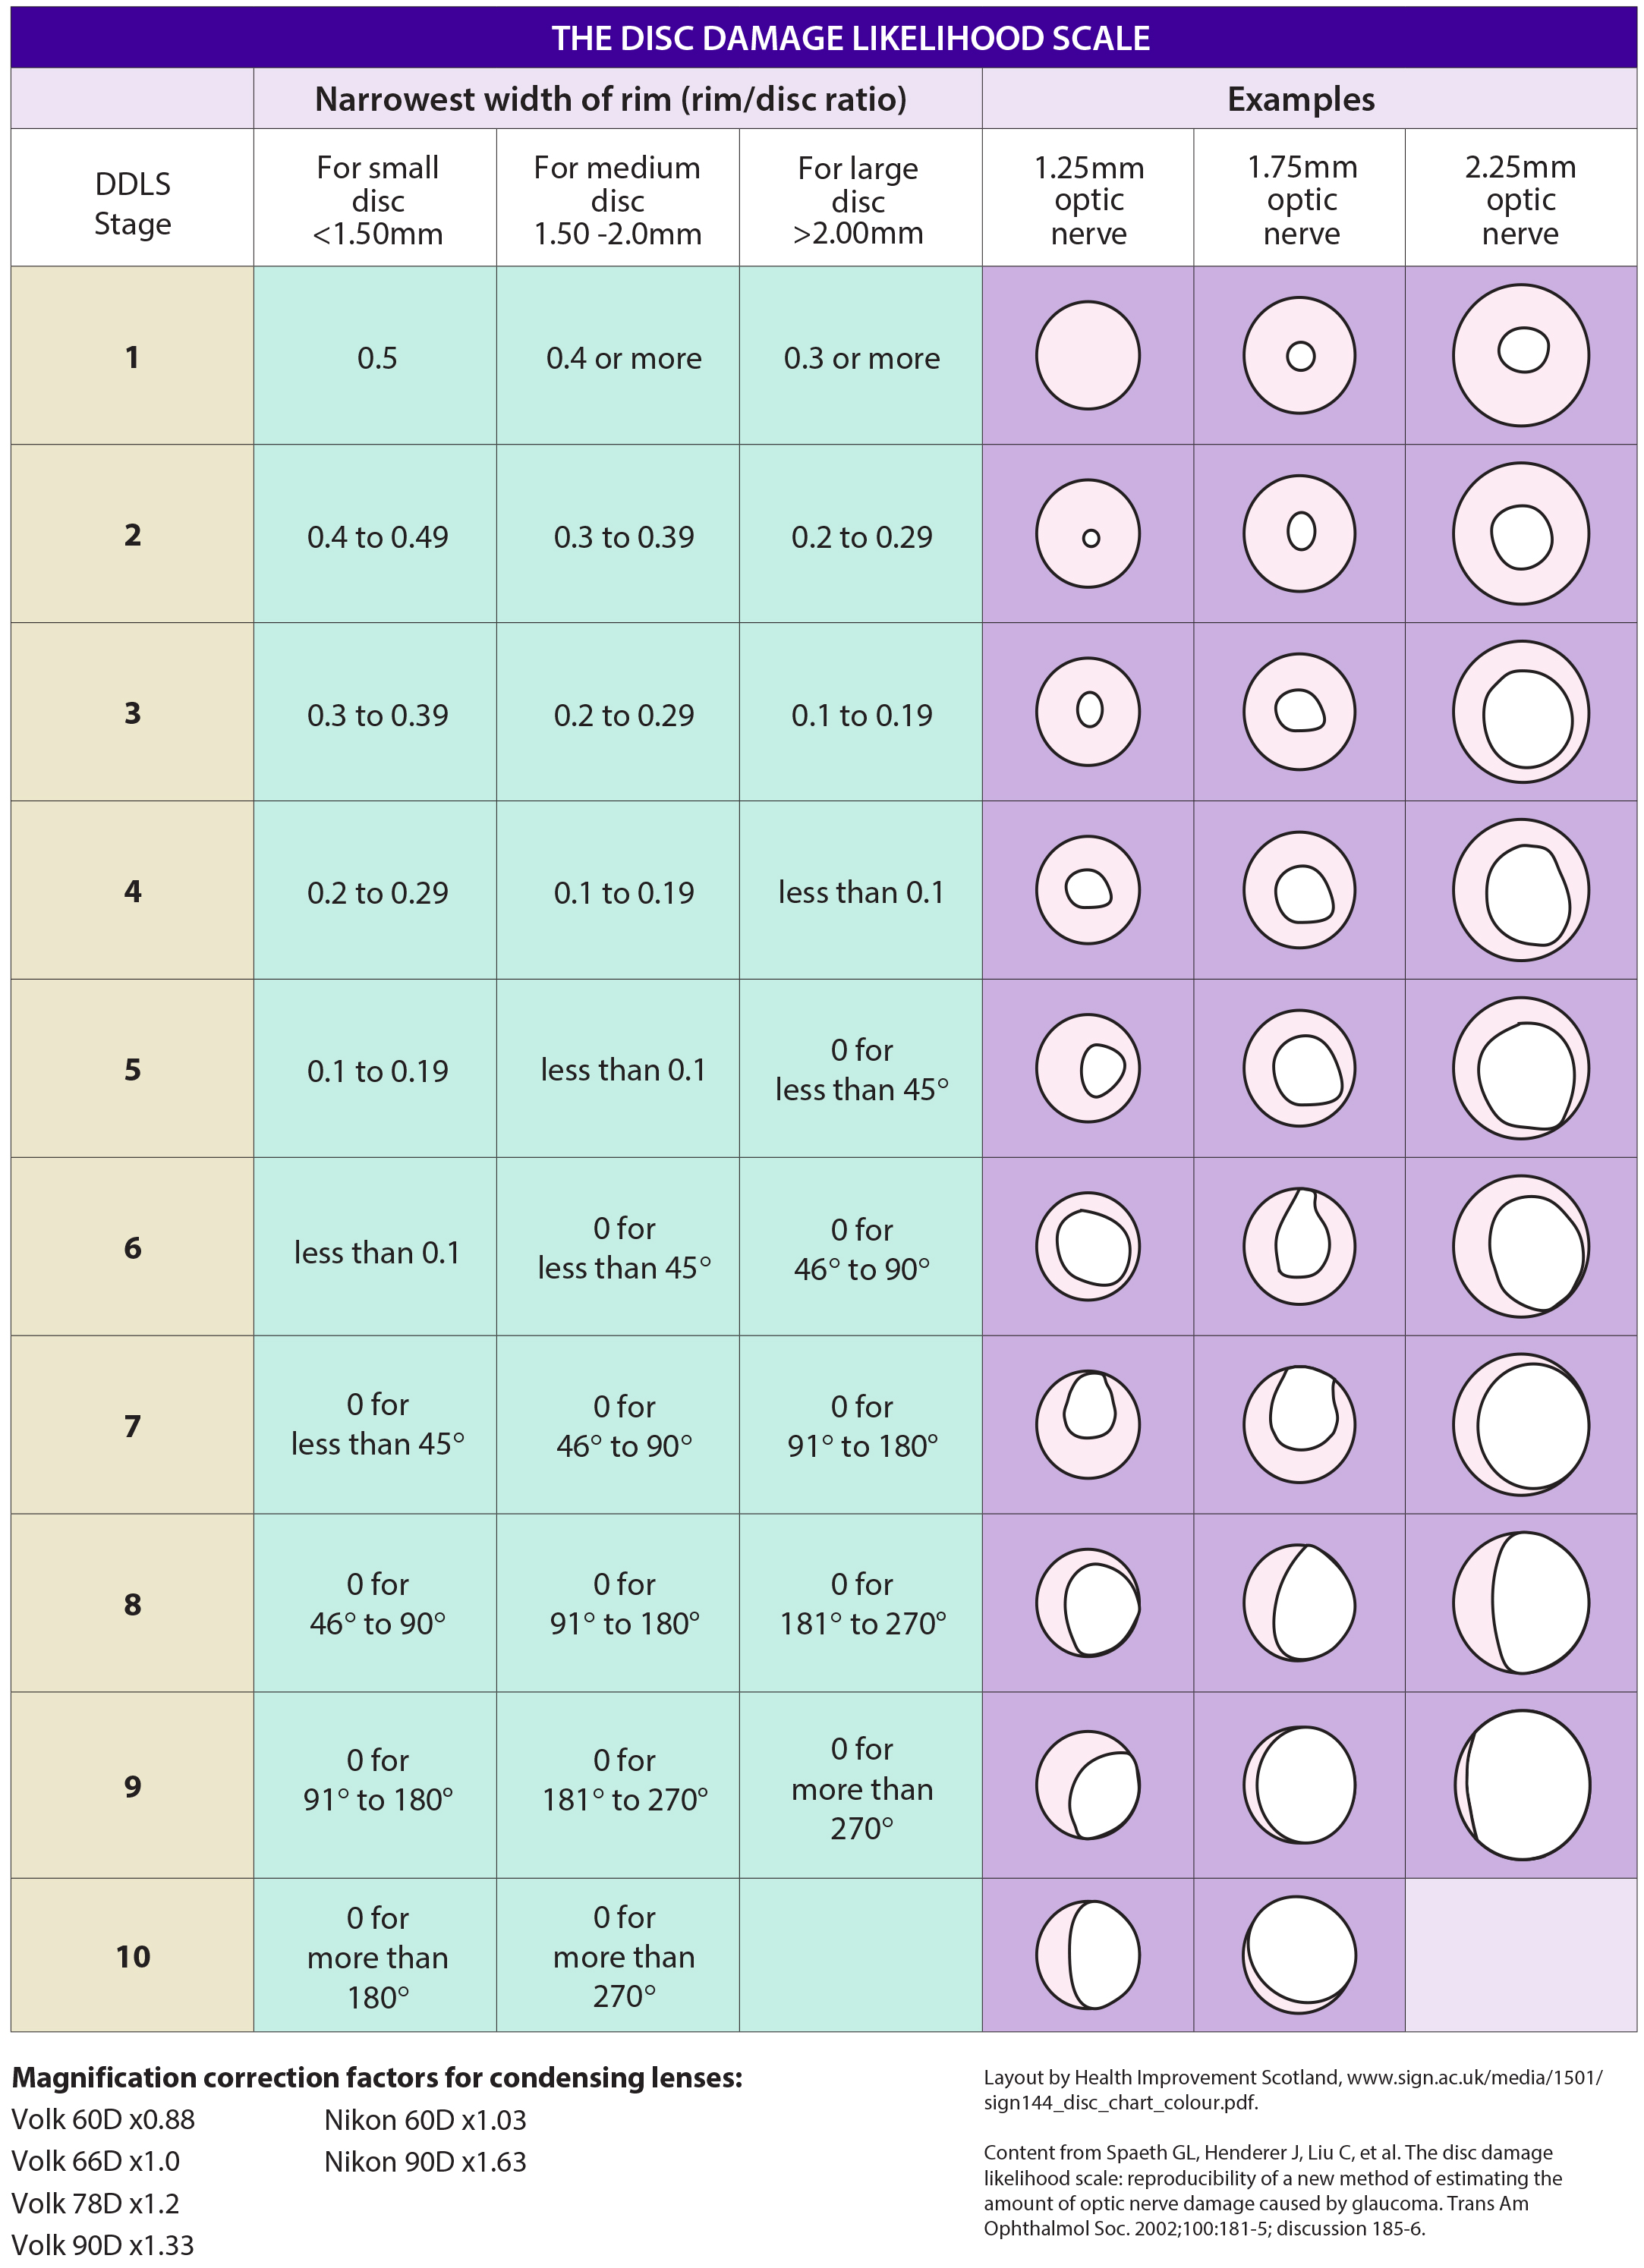 |
| This form helps clinicians stage glaucoma based on assessment of the optic disc. Feel free to download it and use it in your practice. The DDLS score is based on the narrowest radial neuroretinal rim width. As the rim width also depends on the disc size, the DDLS score should be increased by 1 for small discs (<1.50 mm) and decreased by 1 for large discs (>2.00 mm). Click image to enlarge. |
The Disc Damage Likelihood Scale yielded an area under the curve—a statistical measure of predictive ability—of 0.90 for identifying severe/end-stage disease, and vertical CDR yielded an area of 0.88. Correlation coefficients comparing functional glaucoma staging systems to the DDLS and vertical CDR were 0.73 and 0.71, respectively. Advanced structural stages, vision impairment, higher intraocular pressure and fewer financial resources were risk factors of functional severe/end-stage glaucoma.
“The Disc Damage Likelihood Scale and CDR are low-cost and feasible methods for describing and discriminating structural stages related to functionally mild/moderate/advanced glaucoma vs. severe/end-stage glaucoma,” the researchers wrote in their paper. “The Disc Damage Likelihood Scale may be advantageous over the CDR due to the slightly larger area under the receiver operating characteristic curve, having more categories to differentiate advanced glaucoma and a better fitting description of the course of glaucomatous optic disc damage.”
According to the team, the two systems can be implemented with affordable equipment without a need for complex technology and when a visual field examination cannot be performed; for example, in patients with severe or end-stage glaucoma or a strong fatigue effect or in young children. Both can play an important role in the assessment of advanced glaucoma damage and progression and help clinicians with treatment decisions to prevent further visual disability.
Philippin H, Matayan EN, Knoll KM, et al. Differentiating stages of functional vision loss from glaucoma using the Disc Damage Likelihood Scale and cup:disc ratio. Br J Ophthalmol. January 18, 2023. [Epub ahead of print]. |