 |
The measurement of visual acuity is the cornerstone of optometry. We do it with every patient at nearly every visit, and it has remained relatively unchanged since Herman Snellen, MD, invented his namesake chart in 1862. Many different types of optotypes have been invented and used since, both clinically and for research purposes, but the procedure has remained the same: we put something up for the patient to see and ask them to tell us what they see.
 |
|
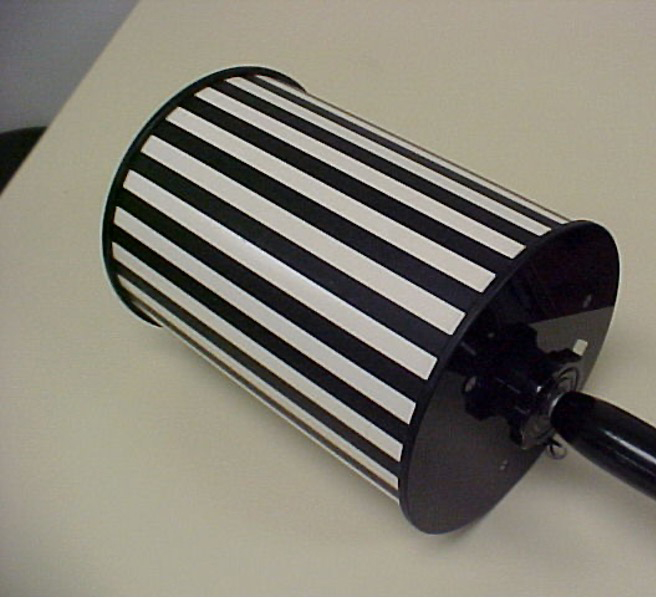
Fig. 1. The drum doesn’t offer the best measurement of visual acuity. Click image to enlarge. |
A good deal of time is spent getting these measurements, and they involve the use of language, either by speaking or signing of some sort, such as when a patient points in the direction of the tumbling “E” or the opening in a Landolt “C.” In some instances, such as with the HOTV chart or with Lea symbols, the patient may be given a card with the symbols, only requiring them to touch the symbol on the card to indicate which one they can visualize on the wall down at the end of the room. We don’t always know if the measure we got was accurate, yet a lot is riding on the measurement.
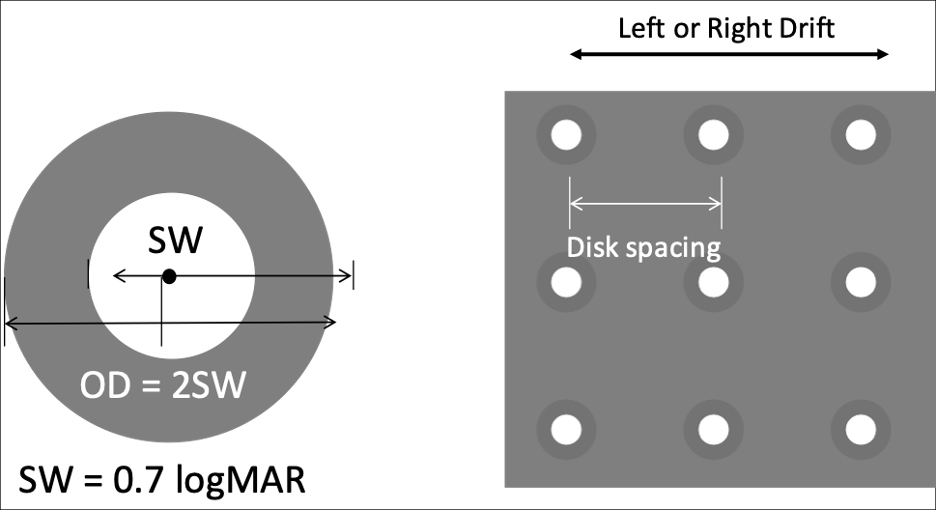 |
Fig. 2. A grid of these targets moves across the screen to determine if a patient is able to track their movement. Click image to enlarge. |
Up and Coming
In our sixth floor lab at Southern College of Optometry (SCO), we have worked on several innovations in the measurement of visual acuity, including seminal work on the Dyop invented by Allen Hytowitz, continuously variable size optotype testing for M&S Technologies, validation of the automated electronic ETDRS test and others. However, a new method of testing visual acuity based on an idea, patented by Ben Thompson, PhD, and Jason Turuwhenua, PhD, and developed by Objective Acuity based in New Zealand, is poised to dramatically change how we measure visual acuity. We have conducted two experimental protocols to date using this new technology, with a final protocol in the works before we move the device into the clinic.
Disclosure: Objective Acuity has funded research protocols at SCO, but neither columnist is a paid employee or consultant for the company, nor has any financial interest in it.
 |
|
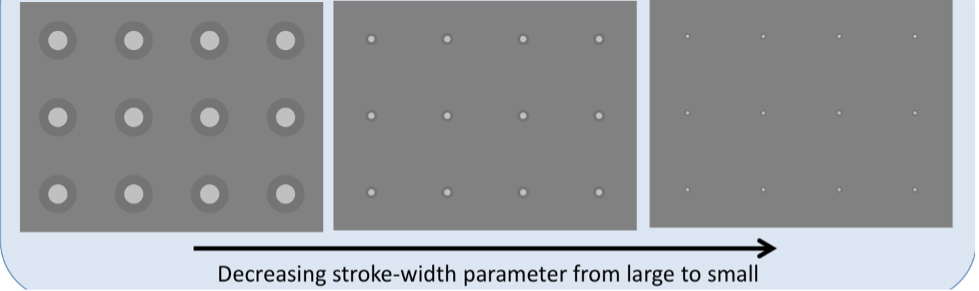
Fig. 3. These three varying sizes of targets all appear with the same distance between them. Click image to enlarge. |
The test is based on optokinetic nystagmus. When you read that, you probably think of the drum (Figure 1). The drum is clunky, scares many of our patients and, besides being difficult to use, doesn’t do a good job pinpointing visual acuity. At best, when the patient doesn’t just look at our face as it pops out from behind the drum, we know that they are following the lines. But most drums have lines that are far too wide to be of much use beyond saying that, indeed, the patient can see them.
Drs. Thompson and Turuwhenua’s idea was to use a different type of target (Figure 2). Against a neutral gray background, the center white circle, with the darker ring around it, has the same overall luminance as the background. A grid of these targets moves either left or right across the screen and a camera focuses on the eyes to see if they are tracking the moving targets. There are several different-sized targets, all with the same spacing between them (Figure 3).
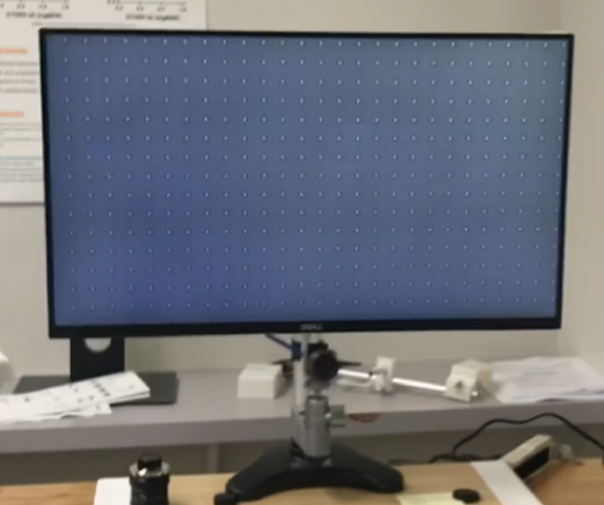
At the 2019 ARVO meeting, we presented our results in a poster titled, “Visual Acuity Assessment in Adults Using Optokinetic Nystagmus,” which demonstrated a very tight relationship between the size of the targets and visual acuity.1 The system we used for this study was not automated and required the lights to be turned off because it used infrared light to light up the retinal reflex to see the eye movements. Our second study was conducted with an apparatus that now does the analysis in real time, can be done with the lights on and is very fast (Figure 4).
 |
|
Fig. 4. This is the current configuration of the device we’ve been looking into as it relates to visual acuity measurement. Click image to enlarge. |
This improved method begins by showing moving targets to the patient at the equivalent size for 20/125 for five seconds. If the patient’s eye movements indicate the targets were followed, the next size presented is 20/63. If the program did not register target tracking, the moving targets jump up to 20/250. The pattern continues until an appropriate threshold has been determined. This usually takes between 35 and 50 seconds, and the visual acuity equivalent is displayed on the iPad used to control the test.
A recently conducted study that has not yet been published included 99 subjects (198 eyes) at SCO and found that the measurements were correlated between this system and ETDRS charts, with a 95% confidence interval ranging from 0.71 to 0.86. This has become our go-to test for non-verbal patients. Once it moves into the clinic, we will begin using it with children of all ages.
This system is not yet commercially available but should be a technology that is licensed to many different vendors of visual acuity testing platforms. When optometrists around the world can get accurate visual acuity measures with or without lenses over a range of 20/10 to 20/2000 in under a minute without having to have the patient do anything other than look at a screen, the bedrock measure of visual performance we all use to measure the efficacy of our treatments will rise to a new level of sophistication and help shed the yoke of Snellen’s initial invention.
Dr. Taub is a professor, chief of the Vision Therapy and Rehabilitation service and co-supervisor of the Vision Therapy and Pediatrics residency at Southern College of Optometry (SCO) in Memphis. He specializes in vision therapy, pediatrics and brain injury.
Dr. Harris is also a professor at SCO. Previously, he was in private practice in Baltimore for 30 years. His interests are in behavioral vision care, vision therapy, pediatrics, brain injury and electrodiagnostics. They have no financial interests to disclose.
1. Harris PA, Garner T, Sangi, M. et al. Visual acuity assessment in adults using optokinetic nystagmus. Invest Ophthalmol Vis Sci. 2019;60:5907. |
