Automated perimetry is a critical tool in the diagnosis and follow-up care of glaucoma patients. While advancements in imaging technology (OCT) have improved our ability to evaluate structural damage, perimetry remains the primary method to evaluate visual function in glaucoma. Ultimately, the primary goal of glaucoma therapy is to maintain the patient’s visual function throughout their lifetime, so a thorough understanding of perimetry is paramount.
The article provides a simple framework for the interpretation of the standard glaucoma visual field (VF) printout, presents new testing strategies and discusses detection of progressive field loss in the glaucoma patient.
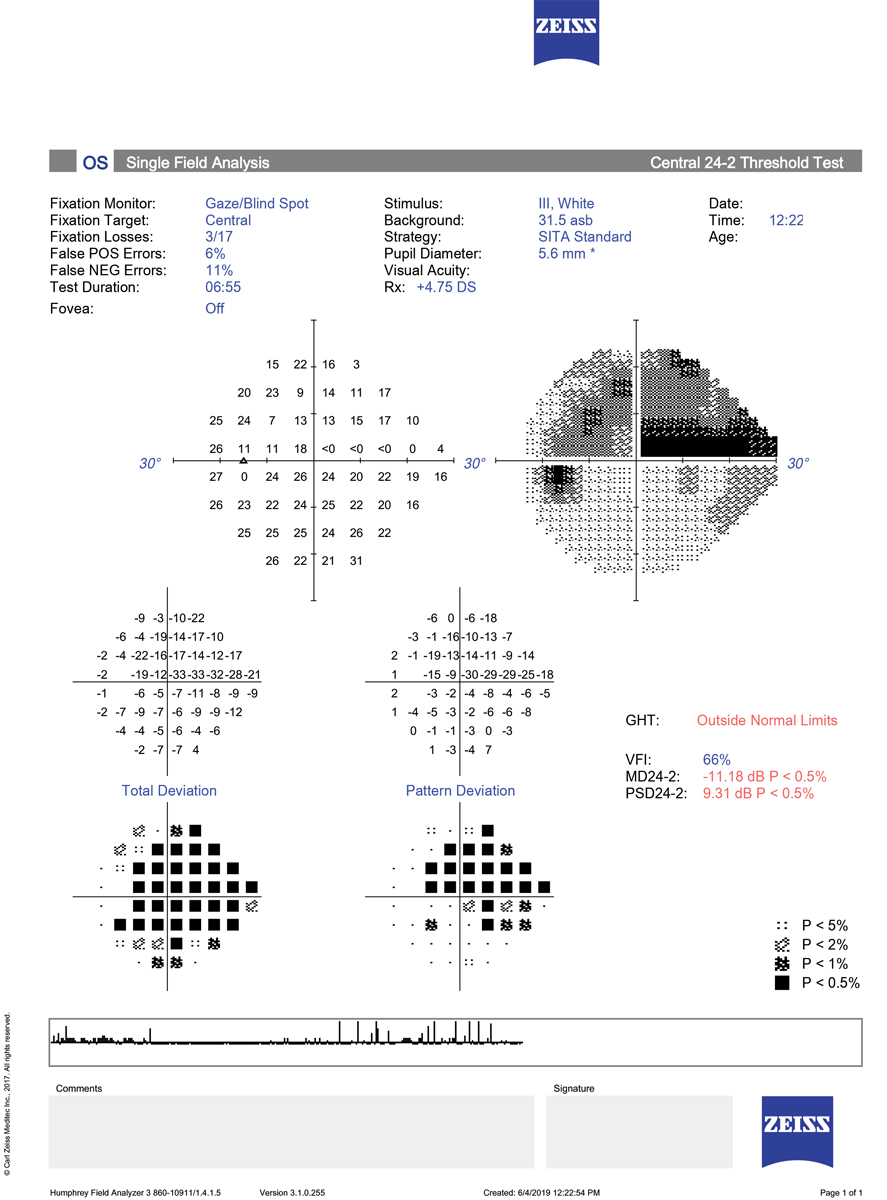 |
There are three points to keep in mind when interpreting this 24-2 SITA Standard printout: 1. The test is reliable, without excessive fixation losses, false positive or false negative errors. 2. The total deviation plot reveals highly significant depression over nearly the entire field. When adjusting for this overall depression, which was due to cataract, the pattern deviation plot shows a large, dense superior arcuate defect with a smaller inferior nasal step. This pattern of loss is characteristic of glaucoma. 3. The GHT is outside normal limits due to the significant difference between the superior and inferior hemifield values; the MD and PSD are both highly abnormal. Click image to enlarge. |
The Basics of VF Interpretation
The amount of data presented on the standard VF printout can seem overwhelming to the busy clinician. A systematic approach is helpful to simplify and speed up the review process. Two excellent publications to consider for more extensive information include The Field Analyzer Primer: Effective Perimetry for the Humphrey Field Analyzer (HFA; Zeiss) and Visual Field Digest for the Octopus perimeter (Haag-Streit).1,2 A three-step strategy for interpretation of the visual field includes assessing reliability, examining the field for specific glaucomatous defects and evaluating the global indices.
Establishing the reliability of the field is the first step in the review process. Historically, three measures of reliability have been considered: fixation losses, false negatives and false positives. Fixation losses are estimated by periodically presenting a stimulus in the blind spot. If the patient responds to the stimulus, the assumption is that the patient was not looking straight ahead. However, excessive fixation losses may occur for a variety of reasons, including a mis-plotted blind spot. The gaze tracker, which tracks eye movement throughout the test, has largely replaced fixation losses as an indicator of reliability.
False negative responses are meant to measure poor attention to the test. A false negative response occurs when a patient does not respond to a stimulus that should be easily visible. False negatives, however, are known to worsen with advancing disease and are no longer considered a good measure of reliability. The one reliability indicator that should never be ignored is the false positive rate.
False positives occur when the patient responds when no stimulus has actually been seen. A high number of false positive responses will make a field look better than it actually is and may mask shallow depressions. A false positive rate of 15% or more indicates an unreliable test that should be repeated.
The second step in evaluating the field is to look for defects consistent with glaucoma. Although the gray scale is not appropriate for decision-making, it can quickly draw attention to areas that need further evaluation. The deviation plots identify areas of reduced sensitivity. The total deviation plot identifies abnormal points compared with an age-matched normative database. The information is presented both in decibels and in statistical probability maps, where darker symbols represent increasing significance.
The pattern deviation plot shows the remaining problem areas after adjusting for any generalized loss that might be due to cataract or other media problems, uncorrected refractive error or small pupils. The pattern deviation plot is arguably the most important part of the field printout because it highlights areas of localized loss that are common in glaucoma.
The clinician should look for clusters of abnormal points in areas that are typical of glaucoma: nasal step, arcuate bundle and paracentral defects that respect the horizontal midline. Remember that a single point that is statistically abnormal may not be clinically relevant, but a cluster of flagged points more likely indicates real loss.
The third step is to evaluate the Glaucoma Hemifield Test (GHT) and global indices. The GHT highlights how glaucoma damages superior and inferior fields asymmetrically. The GHT compares mirror image clusters of points above and below the horizontal midline to look for significant differences. A GHT message of “outside normal limits” that is repeatable is strong evidence of glaucoma and is a stand-alone criteria for diagnosing acquired glaucomatous damage according to the Hodapp-Parrish-Anderson criteria.3
 |
|
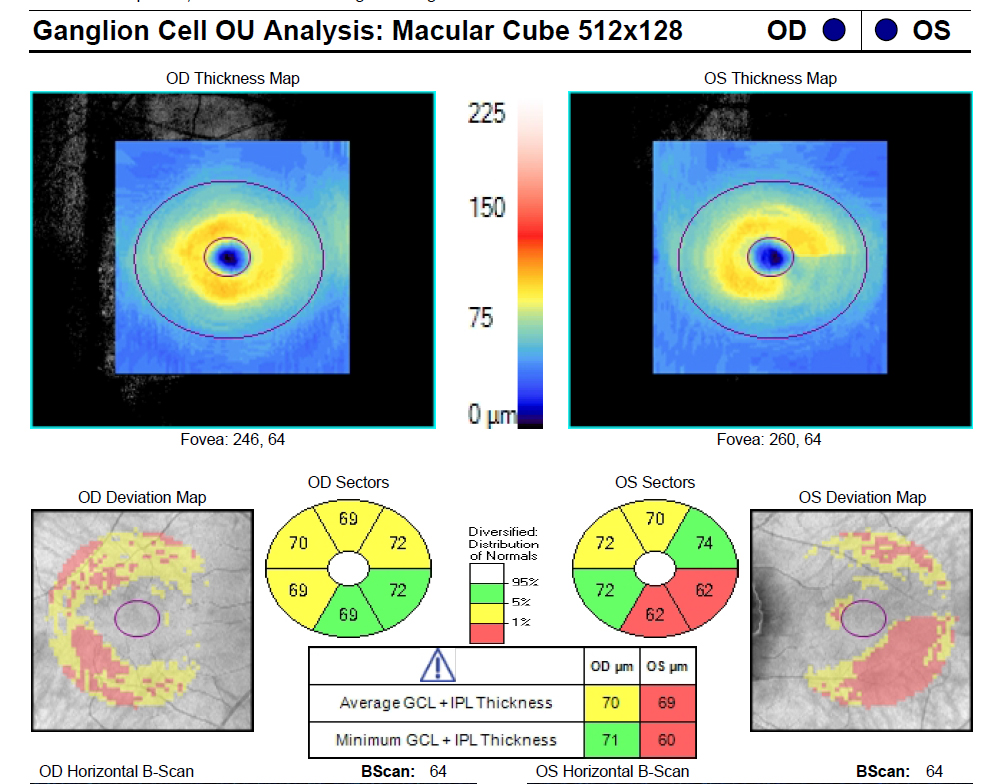
The patient shows the classic ganglion cell–inner plexiform layer thinning in the inferotemporal sector of the macula of the left eye. Click image to enlarge. |
The global indices of the Humphrey field include mean deviation (MD) and pattern standard deviation (PSD). Analogous measures on the Octopus perimeter are mean defect and loss variance. The MD measures the difference between the patient’s sensitivity and that of age-matched normal values, averaged across the entire field. The MD is significantly impacted by cataract and other media problems as well as uncorrected refractive error, and it is insensitive to small, shallow localized defects that often occur in early glaucoma.
The PSD reflects the shape or “smoothness” of the hill of vision and is more reflective of the localized defects that occur in glaucoma. Both the MD and PSD values will display an alert when they reach statistical significance. The Visual Field Index (VFI) is a newer metric on the HFA that is similar to the MD but weighs the central points more heavily than peripheral points and is less sensitive to cataract because it is derived from the PSD data. The VFI ranges from 100% (normal field) to 0% (perimetrically blind).
Which Test Should I Run?
Standard automated perimetry (SAP) remains the primary perimetry method for glaucoma diagnosis and follow-up. The standard test pattern for glaucoma testing is the 24-2. Swedish Interactive Thresholding Algorithm (SITA) testing was quickly adopted when introduced on the HFA because it allows for more rapid testing compared with the original thresholding algorithm.
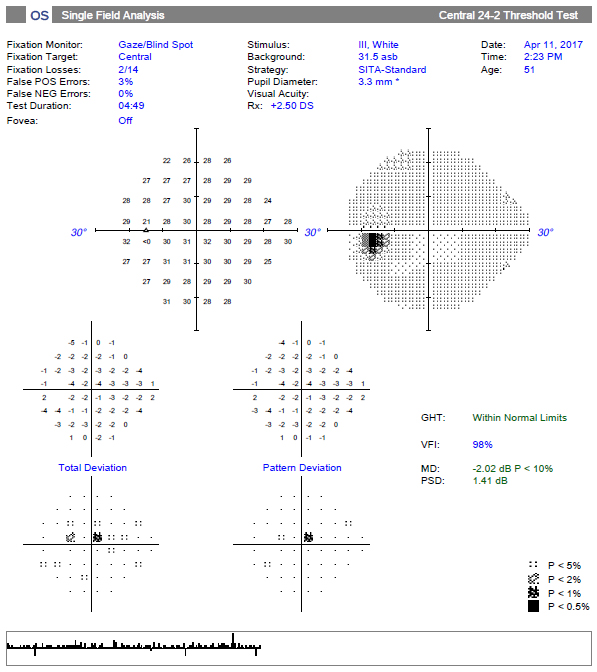 |
| The 24-2 SITA Standard reveals a single significant superior paracentral defect and a “within normal limits” message on the GHT. Although the point is statistically significant, it might be overlooked. Click image to enlarge. |
While the 24-2 SITA Standard or SITA Fast are the most commonly used tests for glaucoma, there have been two recent shifts in field testing: the development of an even faster test and more attention to the central 10° of the field.
SITA Faster. SITA Standard and Fast testing have both been shown to be accurate, repeatable tests. While early reports showed that SITA Standard testing had better repeatability than SITA Fast, more recent studies have shown the two perform very similarly in a clinical setting and both are reasonable strategies to use.4-7 The newest thresholding algorithm on the HFA is the SITA Faster, which is roughly 50% quicker than the SITA Standard and approximately 30% faster than the SITA Fast.
This time-saving is achieved by modest modifications in the initial threshold value selection, by removing unnecessary delays between stimuli presentation and by removing both the blind spot and false negative catch trials. Reliability is now based on the gaze tracker and false positive trials only. These modifications have been shown to give nearly identical results as SITA Fast testing.8 However, the SITA Faster may have a higher number of unreliable tests compared with the SITA Standard test.9 Alert patients switching from the SITA Standard or Fast to the SITA Faster that the stimuli will be presented more rapidly. SITA Faster testing is available only on the HFA3.
Emphasis on the Central 10°. In large part due to improved imaging techniques with OCT, an increasing amount of attention over the past decade has been focused on damage to the macula in glaucoma, which can happen in early stages. One of the most comprehensive reports of macular damage in glaucoma reported that the 24-2 test grid may miss or underestimate the amount of functional damage to the central portion of the visual field due to the 6° separation between test points and poor sampling in the area of most dense retinal ganglion cell population.10 The 10-2 test grid spaces test points 2° apart and provides much better sampling across the macula.
 |
|
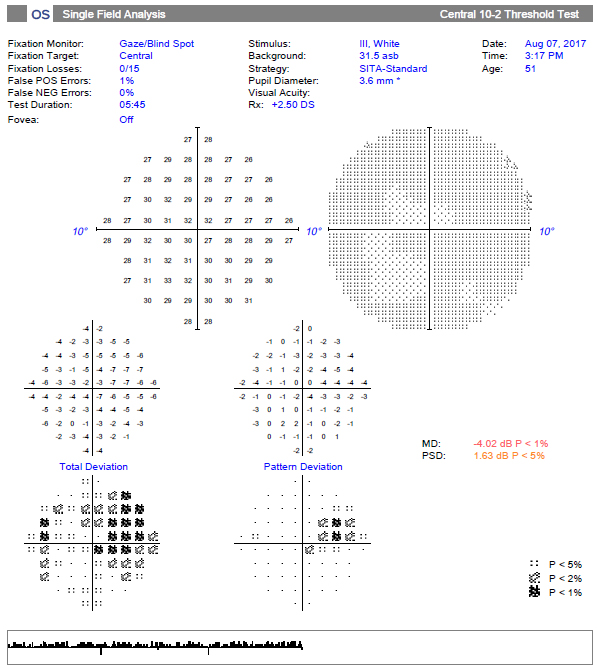
The 10-2 test grid of the same patient reveals a much more substantial superior nasal defect that correlates to the inferotemporal macular damage. Click image to enlarge. |
The 10-2 has been shown to identify central visual field defects in patients whose 24-2 test would otherwise be considered normal.11-13 This has prompted some to recommend adding the 10-2 VF to the glaucoma diagnostic protocol. However, another study showed that the large majority of patients with defects on the 10-2 demonstrated abnormal points in the central 10º on the 24-2 test.14
It is likely unnecessary to obtain a 10-2 on all glaucoma patients and suspects. While there is no current standard guideline for using the 10-2 in early glaucoma, it seems prudent to obtain a 10-2 on any patient who shows characteristic macular ganglion cell thinning on OCT or one or more abnormal points in the central 10º of a 24-2 test.15 The clinician should evaluate the central points of a 24-2 carefully, as a single depressed point (rather than the customary cluster of points) may be significant.
24-2C. This is a new test pattern on the HFA that adds 10 test points within the central 10º to the 24-2 test grid (five in the superior and five in the inferior hemifield). Test points were chosen by an expert group and were based on areas known to be susceptible to glaucoma damage from structural and functional studies. Not surprisingly, the 24-2C has been shown to identify more central defects and have better structure-function correlation than the 24-2.16
The 24-2C test, somewhat of a “hybrid” between the 24-2 and the 10-2, may represent a reasonable balance of testing the central points while avoiding the necessity of performing both 10-2 and 24-2 tests in early glaucoma diagnosis. It uses the SITA Faster algorithm and is available on the HFA3.
Tips For Getting The Best Visual Field PossibleBy correctly setting up the perimeter, appropriately explaining the test to the patient, carefully positioning the patient and providing encouragement throughout the test, your technician plays a key role in obtaining the best possible results. Here are some important steps to obtain good results.1,2Correctly set up the perimeter:
Correctly prepare the patient:
Correctly instruct the patient:
|
Detecting VF Progression
Once the diagnosis of glaucoma has been made, or a patient is identified as a glaucoma suspect, the focus shifts to detecting progression. Information about functional progression is paramount in determining which patients need escalation of therapy and which are being adequately controlled with their current therapy. Unfortunately, the inherent variability of visual fields makes distinguishing between normal fluctuation and real change quite difficult at times.
The frequency of visual field testing is an important consideration. Enough tests must be performed to overcome the inherent test-retest variability in order to detect true change. Several studies, using simulated and real patient data, have demonstrated that obtaining more frequent testing allows for earlier detection of progression.17-19 It is estimated, for example, that it would take at least five years to detect a rapidly progressing (-2dB/year) field if testing is done only once per year and could take much longer if the patient has highly variable fields.20
That same progression could be detected in under two years if testing is done three times per year. Serial visual fields are challenging in terms of patient flow and costs, and a compromise between adequate detection of progression and the burden of running more tests must be struck.
A common strategy to rule out rapidly progressing visual fields is to obtain six visual fields within the first two years. This can be accomplished with two baseline tests in quick succession, followed by semi-annual testing, with repeat tests if needed to confirm suspected progression. If minimal progression is observed in the first few years of follow-up, tests may be done less often.
Many clinicians use manual subjective review of serial fields in order to detect progression. The problem with this method is that it uses non-standard criteria for decision-making. Studies have shown that the agreement among even expert clinicians is poor to fair when using subjective judgment of fields.21,22 The use of progression software substantially improves that.
Progression software evaluates serial fields by two different methods, event-based and trend-based analysis. Event-based analysis compares the current examination with a reference or baseline examination. In a sense, event analysis answers a yes/no question: Is today’s test worse than the baseline? In event-based analysis, a symbol is displayed when a point is worse than baseline and exceeds the expected test-retest variability.
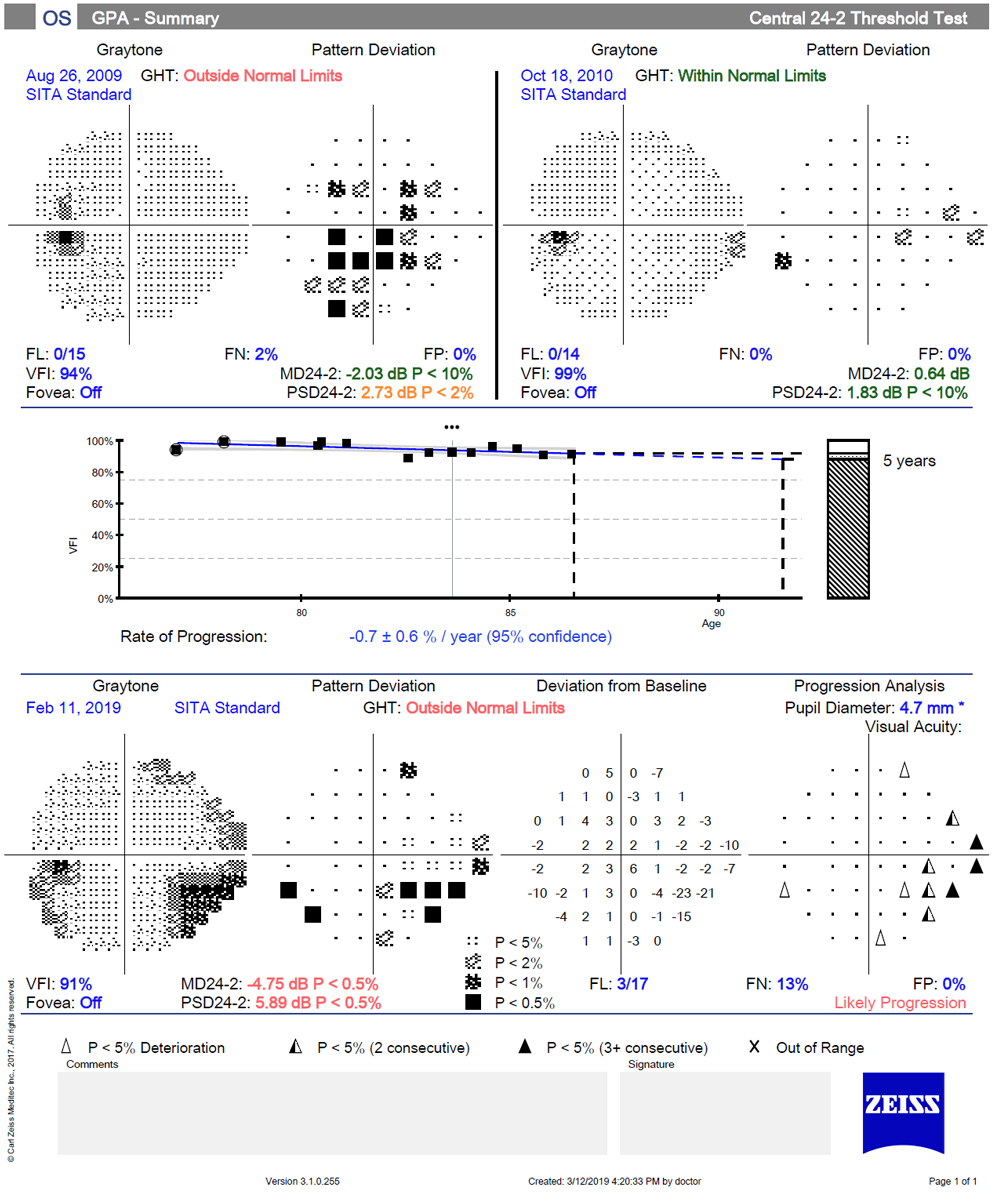
In the Guided Progression Analysis (GPA) for the HFA, a message of “possible progression” is displayed if three or more points have been flagged on two consecutive tests; a stronger message of “likely progression” is displayed when that has occurred on three consecutive tests. A benefit of event-based analysis is that it can be used earlier in the care of a patient because it does not require as many exams as trend-based analysis. Therefore, it may allow earlier detection of progression. In addition, because event analysis is based on the pattern deviation values, it emphasizes localized loss that is common in glaucoma and is less influenced by advancing cataract or other cause of overall depression.
 |
|
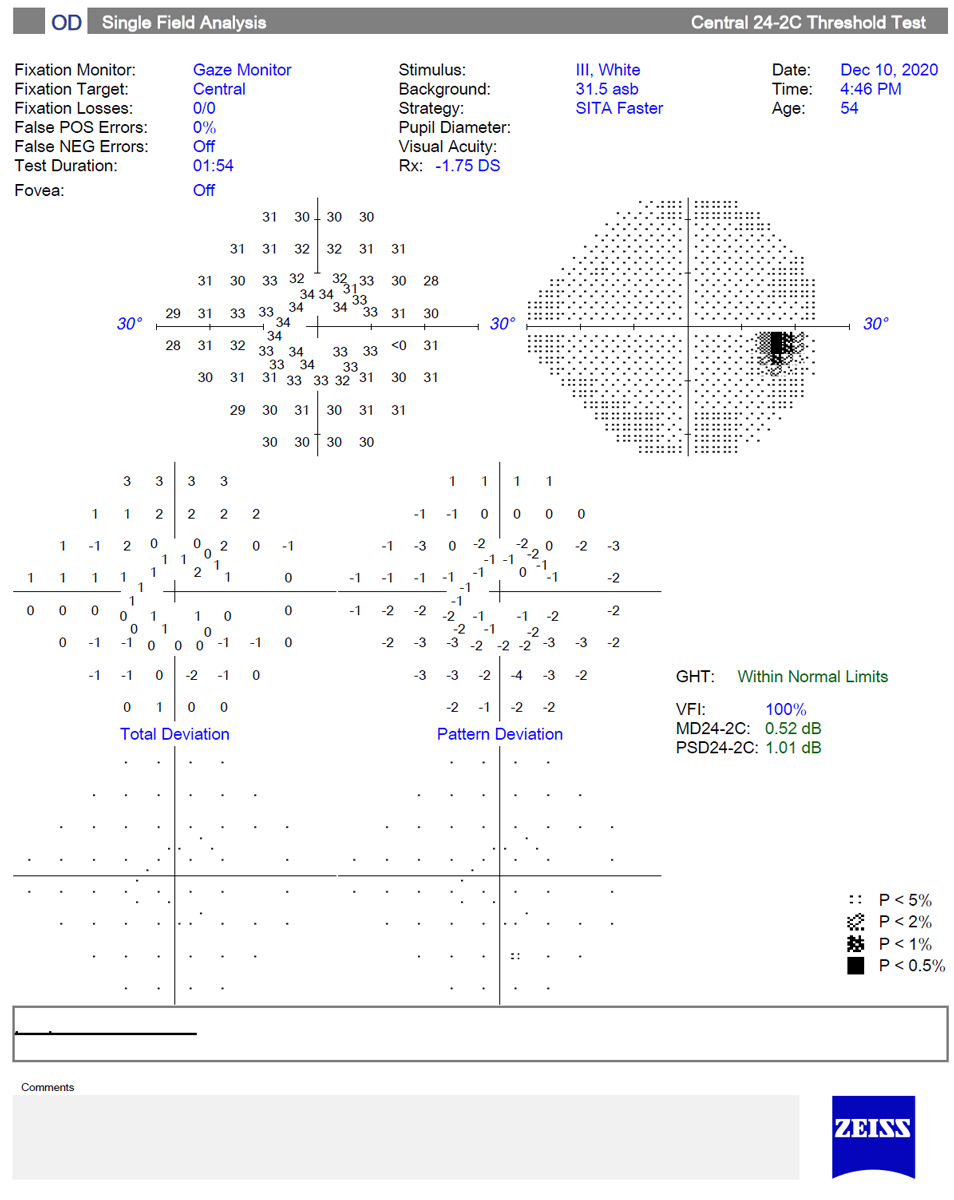
This image shows a normal 24-2C SITA Faster test, which adds 10 additional test points to the central 10º of the 24-2 test grid. The SITA Faster strategy allows for very rapid testing; this test was completed in less than two minutes. Click image to enlarge. |
A disadvantage of event-based analysis is that it is unable to detect progression for severely depressed points. To maximize event-based analysis, the two baseline exams must be reliable and appropriate for comparison; the instrument will default to the first two reliable exams, but if there is an apparent improvement due to the learning curve, reset the baseline to more appropriate tests.
It is also important to understand the nature of progressive changes in glaucoma. The most common form of progression is deepening of an existing scotoma, followed by enlargement of an existing scotoma.22 When a message of possible or likely progression is displayed, the clinician should evaluate where the flagged points are. Progressing points within or adjacent to an existing scotoma are much more likely to represent true change than points with no spatial relation to the existing field loss; likewise, clusters of points are more likely to be true progression than random, isolated points.
Trend-based analysis is used to quantify the rate of change by creating a linear regression of a given metric with time. This type of analysis allows for the discrimination between subtle, slow change and a patient who has considerable test-retest variability.22 The GPA software uses the VFI to quantify the rate of change; however, it also evaluates the MD over time in other programs. Trend-based analysis has been shown to have a higher sensitivity than event analysis, but it requires more tests to detect change. Because trend analysis is evaluating overall or global loss, it may miss subtle localized progression. This may be particularly true in the early stages of the disease.
In practice, both event- and trend- based analysis are useful in evaluating progression of visual fields. They tell us different things about the patient: whether or not the patient progressed (event) and at what rate (trend). The two methods will not always agree. One study looking at agreement between expert consensus, event analysis and trend analysis found only moderate agreement between the two.23 Early in the course of the follow-up, event analysis is the main focus; later in the process, trend analysis may take on a more important role.
Finally, the fact that a field has reached an “event” (shown progression) does not necessarily dictate a change in the patient’s therapy. Consider these things before amplifying a patient’s therapy. How long did it take for the progression to occur? What is the patient’s life expectancy? Where is the field progressing (central vs. peripheral)? Is the progression likely to have a meaningful impact on the patient’s functional vision? What is the impact of the “next step” in amplification of therapy?
These considerations fall outside the scope of this article but only emphasize that progression software provides the clinician statistical analysis of serial visual fields. Remember that clinical decisions are based on more than statistical information.
 |
|
These are VFs performed over 10-year-period in a patient with pseudoexfoliation glaucoma. Event-based analysis shows a message of “likely progression” due to multiple points worsening in the inferior nasal quadrant on 3+ consecutive visits. Although event-based analysis clearly shows the development of an inferior partial arcuate defect, trend analysis shows that the rate of change is actually quite slow. Click image to enlarge. |
Home-based Perimetry
In recent years, there has been significant interest in the development of home-based perimeters. A variety of tablet-and headset-based tools are in various stages of development.24-30 This year, M&S Technologies released the Melbourne Rapid Fields (MRF) for both in-office and home-based testing. The tablet-based application has been shown to be comparable with the 24-2 SITA Standard and SITA Fast on the HFA, even on multiple tests performed over the course of six months, with similar accuracy in test-retest variability.28-30
By performing perimetry more frequently, progression can be detected earlier. A simulation study demonstrated that weekly home-based perimetry was able to detect rapid progression in just under a year compared with 2.5 years that it would take with in-office testing every six months.31 Of course, the performance of real patients may not be equivalent to that predicted by a simulation study.
In a study evaluating the adoption and performance of the MRF, glaucoma suspects and stable glaucoma patients were asked to perform the test at home six times at weekly intervals.26 While 88% of subjects were able to perform at least one test, only 69% performed all six tests. Some of the barriers to compliance included technology issues, lack of motivation and competing life demands. Studies evaluating compliance over a longer period of time are needed.
Nevertheless, a tablet-based home testing system is now available and may be appealing in patient populations for whom in-office testing is not desirable or feasible.
Key Clinical Takeaways
Even in an era of rapidly advancing imaging technology, perimetry remains instrumental in the care of the glaucoma patient, as it provides valuable data for functional vision assessment. The clinician must possess a solid understanding of the technology in order to make sound clinical decisions regarding diagnosis and progression of glaucoma. Recent changes in testing strategies, and the introduction of home-based testing, may improve our ability to assess visual function in the clinic and patient acceptance of the test.
Dr. Marrelli is a clinical professor and assistant dean of clinical education at the University of Houston College of Optometry. She is a Diplomate in the disease section of the American Academy of Optometry. She is on the advisory board and participates in speaking engagements for Carl Zeiss Meditec, Ivantis, Aerie Pharmaceuticals, Allergan and Bausch & Lomb.
| 1. Hingwala DR, Kesavadas C, Thomas B, et al. Imaging signs in idiopathic intracranial hypertension: Are these signs seen in secondary intracranial hypertension too?. Ann Indian Acad Neurol. 2013;16(2):229-33. 2. Alnemari A, Mansour TR, Gregory S, et al. Chiari I malformation with underlying pseudotumor cerebri: Poor symptom relief following posterior decompression surgery. Int J Surg Case Rep. 2017;38:136-41. 3. Aiken AH, Hoots JA, Saindane AM, Hudgins PA. Incidence of cerebellar tonsillar ectopia in idiopathic intracranial hypertension: a mimic of the Chiari I malformation. AJNR Am J Neuroradiol. 2012;33(10):1901-06. 4. Malmqvist L, Bursztyn L, Costello F, et al. The Optic Disc Drusen Studies Consortium recommendations for diagnosis of optic disc drusen using optical coherence tomography, J Neuro-Ophthalmol. 2018;38(3):299-307. 5. Tugcu B, Özdemir H. Imaging methods in the diagnosis of optic disc drusen. Turk J Ophthalmol. 2016;46(5):232-36. 6. Palmer E, Gale J, Crowston JG, Wells AP. Optic nerve head drusen: an update. Neuro-Ophthalmol. 2018;42(6):367-84. 7. Kahloun R, Abroug N, Ksiaa I, et al. Infectious optic neuropathies: a clinical update. Eye Brain. 2015;7:59-81. 8. Hedges TR, Flattem NL, Bagga A. Vitreopapillary traction confirmed by optical coherence tomography. Arch Ophthalmol. 2006;124(2):279-81. 9. Gabriel RS, Boisvert CJ, Mehta MC. Review of vitreopapillary traction syndrome. Neuro-ophthalmol. February 26, 202. [Epub ahead of print]. 10. Regillo CD, Brown GC, Savino PJ, et al. Diabetic papillopathy: patient characteristics and fundus findings. Arch Ophthalmol. 1995;113(7):889-95. 11. Sayin N, Kara N, Pekel G. Ocular complications of diabetes mellitus. World J Diabetes. 2015;6(1):92-108. 12. Chen JJ, Kardon RH. Avoiding clinical misinterpretation and artifacts of optical coherence tomography analysis of the optic nerve, retinal nerve fiber layer, and ganglion cell layer. J Neuro-ophthalmol. 2016;36(4):417-38. 13. Vieira LMC, Silva NFA, Dias dos Santos AM, et al. Retinal ganglion cell layer analysis by optical coherence tomography in toxic and nutritional optic neuropathy. J Neuro-ophthalmol. 2015;35(3):242-45. 14. Digre KB, Corbett JJ. Is the disc pale? In: Practical Viewing of the Optic Disc. Amsterdam: Butterworth-Heinemann; 2003:193-200. |
