Interpreting an abnormality on a macular optical coherence tomography (OCT) image can be daunting for practitioners relatively new to OCT. However, with some review and experience under your belt, you can identify what’s wrong on an OCT, correlate this with the clinical exam to make more accurate diagnoses and then begin to get more comfortable managing many of these patients on your own.
Accurate diagnosing will improve with a solid understanding of normal anatomy, then recognition of various patterns of abnormality. To start differentiating various macular abnormalities seen on OCT, it helps to break it into anatomic subsets, then use these groups to create differential diagnoses based on how the scan looks.
 |
|
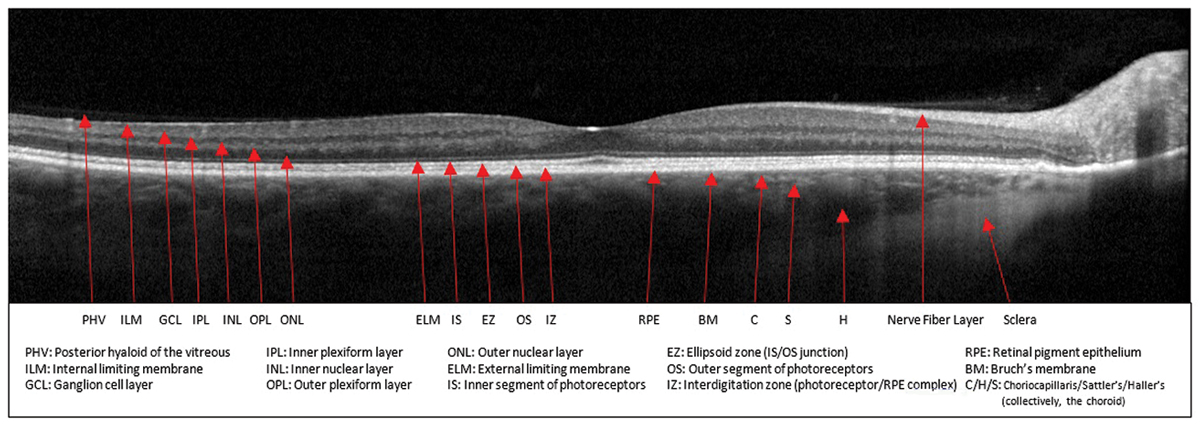
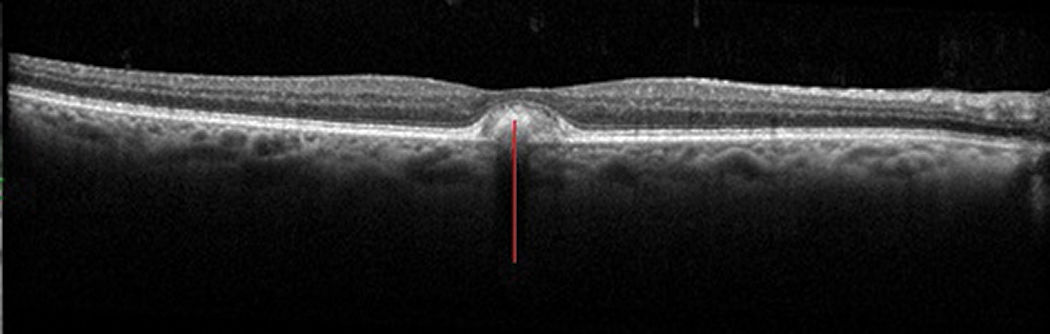
Fig. 1. Normal macular OCT with anatomic structures labeled. Click image to enlarge. |
For this article, we won’t address every conceivable diagnosis. Rather, we’ll focus on critically thinking about each layered zone on a macular OCT scan, review some examples of anomalies and recognize how those abnormalities appear on OCT relative to normal structure. Doing this should enable you to form several reasonable differentials based on the areas affected and better understand what’s happening and how to appropriately manage your patients.
OCT can show you some details you won’t see clinically, yet it’s important to consider OCT scans within the context of the entire clinical picture. Many conditions have similar pathologic features on OCT. For example, subretinal fluid (SRF) due to choroidal neovascularization (CNV) in exudative age-related macular degeneration (AMD) can resemble SRF due to CNV in myopic degeneration. Likewise, a serous macular detachment in central serous chorioretinopathy (CSCR) can look like a serous detachment in polypoidal choroidal vasculopathy (PCV).
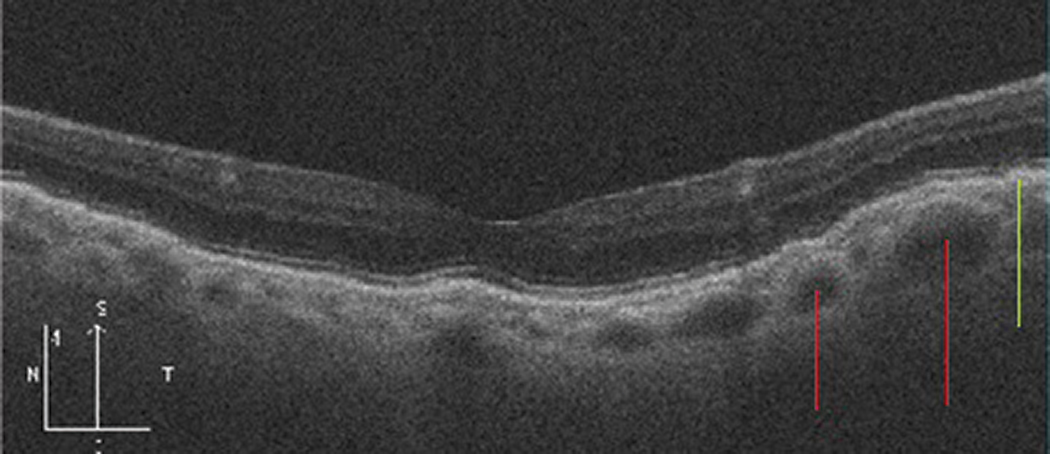 |
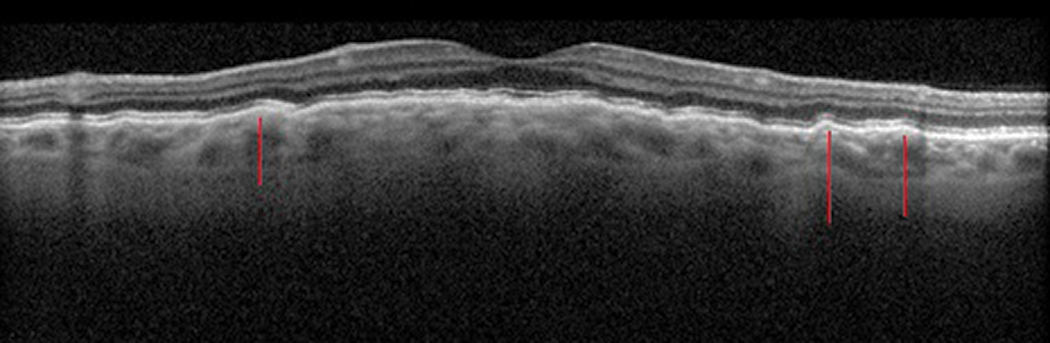
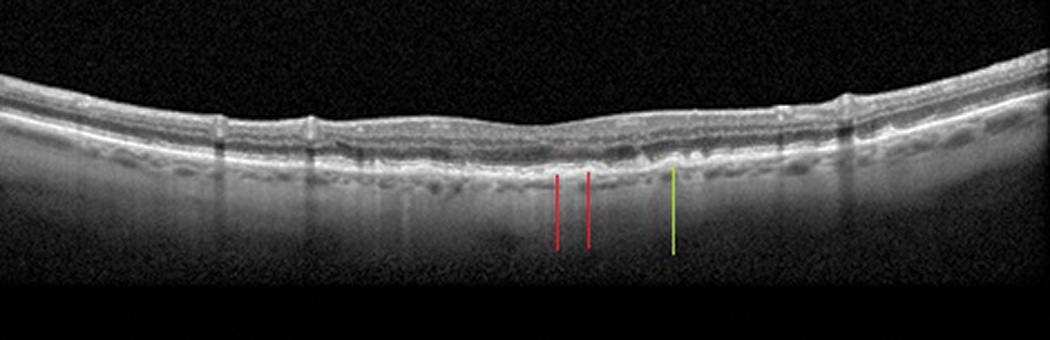
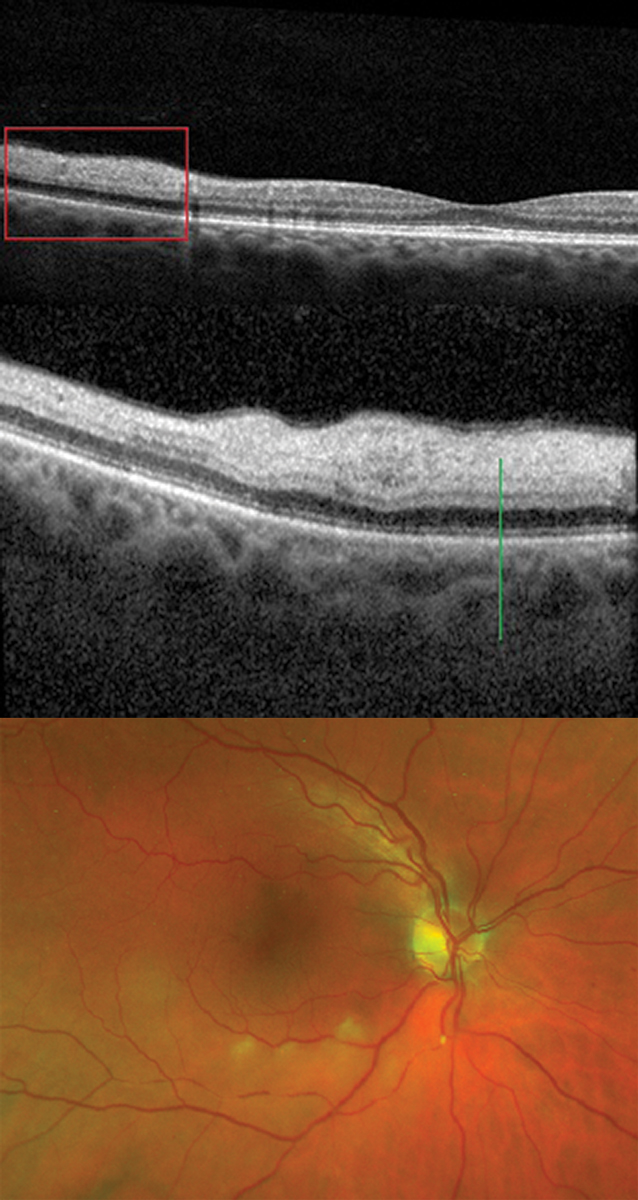
| Fig. 2. Pachychoroid epitheliopathy. Note the larger choroidal vessels (red lines) causing choroidal thickening and inner- shifting of the RPE, and associated epitheliopathy (green line). Click image to enlarge. |
An accurate diagnosis cannot be made simply by comparing your OCT to similar ones on the internet. The OCT is meant to augment your clinical exam, not replace it. Use it as a piece of the puzzle and analyze it by correlating it to the patient’s history, clinical exam and other ancillary tests when appropriate.
Normal Structure
A normal macular OCT should look as familiar as the back of your hand; however, remembering what structure each band on the image represents is sometimes less than second nature. Having a well-labeled clinical reference nearby can be helpful, both to jog our memories and for patient education (Figure 1).
 |
|
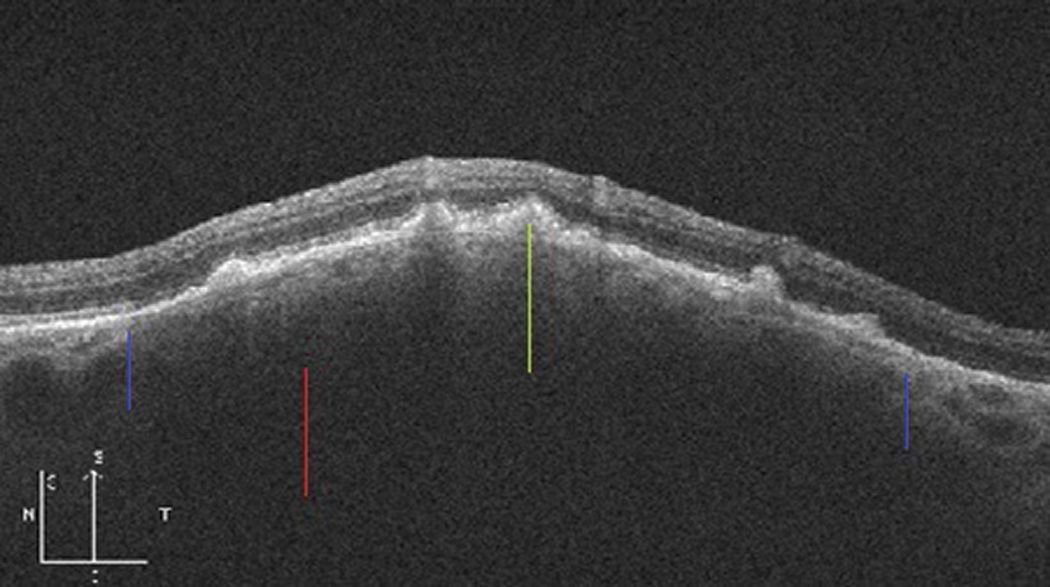
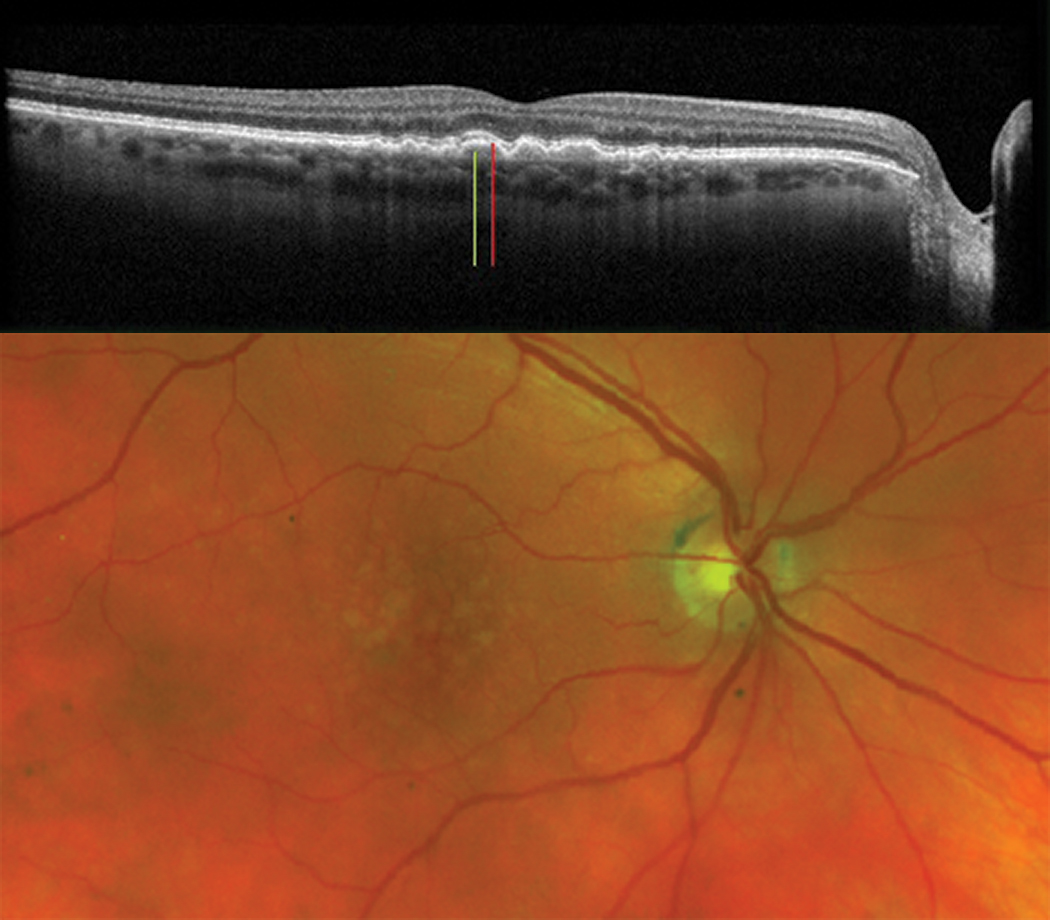
Fig. 3. Thickened choroidal nevus with posterior shadowing (red line) and overlying drusen (green line). The blue lines indicate the approximate inferior and superior margins of the nevus. Click image to enlarge. |
Sub-RPE/Choroid
Posterior to the retinal pigmented epithelium (RPE) is Bruch’s membrane, the choriocapillaris, Haller’s and Sattler’s vascular layers, then the sclera.
The suprachoroidal space is a potential area between the choroid and the sclera that may become filled with fluid in certain pathologies, making it visible via OCT. Enhanced-depth imaging OCT and swept-source OCT are helpful in visualizing this zone, but even without them, a lot can be seen.
The normal choroidal thickness varies throughout the eye and decreases with age by 16µm per decade on average.1 The macular choroid is typically thickest under the fovea and thinnest nasally.1 Abnormalities seen on OCT in this region broadly fit into the categories of thickening, thinning or simply irregular.
• Thickening. Anatomically or pathologically thickened choroids can be vascular (e.g., pachychoroid spectrum, hemangiomas), infiltrative (e.g., lymphoma, metastasis), inflammatory (e.g., sarcoidosis, effusion, Vogt-Koyanagi-Harada syndrome), infectious (e.g., tuberculosis) or tumorous/lesional (e.g., choroidal nevi, melanomas) in nature. Examples are shown in Figure 2 and Figure 3. Clinically, these generally appear as either diffuse or localized areas of choroidal thickening that may look orangish, creamy or gray/pigmented, depending on etiology.
How to Spot a PEDPigment epithelial detachments can arise from a host of chorioretinal conditions. PEDs can be serous (which will look dark/optically empty), drusenoid (moderately reflective but generally uniform), fibrovascular (hyperreflective and heterogeneous) or hemorrhagic (where the anterior aspect is hyperreflective but the blood causes posteror shadowing, as seen in Figure 9).5
Here’s how they are classified: Serous PEDs. Conditions leading to increased choroidal vascular permeability (such as pachychoroid spectrum or inflammatory conditions such as Vogt-Koyanagi-Harada syndrome) lead to serous fluid accumulation under the RPE, causing serous PEDs. Note, however, that these can also be idiopathic. Drusenoid PEDs develop due to drusen or drusenoid deposits under the RPE complex causing focal RPE elevations, such as in AMD. Hemorrhagic PEDs occur when blood detaches the RPE complex, as can be seen in type 1 or 2 CNV due to a number of conditions (including AMD, PCV, myopia, choroidal rupture, POHS and several other conditions with the possibility of CNV/exudative complications). Fibrovascular PEDs are more irregularly shaped detachments and are generally a result of occult CNV or of disciform scarring, a long-term complication of CNV.
|
• Thinning. By contrast, thinning of the choroid includes cases of age-related generalized thinning, tessellated high myopia (Figure 4), choroidal dystrophy (e.g., central areolar choroidal dystrophy [CACD]) and iatrogenic causes (e.g., photodynamic therapy).2 Clinical examination may show a generally lighter-appearing fundus in the areas of thinning due to a thinner vascularized layer over the white sclera.
• Irregular. A choroid can also be irregular without necessarily being thick or thin. A good example of this is choroidal folds (Figure 5), which can occur for several reasons. The mnemonic “THIN RPE” can be helpful in identifying the source of the choroidal folds. It stands for:
- Tumor
- Hypotony or Hyperopia
- Inflammation or Idiopathic
- Neovascularization
- Retrobulbar mass
- Papilledema
- Extraocular hardware
These appear clinically as undulations or striations of the RPE and may be associated with metamorphopsia because they can cause the overlying outer retina to ripple.
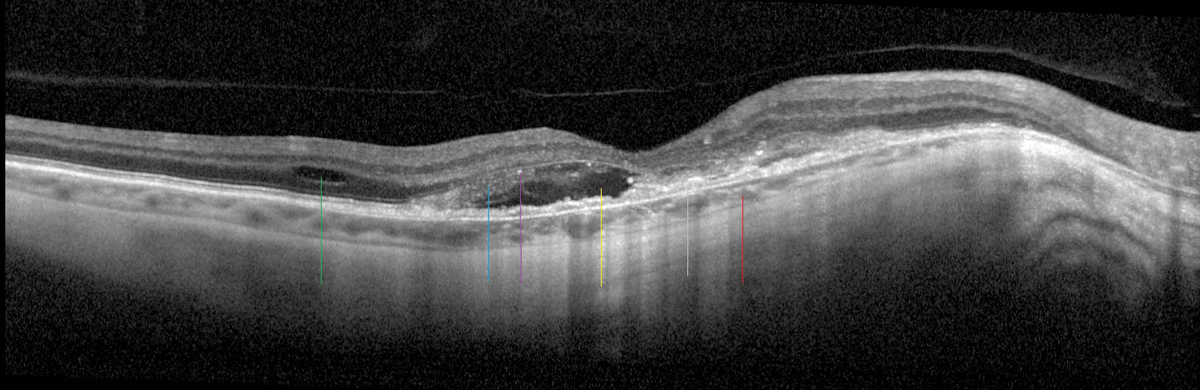 |
|
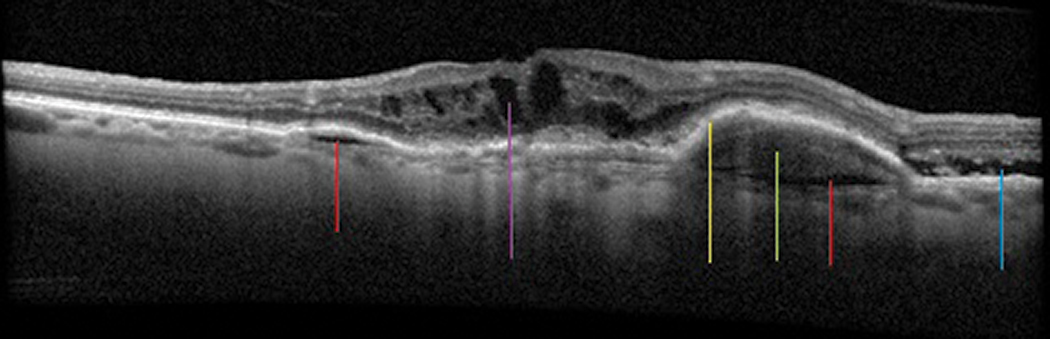
Fig 4. A highly myopic patient with a tessellated and thin choroid (red line), RPE disruption (gray line), SRF (yellow line), IRF (green line), edematous photoreceptors (blue line) with early tubulation and hyperreflective material (purple line) are all consistent with myopic CNV. Click image to enlarge. |
 |
|
Fig. 5. Choroidal folds causing sub-RPE undulations (red lines). Click image to enlarge. |
Since the choroid supports the function of the RPE and outer retina, thinning or atrophy of the choroid or choriocapillaris ultimately leads to RPE atrophy and subsequent outer retinal loss (e.g., CACD, geographic atrophy [GA]), which causes scotomas. Likewise, compression from the choroid onto the choriocapillaris and RPE can disrupt choriocapillaris flow and stimulate RPE migration or loss, which also results in outer retinal damage (e.g., pachychoroid). Keep pathophysiology in mind when looking at structure.
 |
|
Fig. 6. Hard drusen (green line) with mild RPE mottling (red lines). Click image to enlarge. |
RPE Complex
In and around the RPE are hotspots for pathological abnormalities seen on OCT. Extracellular debris can accumulate below the RPE (e.g., drusen) or in and anterior to it (e.g., lipofuscin). In some cases, the RPE itself can become irregular (e.g., pigment mottling/clumping). The RPE can die (e.g., atrophy), detach (e.g., pigment epithelial detachments [PED], type 1 CNV) or rip (e.g., RPE tears). It can be stimulated to change via compression (e.g., pachychoroid), and any disturbance in this area can lead to outer retinal disruption or atrophy, leaving it susceptible to the development of subretinal or intraretinal fluid (e.g., CNV, RPE insufficiency).
 |
|
Figs. 7a and 7b. Soft drusen (green line) with drusenoid PEDs (red line). Clinical photo of the large soft drusen (bottom). Click image to enlarge. |
Various types of drusen and drusen-like deposits can develop, which can be seen in myriad conditions ranging from normal aging to dystrophies and degenerations. Some of the presentations more frequently encountered in general practice include:
- Hard drusen (Figure 6), which are well defined and uniform sub-RPE deposits.
- Cuticular drusen. These are generally numerous, very small (25µm to 75µm) and dot-like with a sawtooth outline on OCT due to their prolate or spindle shape.
- Soft drusen (Figures 7a, 7b), which are larger mounds (>125µm) with internal hyporeflectivity and are less well-circumscribed than hard drusen.
- Reticular pseudodrusen, which are structures that form between the RPE and the ellipsoid zone (EZ).3
Levels of RPE lipofuscin in excess of age-related normals (as in Stargardt’s or vitelliform macular dystrophies [Figure 8] or Best disease) are associated with cellular dysfunction and ultimately RPE and retinal atrophy causing typically gradual bilateral vision loss.4 (See “Determining Macular Dystrophies on OCT.”) Lipofuscin accumulations are seen in and anterior to the RPE and appear orangish or yellow clinically.
 |
|
Fig. 8. Lipofuscin accumulation (red line) within and anterior to the RPE, here in adult-onset vitelliform macular dystrophy. Click image to enlarge. |
 |
|
Fig. 9. Exudative macular degeneration demonstrating sub-RPE fluid (red lines), sub-RPE hemorrhage (green line) with exudative PED (yellow line), SRF (blue line) and intraretinal fluid (purple line). Click image to enlarge. |
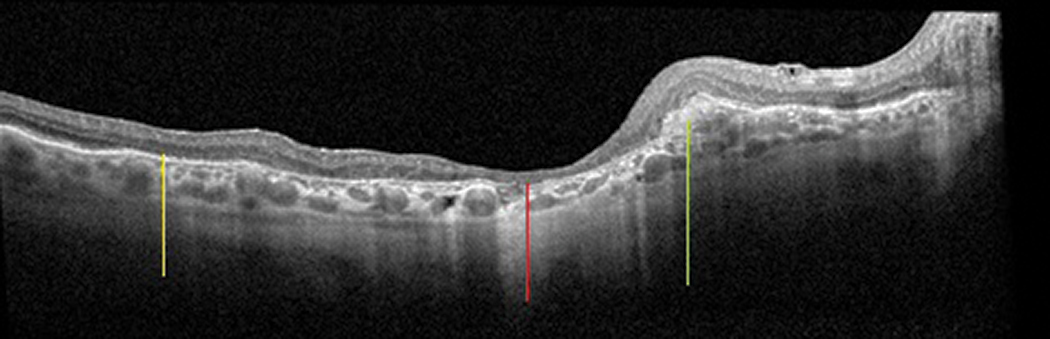 |
Fig. 10. A patient with previous exudative macular degeneration, now with subretinal fibrosis (green line) and atrophy. Areas where atrophy becomes very apparent are outer retinal atrophy (yellow line) and RPE/outer retinal/intraretinal atrophy (red line). Click image to enlarge. |
Subretinal
We hate to see anything in the subretinal space. Anything separating the photoreceptors and outer retina from its critically important supporting RPE can ultimately lead to photoreceptor loss and, therefore, vision loss.
Determining Macular Dystrophies on OCTSeveral macular dystrophies may present on OCT with features that are similar to one another and to more common maculopathies like macular degeneration. Here’s what differentiates them: Malattia Leventinese (also called Doyne’s honeycomb dystrophy or familial dominant drusen) presents with radial drusenoid deposits throughout the macula and around the disc. These sub-RPE deposits appear similar to typical drusen, but in the macula they tend to be more elongated in shape. Fundus flavimaculatus, a variant of Stargardt macular dystrophy, shows pisciform lipofuscin accumulation at the level of the RPE. Best vitelliform macular dystrophy (BVMD or Best dystrophy) in younger patients or adult-onset foveomacular vitelliform dystrophy (AFVM or vitelliform) in older patients shows subfoveal lipofuscin accumulation, which over time evolves with various RPE changes and atrophy, ultimately with outer retinal atrophy as well. Other pattern dystrophies primarily demonstrate a variety of RPE mottling or atrophy, occasionally with lipofuscin deposits, and outer retinal loss over time. Central areolar choroidal dystrophy (CACD) initially shows RPE changes and eventual atrophic ovaloid patches that ultimately coalesce into a GA-like picture. Rod-cone dystrophies ultimately show outer retinal thinning with ellipsoid zone loss due to photoreceptor atrophy and loss of the RPE-photoreceptor interdigitation zone. |
Frequently encountered actors in the subretinal space in primary eye care practice are subretinal fluid (SRF) (e.g., central serous retinopathy), subretinal hemorrhage (SRH) (e.g., type 2 CNV) and subretinal fibrosis (e.g., disciform scarring), as seen in Figure 9. On OCT, SRF in this space appears dark or optically empty, whereas SRH is more reflective or opaque due to its composition. Fibrotic scarring, likewise, is more opaque with highly reflective and usually nodular fibrosis (Figure 10).
Clinically, SRF appears translucent, SRH is generally a deep red and subretinal fibrosis looks off-white. Early SRF may cause metamorphopsia, while subretinal fibrosis is associated with scotoma.
 |
|
Fig. 11. In this rod-cone dystrophy, the outer retina (specifically ONL) has collapsed where the ellipsoid zone (red line) ends (green line). Click image to enlarge. |
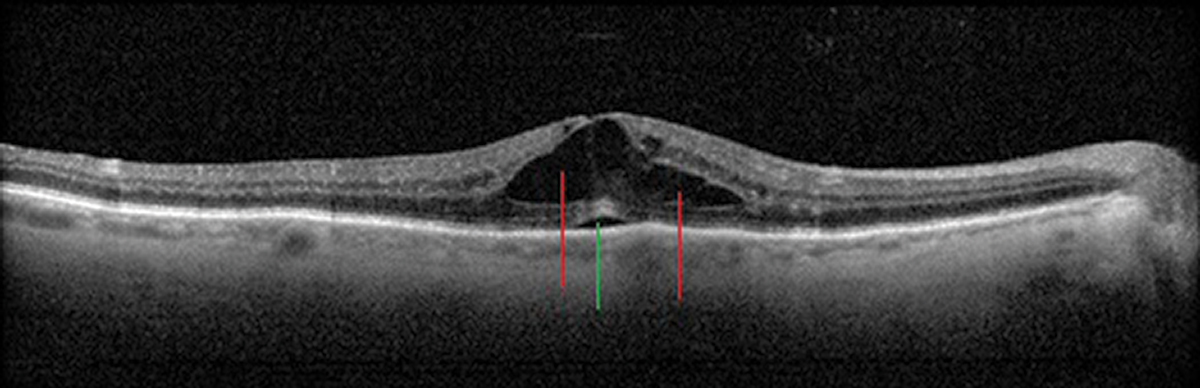 |
Fig. 12. Cystic intraretinal spaces (red lines) and a focal subfoveal neurosensory retinal detachment (green line) in Irvine-Gass/post-op CME. Click image to enlarge. |
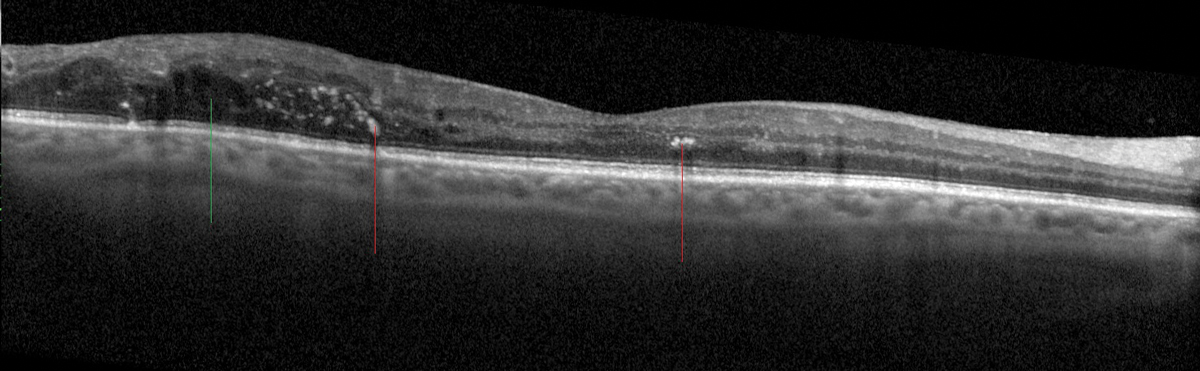 |
Fig. 13. Hyperreflective foci (red lines) within the retina corresponding to exudates in a patient with diabetic retinopathy and non-central macular edema/IRF (green line). Click image to enlarge. |
Outer Retina
The outer retinal layers are obviously critical for sight, and disruption here generally involves atrophy of some kind. Geographic atrophy (e.g., AMD, CACD), macular telangiectasia type 2, retinal dystrophies (e.g., rod/cone dystrophies [Figure 11]) and toxic maculopathy (e.g., hydroxychloroquine toxicity) are frequently seen and ultimately demonstrate outer retinal layer loss.
In evaluating outer retinal loss, consider the integrity of the layers surrounding the outer retina. For example, if the RPE complex is normal while the EZ is disrupted, it likely indicates a photoreceptor issue rather than a chorioretinal atrophic issue.
Intraretinal
In the middle retinal layers, abnormalities come from a variety of sources with a range of presentations.
Macular edema, showing intraretinal cystic spaces, may occur related to several issues: diabetes (DME) or other vascular abnormalities or occlusions (e.g., CME associated with hypertension or retinal vein occlusions), inflammatory conditions (e.g., Irvine-Gass syndrome/postoperative CME [Figure 12], uveitis) or tractional causes (e.g., epiretinal membranes or association with neovascular/proliferative traction). Macular edema can sometimes be difficult to see clinically but appears as translucent cystic retinal thickening, which correlates to the serous intraretinal cysts seen on OCT.
Intraretinal deposits appear as very hyperreflective foci. Exudates (e.g., diabetic retinopathy [Figure 13]) generally are in or around the inner plexiform later, whereas deposits can be seen in all layers with various crystalline retinopathies.6
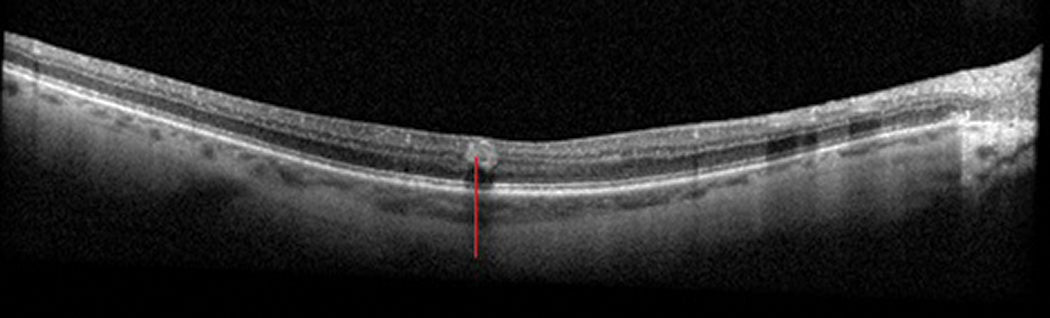 |
Fig. 14. An intraretinal hemorrhage (red line) seen in a patient with diabetic retinopathy. Click image to enlarge. |
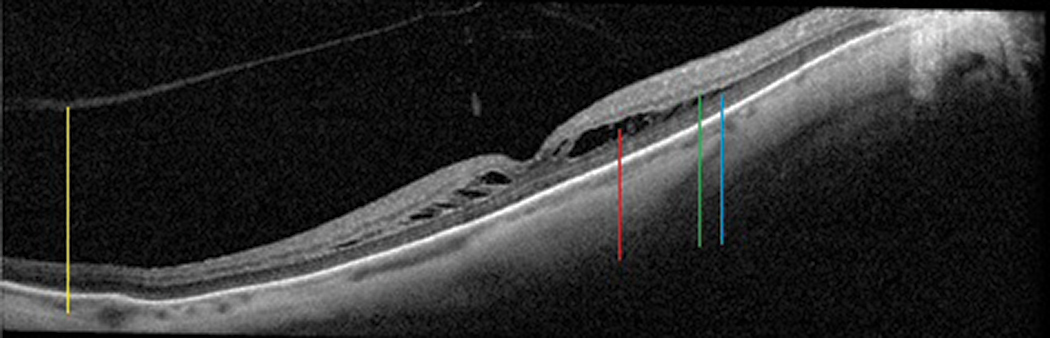 |
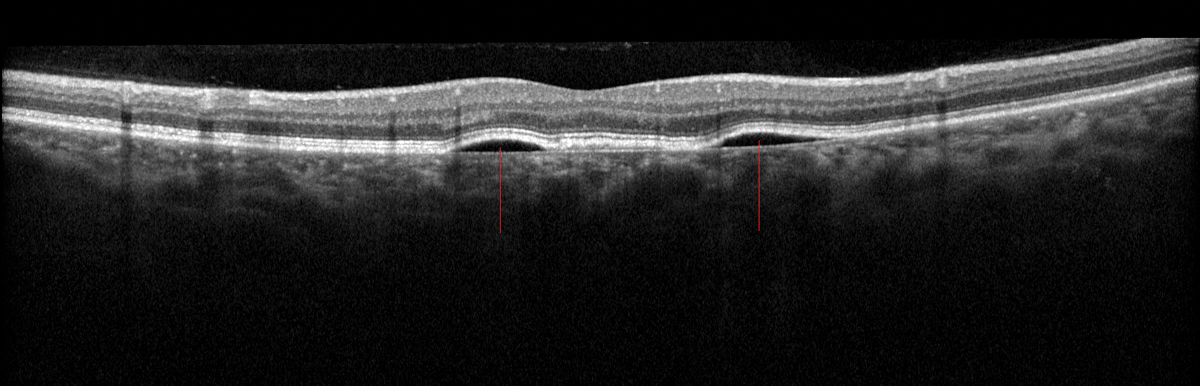
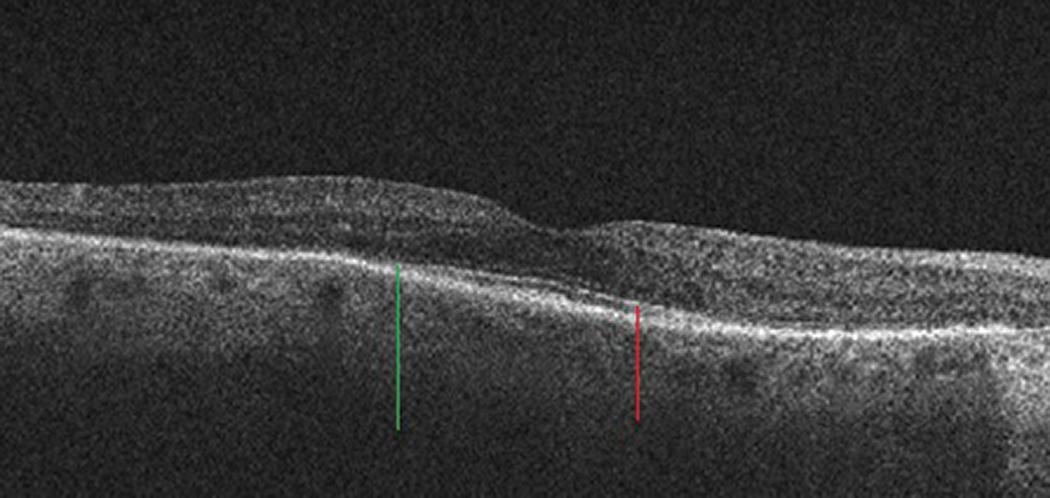
Fig. 15. Foveoschisis cavity (red line) separating the outer plexiform (green line) and outer nuclear (blue line) layers in this myopic patient, who also has a generally thin choroid. The posterior hyaloid of the vitreous (yellow line) is detached. Click image to enlarge. |
Microaneurysms (MAs) or intraretinal hemorrhages (IRH) are also often seen in this space. MAs appear round or oval, are well demarcated because of their capsular structure, are often associated with adjacent cystic spaces and occur predominantly in the inner nuclear layer.7 IRHs are more nebulous in shape than MAs, but the blood makes them appear dense (Figure 14).7 On clinical examination, MAs appear as focal red spots whereas IRHs are often described as red dot-or-blot hemorrhages.
Foveoschisis, often associated with myopia, shows broader areas of intraretinal separation that can involve several retinal layers, but is most often seen separating the inner plexiform and outer nuclear layers (Figure 15).5
 |
Figs. 16a and b. A broad (upper) and more magnified (lower) scan of NFL edema (green line) in an acute branch retinal artery occlusion. Clinical photo of a branch retinal artery occlusion with an intra-arterial embolus inferior to the disc, segmentation of blood flow downstream and cotton-wool spots in the posterior inferior-temporal arcade (bottom). Click image to enlarge. |
Inner Retina
Abnormalities of the inner retina also generally fit into categories of thickening (e.g., cotton-wool spots, edema) (Figures 16a, 16b), thinning (e.g., atrophy after retinal artery occlusions or ischemic optic neuropathy). Hemorrhages may also be visible (e.g., flame-shaped hemes in the nerve fiber layer).
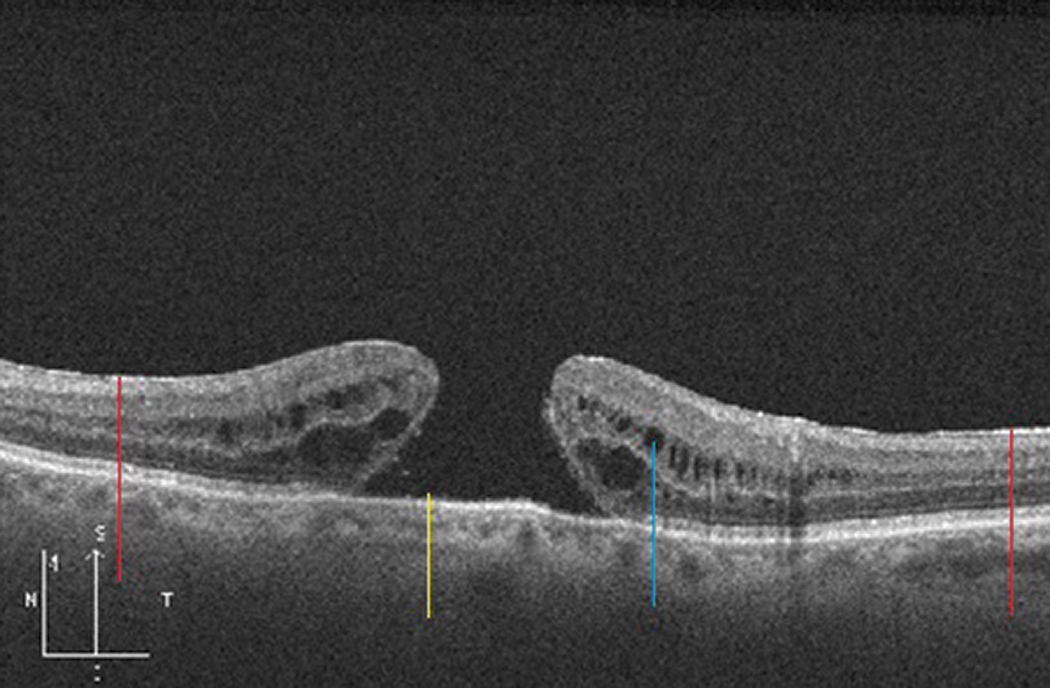 |
Fig. 17. A full-thickness macular hole (yellow line) with adjacent intraretinal cystic spaces (blue line) in a patient with epiretinal membrane (red lines). Click image to enlarge. |
Epiretinal/Vitreomacular/Vitreous Space
This area is frequently noted to have vitreomacular adhesion or traction and epiretinal membranes, all associated with the development of macular holes (Figure 17). Other epiretinal abnormalities can also involve traction, such as preretinal vascular membranes or fibrosis (e.g., proliferative diabetic retinopathy). Any variety of traction on the macula can lead to intraretinal cysts or CME, schisis or SRF.5
The vitreous generally looks dark and optically empty on OCT but can have reflective foci if debris is present (e.g., asteroid hyalosis, inflammatory/white, red or pigmented cells).
Putting the Pieces Together
In summary, when encountering an abnormal macular OCT, first consider which sections of the retina or adjacent structures are affected, then consider what the clinical exam looked like and, finally, put it together in the context of the patient’s history and any other ancillary information you have available.
Thinking critically about these things should allow you to deduce an accurate diagnosis—or at least get you headed in the right direction. When in doubt, it’s entirely appropriate to solicit the help of colleagues, but be sure to produce your own analysis first.
Dr. Weidmayer practices at the VA Ann Arbor Healthcare System and is a clinical assistant professor in ophthalmology and visual sciences at the University of Michigan. She has no financial interests to disclose.
1. Margolis R, Spaide RF. A pilot study of enhanced depth imaging optical coherence tomography of the choroid in normal eyes. Am J Ophthalmol. 2009;147(5):811-5. 2. Zhou Y, Song M, Zhou M, et al. Choroidal and retinal thickness of highly myopic eyes with early stage of myopic chorioretinopathy: Tessellation. J Ophthalmol. 2018;2181602. 3. Khan KN, Mahroo OA, Khan RS, et al. Differentiating drusen: Drusen and drusen-like appearances associated with ageing, age-related macular degeneration, inherited eye disease and other pathological processes. Review Prog Retin Eye Res. 2016;53:70-106. 4. Sparrow JR, Boulton M. RPE lipofuscin and its role in retinal pathobiology. Exp Eye Res. 2005;80(5):595-606. 5. Bhende M, Shetty S, Parthasarathy MK, Ramya S. Optical coherence tomography: A guide to interpretation of common macular diseases. Indian J Ophthalmol. 2018;66(1):20-35. 6. Nag A, Chauhan G, Lim Ji. Crystalline retinopathy. EyeWiki. October 1, 2020. eyewiki.aao.org/Crystalline_retinopathy. Accessed October 18, 2020. 7. Horii T, Murakami T, Nishijima K, et al. Optical coherence tomographic characteristics of microaneurysms in diabetic retinopathy. Am J Ophthalmol. 2010;150(6):840-8. |
