 |
In the June 2021 installment of Focus on Refraction, Drs. Harris and Taub gave an overview of the cheiroscopic trace in the article “Space: The Final Frontier.” They described how the cheiroscopic trace is a manifestation of the way that patients perceive space around them and direct their actions accordingly (in this case, tracing printed figures). They also showed how the cheiroscopic trace can be useful in detecting and managing aniseikonia. This month’s column will continue this theme by discussing another such technique, the Van Orden star.
What a patient produces during the Van Orden star task tangibly shows what they see. According to Kaplan and Lydon, “The Van Orden star probes the way we perceive, and mentally represent, the world around us. Execution of this pattern […] requires the individual to rapidly and accurately interpret what he sees, generate a motor response and maintain attention throughout. The appearance of his star pattern is fundamentally a predictor of the patient’s spatial behavior.”1 Spatial behavior is heavily influenced by ocular alignment, as will become more obvious through some examples.
The Procedure
The Van Orden star, like the cheiroscopic trace, is performed in a stand-up cheiroscope. The optics of the cheiroscope allow the patient to view each side of the test card separately, without fusion. This allows for the characteristic appearance to the finished trace: two sets of converging lines forming points. Careful interpretation of a patient’s star pattern gives us a great deal of insight into how they interpret space and whether there is any significant heterophoria or vertical deviation.
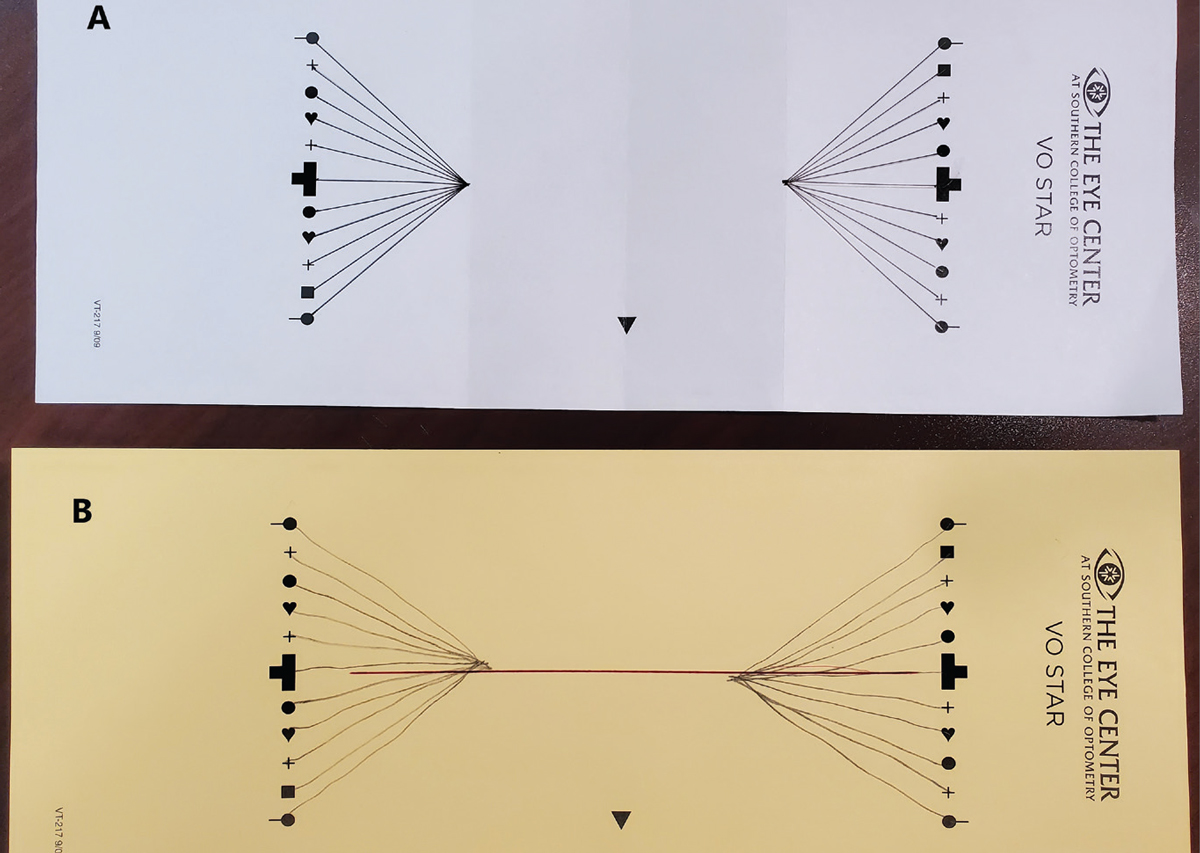 |
| Fig 1. An ideal Van Orden star (A). Note the cleanly formed apices and vertical alignment. Dr. Schnell’s baseline Van Orden star showing vertical misalignment and esophoria (B). |
The test card for the Van Orden star is a horizontal rectangle that includes two vertical columns of pre-printed shapes placed 154mm apart. The patient stands in front of the cheiroscope and views the card through the oculars, where they will see one column of shapes with the left eye and the other with the right eye. Using two pencils, one for each hand, the patient will draw a series of lines on the card. They start by placing each pencil on the center target of each column. They will then draw a line with each hand, simultaneously, toward the center of the card until the pencils appear to touch each other. Once they have done this, they move the pencils so that the right-hand pencil is now on the top figure of the right-hand column of shapes, while the left-hand pencil is placed on the bottom figure of the left-hand column. From this position, they again draw a line with each hand toward the center until the pencils appear to touch.
Next, the pencils are moved such that the left-hand pencil is placed on the top figure of the left-hand column and the right-hand pencil is on the bottom figure of the right-hand column. The process is repeated, with the patient drawing lines toward the center and the pencils alternating between shapes until all corresponding shapes have been used.1,2
The Outcome
Ideally, a completed Van Orden star looks like what is shown in Figure 1A.3 The lines that the patient has drawn on each side meet in a definite point at a distance of approximately 37mm from the inside edge of the printed figures (a separation of 77mm). Various clinical presentations can change the appearance of the star, however. Among these are horizontal heterophorias, vertical deviations and central suppression of one or both eyes.
Let’s take a look at some examples of skewed or disorganized Van Orden stars and what they represent. To create these stars, I (Dr. Schnell) performed the test on myself with varying amounts of yoked prism in order to simulate different binocular conditions.
Before I started playing with the prism, I performed a baseline Van Orden star. Compared with Figure 1A, which shows perfect results, Figure 1B is evidence of both my esophoria and vertical deviation. The right side of the pattern is several millimeters below the left, with a horizontal separation of the apices of 63mm. You can also see that the point where the lines meet for each side is not precise, possibly indicating some instability of both fixation and alignment.
For the first set of Van Orden stars with prism, I wore 8^ yoked and performed one star in each of the following base directions: right, left, up and down, followed by 8^ base-in and base-out. Figure 2 shows the result with 8^ base-right. While both sides of the star show defined apices, my vertical deviation was made blatantly obvious with the right-hand half of the star shifted downward by a full 5mm. Clearly, I was not able to compensate for the shift in my perceptual space created by the base-right prism. Yoked base-left, base-up and base-down showed similar results.
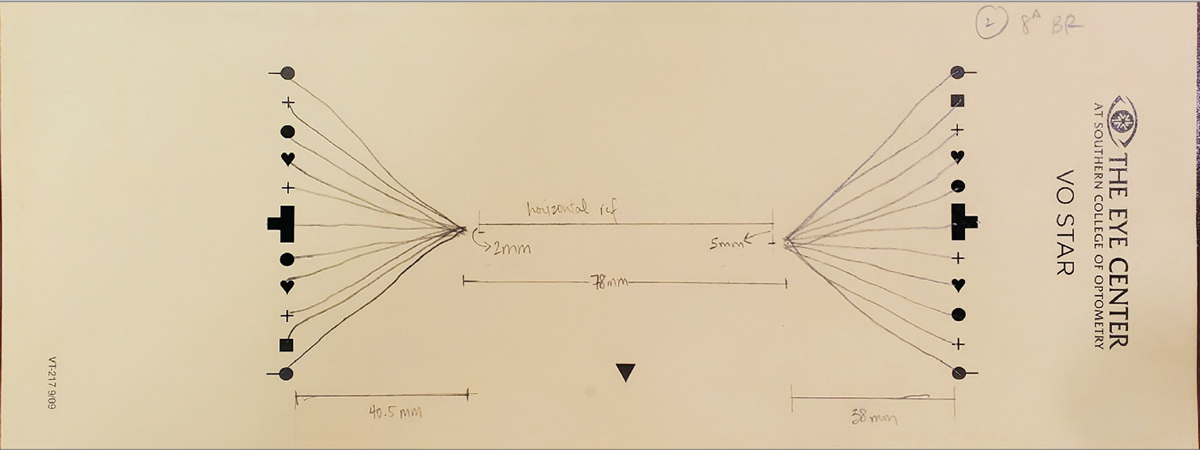 |
| Fig 2. Van Orden star with 8^ base-right showing exacerbation of vertical misalignment. Click image to enlarge. |
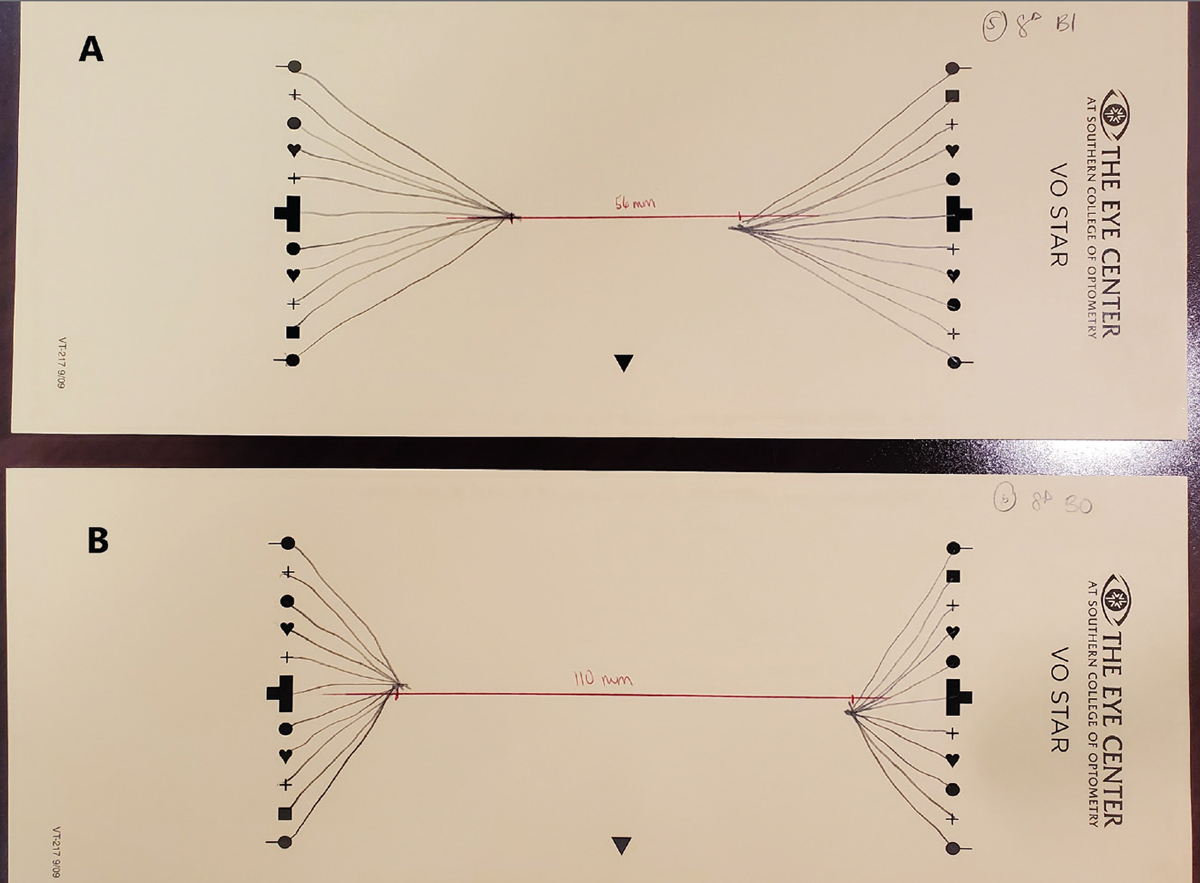
Really interesting deviations of the star showed up when I moved the prism to base-in and base-out (Figure 3). With 8^ base-in, the two sides still showed good apices, but they were significantly closer to each other, at about 56mm compared with my baseline of 63mm. With 8^ base-out, the apices were extremely far apart, at 110mm. Perceptually, as I was drawing the figures, the base-in setup made the two columns of figures appear to be much farther apart than they actually were, and the opposite was true for the base-out.
 |
|
Fig 3. Van Orden stars with 8^ base-in (A) and 8^ base-out (B). The prism’s influence is evident in the significant horizontal shift of the apices. Click image to enlarge. |
Another possible appearance occurs when the patient is showing a central suppression. In this case, one or both sides of the star will fail to come to a defined apex. As part of my experiment, I created a simulated central suppression OS with a piece of translucent tape on the left cheiroscope ocular, and sure enough, I had no definite apex to the star on that side. This is an easy-to-see manifestation of what can otherwise be a difficult clinical diagnosis.
The Message
While it isn’t necessary for eyecare practitioners to have a cheiroscope and run Van Orden star testing as part of their exam, this method can tell you a lot about a patient’s overall function. It offers a tangible representation of how space looks to them—from a phoria, vertical deviation or central suppression. It’s a quick look at what your patients are actually seeing and can help you decide on the best management.
Dr. Taub is a professor, chief of the Vision Therapy and Rehabilitation service and co-supervisor of the Vision Therapy and Pediatrics residency at Southern College of Optometry (SCO) in Memphis. He specializes in vision therapy, pediatrics and brain injury. Dr. Schnell is an associate professor at SCO and teaches courses on ocular motility and vision therapy. She works in the pediatric and vision therapy clinics and is co-supervisor of the Vision Therapy and Pediatrics residency. Her clinical interests include infant and toddler eye care, vision therapy, visual development and the treatment and management of special populations. They have no financial interests to disclose.
1. Kaplan M, Lydon CM. The Van Orden star: a window into personal space. J Optom Vis Devel. 2002;33:21-8. 2. Donnelly D, Breidenstein R. DB and Van Orden star phorias calculated as a function of various distances. Pacific University Common Knowledge: Theses, Dissertations, and Capstone Projects, 1955. 3. McMahon A. The Van Orden star. Pacific University Common Knowledge: Theses, Dissertations, and Capstone Projects, 1993. |
