Ease the Burden of GlaucomaThe July 2023 issue of Review of Optometry highlights one of the toughest diseases to spot and diagnose: glaucoma. The 29th annual glaucoma report targets dozens of areas where some ODs struggle to move beyond the fundamentals. Check out the other articles featured in this issue:
|
With an increasingly aging population, the prevalence of glaucoma has been projected to reach almost 111 million worldwide by 2040.1 Optometrists play a critical role in all aspects of a patient’s journey with this chronic eye condition, ranging from the initial diagnosis to ongoing management.2
In 2021, we published a two-part starter kit article (found here and here) to guide optometrists wanting to set up or further develop their glaucoma clinic. This article is a follow-up that will cover more intermediate or advanced concepts for optometrists such as navigating the challenge of high myopia in glaucoma and strategies for tackling glaucoma progression.
Navigating Care in High Myopia
Myopia has been firmly established as a risk factor for glaucoma development whereby each diopter increase in myopia associated with a non-linear 20% increase in risk of glaucoma which has been shown to accelerate above -6.00D.3 The concomitant presentation of myopia and glaucoma can pose both a technical and diagnostic challenge to clinicians.
Optical coherence tomography (OCT) is critical in glaucoma assessments. From a technical standpoint, obtaining high-quality artifact-free scans can be difficult in myopic patients. These patients may have anomalous retinal configurations such as prominent posterior staphylomas and peripapillary atrophy, which often result in data loss arising from errors in segmentation or scan truncation.4
Although OCT scans in high myopia are associated with a higher prevalence of artifacts, previous work has shown in the majority of cases, these scans still contain sufficient information to cross-sectionally identify glaucomatous features such as retinal nerve fiber layer (RNFL) thinning on circle scans and thickness heat maps.4
Therefore, it is still recommended that clinicians review all components of OCT imaging for these patients, including the circumpapillary RNFL thickness values, as well as the RNFL and ganglion cell complex heat maps, to maximize the usable information for glaucoma diagnosis. In particular, clinicians should place more emphasis on interpreting raw data rather than drawing comparisons from normative databases. Patterns of defect that are suggestive of glaucoma include asymmetric loss across the horizontal midline, arcuate like defects and losses that are deepest temporally rather than nasally.
 |
|
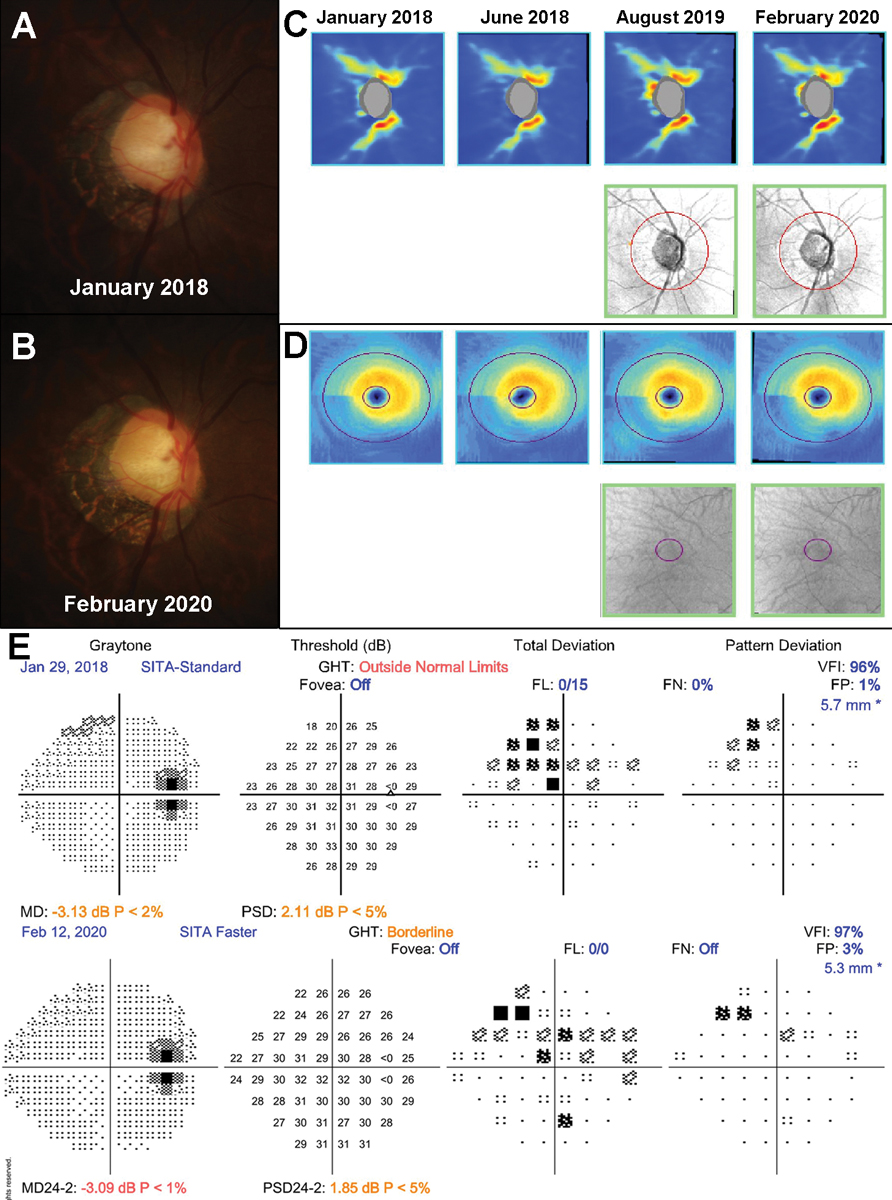
Fig. 1. An example of myopic optic neuropathy in a 47-year-old patient. A to B: Fundus photographs showed no change in the disc appearance between January 2019 and February 2020. C to D: There was no evidence of structural progression on the RNFL and ganglion cell inner plexiform layer (GC-IPL) guided progression analyses. E: 24-2 SITA-Standard VFs also did not show worsening of the existing superonasal defect. Click image to enlarge. |
Another clinical consideration optometrists should have in mind when assessing patients with high myopia for glaucoma is the overlap in clinical features between the two entities.5 High myopia can present with anomalous disc presentations such as tilting or torsion as well as displacement of neural tissue associated with axial elongation.6 Myopic optic discs can also manifest with glaucoma-like visual field (VF) defects, further confounding accurate diagnosis.5 As there is no single clinical feature that can be used to definitively distinguish between glaucoma and myopic optic neuropathies, clinicians must instead rely on the difference in natural history to guide differential diagnosis.5,7
In contrast with glaucoma, which has a median progression rate of -0.40dB per year,7 myopic optic neuropathies are typically static or very slowly progressing.5 Given the variable nature of OCT measurements for progression analysis in these patients, clinicians should rely more upon changes to the disc appearance detected using serial fundus photographs or perimetric progression when assessing these patients.
An example showing the static nature of myopic optic neuropathy is shown in Figure 1. This 47-year-old patient was closely monitored over a 14-month period given the myopic configuration of the discs and low intraocular pressures (IOPs; 14mm Hg OD and 14mm Hg OS). Her structural and functional findings were stable over this period thus supporting the leading diagnosis of myopic optic neuropathy.
Although progression is the one of the most definitive ways for differentiating between glaucoma and myopic optic neuropathy, clinicians may still make the decision to treat in the absence of longitudinal data showing progression. Some factors that may cause clinicians to lean more towards treating rather than monitoring at the initial visit include high IOPs in the context of thin central corneal thicknesses, and central or extensive field defects.8
In particular, it is difficult to ascertain the true IOP in patients that have undergone refractive surgery involving the cornea whereby in most instances, IOP is under-estimated in this subset of patients.9 In patients with central or extensive field loss, given the existing level of functional loss and potential functional impact, clinicians may err on the side of caution and initiate treatment without confirming progression to preserve as much existing vision as possible.
Clinical tip #1: OCT measurements relevant to glaucoma are often confounded in patients with high myopia. Clinicians should place more emphasis on using raw data as well as longitudinal data to make a more confident glaucoma diagnosis.
 |
|
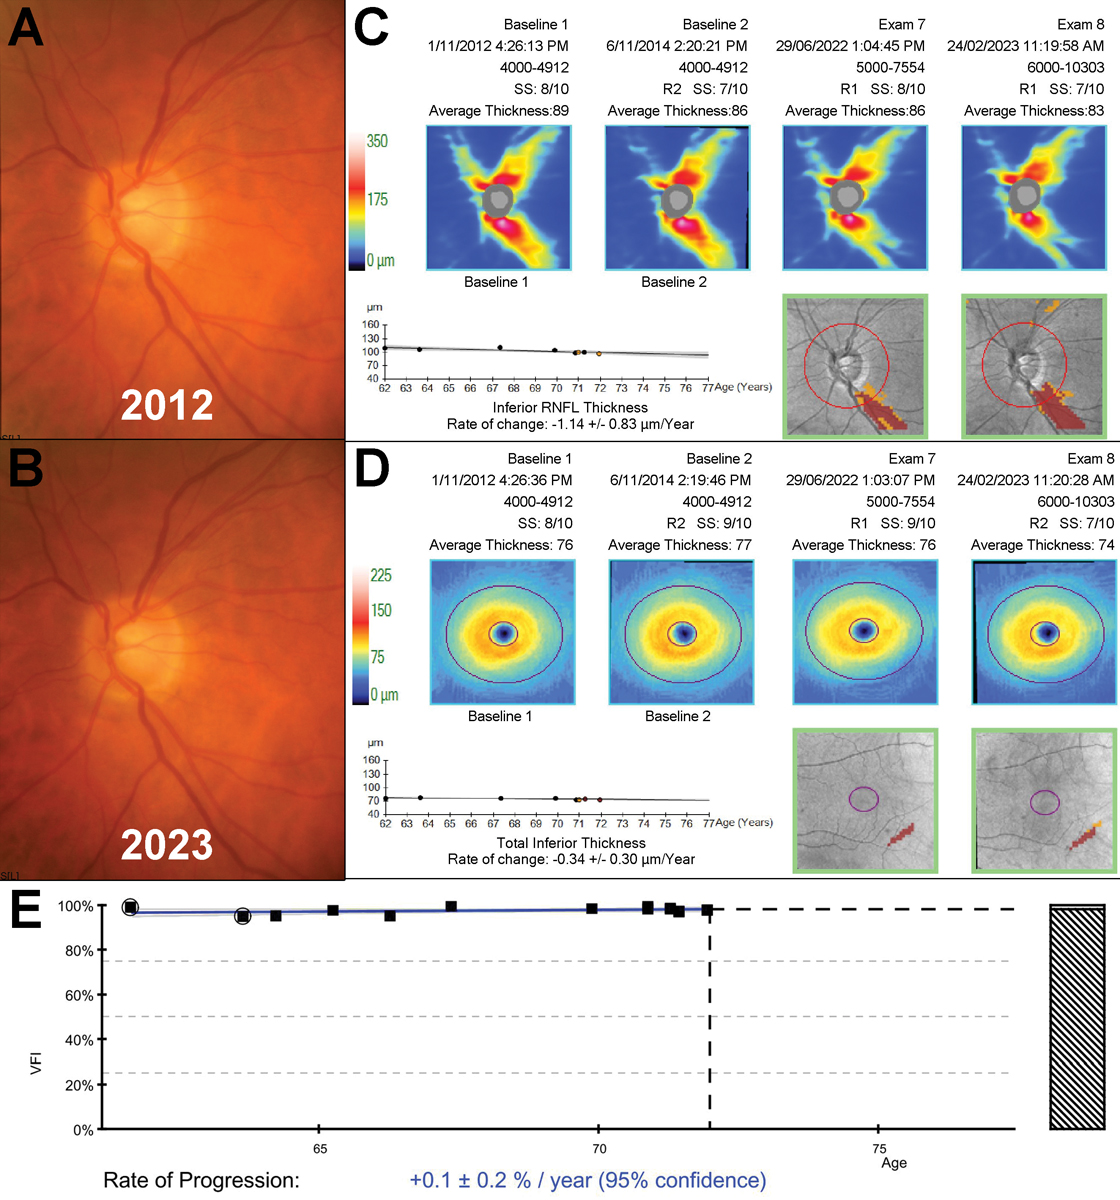
Fig. 2. An example of a 72-year-old patient with slow progressing untreated normal tension glaucoma monitored over an 11-year period. A to B: Fundus photographs showed subtle thinning of the inferior neuroretinal rim between 2012 and 2023. C to D: Structural progression analyses showed slow inferior thinning on both the RNFL and ganglion cell-inner plexiform layer printouts. E: VF index progression analysis showed no evidence of associated functional deterioration. Click image to enlarge. |
No One Approach
In more recent years, there has been a paradigm shift towards greater personalization of glaucoma care.2,10 In our previous articles, we briefly discussed the importance of understanding glaucoma disease trajectory to determine the need for treatment. Side effects associated with eye drops or laser, cost of treatment, the need for ongoing reviews and even the diagnosis of glaucoma are all factors that can reduce a patient’s quality of life.11,12 Thus, the provision of glaucoma care should balance between preserving a functional level of vision for the patient and ensuring they maintain a reasonable level of quality of life.
There are several factors that clinicians need to consider when making the decision to treat or to escalate treatment. First, it is important for clinicians to establish progression rate and location of vision loss if relevant to prognosticate the patient’s risk of vision loss if their glaucoma is left untreated.2 While there are several risk factors associated with glaucoma, the most definitive risk factor for blindness within a patient’s lifetime is the severity of glaucoma at the point of diagnosis.13-17
In patients with pre-perimetric or early glaucoma, close monitoring with reviews every four to six months can help identify catastrophic progressors.18,19 In patients with existing vision loss without historical data to establish progression rate, clinicians can stratify risk of progression by extrapolating natural history based on the subtype of glaucoma.
For example, from a statistical standpoint, patients with high-tension phenotypes of glaucoma or pseudoexfoliative glaucoma are more likely to progress faster compared with patients with low-tension phenotypes.7 Secondly, the trade-off between a patient’s likelihood of vision loss based on their disease progression rate over their lifetime, current stage of glaucoma and adverse effects associated with treatment needs to be considered. A 2017 study that evaluated the long-term clinical course of patients with “pre-perimetric” low-tension glaucoma found that over half of these patients did not develop a VF defect.20 Similarly, a 2015 study that compared outcomes for newly diagnosed open-angle glaucoma patients prescribed latanoprost vs. placebo also showed that over 25% of untreated patients did not demonstrate VF progression over the study period.21
These findings support the notion of close observation for newly diagnosed low-tension open angle glaucoma to determine disease progression rate and better understand the patient’s risk of vision loss within their lifetime. An example of a 72-year-old patient with slow-progressing untreated normal tension glaucoma monitored over 11 years is shown in Figure 2. Given the slow rate of progression on both structure and function in conjunction with low IOPs (range of 9mm Hg to 15mm Hg OD and 10mm Hg to 15mm Hg OS), the overall risk of vision loss within this patient’s lifetime is fairly low.
The discussion to watch vs. to treat should be made in discussion with the patient whereby the risks and benefits are presented to them for them to make an informed decision. Clearly document the details of the conversation as well as the patient’s decision in their clinical record.
There are several strategies clinicians can adopt when stratifying risk of blindness in glaucoma patients. To make an individualized projection of disease progression, clustered or more frequent testing may be more appropriate, as this provides clinicians with additional data points to detect change. For example, previous work suggests a minimum of six VFs within a two-year period is most ideal for detecting mean deviation loss.22 This approach is most useful in pre-perimetric stages of disease where it may be difficult to differentiate between early disease manifestation and normal aging changes.23
An alternate method for risk stratification is the use of IOP characteristics such as response to osmotic stress or diurnal pressure fluctuations.24 In addition to differentiating between low- and high-tension phenotypes, assessing pressure characteristics can also help determine the most appropriate option for treatment (i.e., topical therapy vs. selective laser trabeculoplasty as first-line therapy)25 or titrating treatment intensity.26
Clinical tip #2: Apply a personalized approach to deciding when to watch and when to treat or escalate for newly and previously diagnosed glaucoma patients.
 |
|
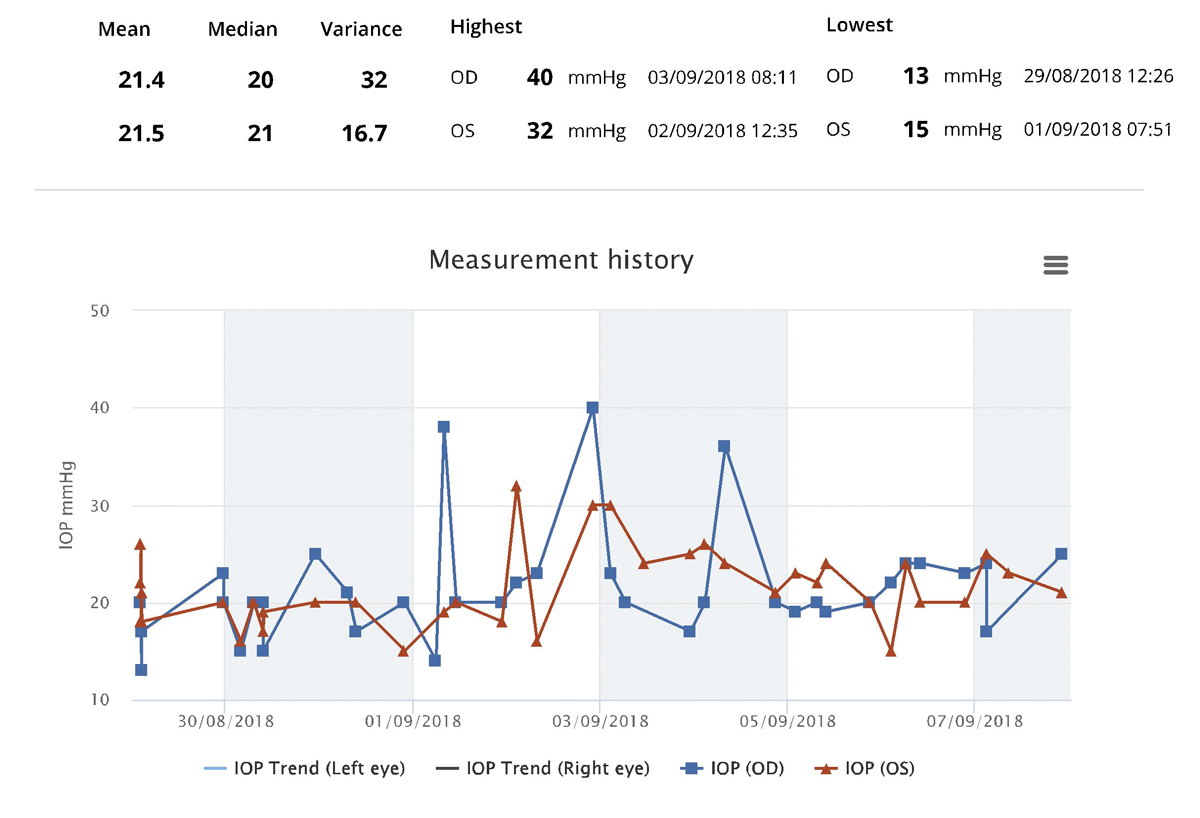
Fig. 3. iCare Home monitoring phasing results for a patient with pseudoexfoliation syndrome and no structural or functional evidence of glaucoma. In-office IOP measurements for this patient ranged between 14mm Hg to 19mm Hg OD and 15mm Hg to 19mm Hg OS. Click image to enlarge. |
Beyond Traditional Strategies
Recent developments in testing technologies have modernized the workup for diagnosing and monitoring glaucoma. One such example is the introduction of shorter test algorithms for assessing VF such as SITA Faster, which has been shown to significantly reduce testing time while providing near identical results to slower test strategies such as SITA Fast.27 A major obstacle to assessing visual function in glaucoma has been the variable nature of perimetric test results, which confounds assessment of the structure-function relationship and disease progression.28
Despite many authoritative sources recommend performing multiple VFs to overcome this obstacle and improve the amount of useful clinical data for glaucoma diagnosis or monitoring,22,28 previous work has shown these recommendations are not widely adopted into clinical practice with the majority of newly diagnosed open-angle glaucoma patients receiving fewer than three VFs within the first two years after diagnosis with an average of less than one field per year during follow-ups.22.28,29 The development of shorter testing algorithms allows for multiple field tests to be routinely performed at each visit to obtain a suitable number of field test results: this technique is known as “front-loading fields”.18,19 This technique increases the likelihood of obtaining a reliable VF result.19
By front-loading VFs at six-monthly intervals, catastrophic progression (defined as mean deviation progression rate of greater than -2dB/year) can be detected six to eight visits faster than a non-front-loading approach.18 By adopting a front-loading approach to VF testing using shorter test strategies, clinicians are able to improve glaucoma diagnosis confidence or progression detection rates, overcome issues with poor reliability associated with shorter tests and reduce the need for additional visits to obtain enough usable VF data.18,19
Another recent addition to traditional strategies for glaucoma care is the adoption of “glaucoma supplementary testing” through the addition of ancillary tests that aim to help clinicians with risk stratification and treatment titration. There has been a move away from single applanation pressure measurements to a more holistic approach to assessing IOP characteristics such as diurnal fluctuations or peak IOP.30 As discussed above, identifying the peak IOP can guide treatment selection and phenotyping of glaucoma to assist with risk stratification.26 Previous work has shown almost 70% of peak IOPs are measured outside of regular office hours with a predilection for peaking at nighttime.31
While historically patients were required to be hospitalized to obtain these measurements, the development of new technologies and techniques such as the water-drinking test or patient-driven home-monitoring devices for measuring IOP has enabled comprehensive evaluation of IOP to be feasibly implemented in practice.32 Recent work has shown IOP peaks identified with the water-drinking test and the iCare Home device to be highly comparable; thus, these can be used interchangeably if needed.33 Identifying a patient’s peak IOP can help clinicians set treatment targets and stratify progression risk.34 It can also be used to identify potential intraocular spikes that occur out of office in patients with treated but progressive glaucoma despite IOPs appearing to be on target during in-office measurements.31
An example of iCare Home phasing results for a patient with psuedoexfoliative syndrome with no structural evidence of glaucoma is shown in Figure 3. In-office IOPs measured across three visits ranged between 14mm Hg to 19mm Hg OD and 15mm Hg to 19mm Hg OS. iCare Home monitoring was deployed to assess the extent of her diurnal pressure fluctuations. This revealed a peak pressure of 40mm Hg OD and 32mm Hg OS. Given these findings, she was started on Travatan eyedrops (travopost ophthalmic solution, Novartis) at night in both eyes.
Clinical tip #3: Adding newer techniques and technologies such as front-loading fields or at-home IOP monitoring devices adds an extra dimension to glaucoma assessments.
 |
|
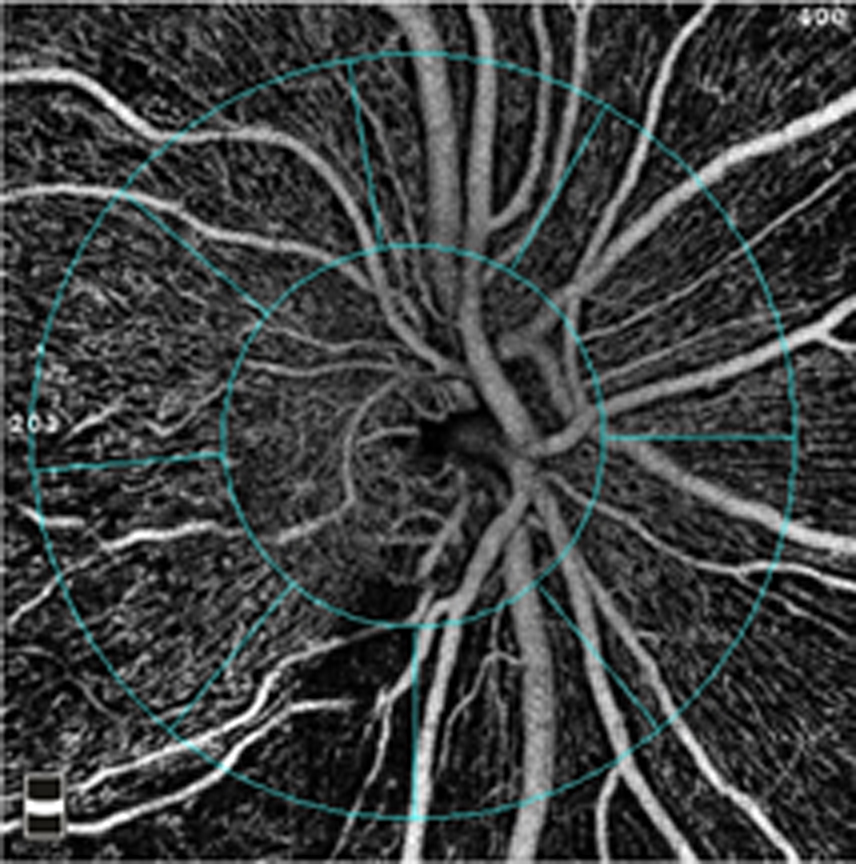
Fig. 4. By monitoring blood flow within the retina, OCT-A provides a way to assess the health of the ganglion cells that are affected in glaucoma. Photo: Julie Rodman, OD, Msc. Click image to enlarge. |
Holistic Care
In addition to assessing for out-of-office IOP spikes, 31 clinicians should consider the role of systemic comorbidities in contributing to glaucoma disease progression. The pathophysiology of glaucoma is complex, involving not only intraocular pressure but also vascular flow to the optic nerve head.31,35 As such, systemic vascular disease may impact the risk and management of patients with glaucoma.36 Several large-scale studies have highlighted associations between common vascular and metabolic diseases, including hypertension and diabetes, and the development and progression of glaucoma.37-39
In patients with on-target IOPs who continue to demonstrate glaucoma progression, it may be necessary to consider the role of systemic vascular diseases. Further, although vascular risk factors have been classically associated with normal tension glaucoma, it is now recognized that it is also relevant to high pressure phenotypes.40 Clinicians therefore need to consider vascular contributions irrespective of baseline pressures.
A focal point in the pathophysiological pathway between systemic vascular disease and glaucoma progression is the effect each condition has on ocular perfusion pressure around the optic nerve head.41 Technologies such as OCT angiography (OCT-A) may facilitate the measurement of ocular blood flow (Figure 4).42 However, there remains limited information on how to correlate outputs from OCT-A with risk related to vascular disease. It is possible for clinicians to estimate ocular perfusion pressure by considering mean arterial pressure and IOP.43 However, similar to OCT-A indices, there is no evidence-based cutoff for a target ocular perfusion pressure.
Much like out-of-office IOP measurements, there may be value in obtaining ambulatory blood pressure measurements to examine its diurnal variation, especially nocturnally.44,45 Specifically, the concept of diurnal ocular perfusion pressure relates to the prescription of topical beta-blocker therapy for glaucoma. It is now recognised that beta-blocker medications dosed once daily in the morning provides comparable IOP control to twice-daily medications.46 Given the option to dose morning or night, it may be preferable to dose in the morning to reduce the potential effects on nocturnal blood pressure.47
Systemically, the optometrist or ophthalmologist can also liaise with the patient’s other doctors to optimize control of the systemic vascular risk factors. A strategy such as 24-hour ambulatory blood pressure measurement in conjunction with IOP phasing can provide valuable insights into the ocular perfusion pressure throughout the day.48 Clinically, we must recognize that blood pressure that is overly reduced through medications potentially increases the risk of glaucoma progression.44,45
Aside from the intimate link between ocular perfusion pressure and systemic blood pressure, the control of other systemic diseases may play a role in glaucoma progression.36 Some studies have suggested that elevated blood sugar levels may be associated with higher IOPs and glaucoma progression risk.49 Other conditions in which blood flow is dysregulated, such as obstructive sleep apnea, vasospastic disorders (including migraine) and thyroid disease, may also present a similar increase in risk.50-52 The presence of glaucoma progression with these comorbidities may warrant communication with the patient’s other doctors to optimize their management, as control of those factors may also assist in glaucoma management.
Clinical tip #4: Optimizing a patient’s glaucoma care extends beyond testing in the consulting room. Encouraging optimal control of a patient’s vasculopathic risk factors has implications for disease progression.
Takeaways
Because glaucoma is a chronic disease, the delivery of care encompasses many aspects that range from accurate diagnosis to systemic implications for ongoing management.
While the multifaceted nature of care may present several challenges to clinicians, they also present the opportunity for these clinicians to apply a personalized and holistic approach to improving patient outcomes.
Dr. Wang leads the Glaucoma/Neuro-ophthalmology unit at the Centre for Eye Health. She received numerous clinical and academic awards during her undergraduate optometry degree, including a research scholarship for her work in the Retinal Networks Laboratory.
Dr Phu is clinician-scientist, holding the position of lecturer at the School of Optometry and Vision Science, UNSW. He has published extensively in the field of basic vision science and clinical aspects of glaucoma and maintains a research program in translational clinical research to improve patient care. They have no financial interests to disclose.
1. Tham YC, Li X, Wong TY, et al. Global prevalence of glaucoma and projections of glaucoma burden through 2040: a systematic review and meta-analysis. Ophthalmology. 2014;121(11):2081-90. 2. Phu J, Agar A, Wang H, et al. Management of open-angle glaucoma by primary eye-care practitioners: toward a personalised medicine approach. Clin Exp Optom. 2021;104(3):367-84. 3. Ha A, Kim CY, Shim SR, et al. Degree of myopia and glaucoma risk: a dose-response meta-analysis. Am J Ophthalmol. 2022;236:107-19. 4. Zemborain ZZ, Jarukasetphon R, Tsamis E, et al. Optical coherence tomography can be used to assess glaucomatous optic nerve damage in most eyes with high myopia. J Glaucoma. 2020;29(10):833-45. 5. Jonas JB, Wang YX, Dong L, Panda-Jonas S. High Myopia and glaucoma-like optic neuropathy. Asia Pac J Ophthalmol (Phila). 2020;9(3):234-8. 6. Tan NYQ, Sng CCA, Ang M. Myopic optic disc changes and its role in glaucoma. Curr Opin Ophthalmol. 2019;30(2):89-96. 7. Heijl A, Bengtsson B, Hyman L, Leske MC. Natural history of open-angle glaucoma. Ophthalmology. 2009;116(12):2271-6. 8. Jonas JB, Nagaoka N, Fang YX, et al. Intraocular Pressure and glaucomatous optic neuropathy in high myopia. Invest Ophthalmol Vis Sci. 2017;58(13):5897-906. 9. Kohlhaas M, Spoerl E, Boehm AG, Pollack K. A correction formula for the real intraocular pressure after LASIK for the correction of myopic astigmatism. J Refract Surg. 2006;22(3):263-7. 10. Goetz LH, Schork NJ. Personalized medicine: motivation, challenges and progress. Fertil Steril. 2018;109(6):952-63. 11. Dhawan M, Hans T, Sandhu PS, Midha N. Evaluation of vision-related quality of life in patients with glaucoma: a hospital-based study. J Curr Glaucoma Pract. 2019;13(1):9-15. 12. Quaranta L, Riva I, Gerardi C, Oddone F, Floriani I, Konstas AG. Quality of life in glaucoma: a review of the literature. Adv Ther. 2016;33(6):959-81. 13. McMonnies CW. Glaucoma history and risk factors. J Optom. 2017;10(2):71-8. 14. Oliver JE, Hattenhauer MG, Herman D, et al. Blindness and glaucoma: a comparison of patients progressing to blindness from glaucoma with patients maintaining vision. Am J Ophthalmol. 2002;133(6):764-72. 15. Peters D, Bengtsson B, Heijl A. Factors associated with lifetime risk of open-angle glaucoma blindness. Acta Ophthalmol. 2014;92(5):421-5. 16. Chen PP. Blindness in patients with treated open-angle glaucoma. Ophthalmology. 2003;110(4):726-33. 17. Kooner KS, AlBdoor M, Cho BJ, Adams-Huet B. Risk factors for progression to blindness in high tension primary open angle glaucoma: Comparison of blind and nonblind subjects. Clin Ophthalmol. 2008;2(4):757-62. 18. Phu J, Kalloniatis M. The Frontloading Fields Study (FFS): detecting changes in mean deviation in glaucoma using multiple visual field tests per clinical visit. Transl Vis Sci Technol. 2021;10(13):21. 19. Phu J, Kalloniatis M. Viability of performing multiple 24-2 visual field examinations at the same clinical visit: the Frontloading Fields Study (FFS). Am J Ophthalmol. 2021;230:48-59. 20. Sawada A, Manabe Y, Yamamoto T, Nagata C. Long-term clinical course of normotensive preperimetric glaucoma. Br J Ophthalmol. 2017;101(12):1649-53. 21. Garway-Heath DF, Crabb DP, Bunce C, et al. Latanoprost for open-angle glaucoma (UKGTS): a randomised, multicentre, placebo-controlled trial. Lancet. 2015;385(9975):1295-304. 22. Crabb DP, Garway-Heath DF. Intervals between visual field tests when monitoring the glaucomatous patient: wait-and-see approach. Invest Ophthalmol Vis Sci. 2012;53(6):2770-6. 23. Vianna JR, Danthurebandara VM, Sharpe GP, et al. Importance of normal aging in estimating the rate of glaucomatous neuroretinal rim and retinal nerve fiber layer loss. Ophthalmology. 2015;122(12):2392-8. 24. Konstas AG, Kahook MY, Araie M, et al. Diurnal and 24-h intraocular pressures in glaucoma: monitoring strategies and impact on prognosis and treatment. Adv Ther. 2018;35(11):1775-804. 25. Gazzard G, Konstantakopoulou E, Garway-Heath D, et al. Selective laser trabeculoplasty versus eye drops for first-line treatment of ocular hypertension and glaucoma (LiGHT): a multicentre randomised controlled trial. Lancet. 2019;393(10180):1505-16. 26. Huang J, Katalinic P, Kalloniatis M, et al. Diurnal intraocular pressure fluctuations with self-tonometry in glaucoma patients and suspects: a clinical trial. Optom Vis Sci. 2018;95(2):88-95. 27. Heijl A, Patella VM, Chong LX, et al. A new SITA perimetric threshold testing algorithm: construction and a multicenter clinical study. Am J Ophthalmol. 2019;198:154-65. 28. Chauhan BC, Garway-Heath DF, Goñi FJ, et al. Practical recommendations for measuring rates of visual field change in glaucoma. Br J Ophthalmol. 2008;92(4):569-73. 29. Fung SS, Lemer C, Russell RA, et al. Are practical recommendations practiced? A national multi-centre cross-sectional study on frequency of visual field testing in glaucoma. Br J Ophthalmol. 2013;97(7):843-7. 30. Kim SH, Lee EJ, Han JC, et al. The effect of diurnal fluctuation in intraocular pressure on the evaluation of risk factors of progression in normal tension glaucoma. PLoS One. 2016;11(10):e0164876. 31. Barkana Y, Anis S, Liebmann J, et al. Clinical utility of intraocular pressure monitoring outside of normal office hours in patients with glaucoma. Arch Ophthalmol. 2006;124(6):793-7. 32. Susanna R, Jr., Clement C, Goldberg I, Hatanaka M. Applications of the water drinking test in glaucoma management. Clin Exp Ophthalmol. 2017;45(6):625-31. 33. Phu J, Masselos K, Kalloniatis M. Deployment of the water drinking test and iCare Home phasing for intraocular pressure profiling in glaucoma evaluation. Optom Vis Sci. 2021;98(11):1321-31. 34. Tajunisah I, Reddy SC, Fathilah J. Diurnal variation of intraocular pressure in suspected glaucoma patients and their outcome. Graefes Arch Clin Exp Ophthalmol. 2007;245(12):1851-7. 35. Flammer J, Orgül S. Optic nerve blood-flow abnormalities in glaucoma. Prog Retin Eye Res. 1998;17(2):267-89. 36. Funk RO, Hodge DO, Kohli D, Roddy GW. multiple systemic vascular risk factors are associated with low-tension glaucoma. J Glaucoma. 2022;31(1):15-22. 37. Hsu E, Desai M. Glaucoma and systemic disease. Life (Basel). 2023;13(4). 38. Leeman M, Kestelyn P. Glaucoma and blood pressure. Hypertension. 2019;73(5):944-50. 39. Zhao YX, Chen XW. Diabetes and risk of glaucoma: systematic review and a meta-analysis of prospective cohort studies. Int J Ophthalmol. 2017;10(9):1430-5. 40. Rafla D, Khuu SK, Kashyap S, et al. Visualising structural and functional characteristics distinguishing between newly diagnosed high-tension and low-tension glaucoma patients. Ophthalmic Physiol Opt. 2023;43(4):771-87. 41. Chan KKW, Tang F, Tham CCY, et al. Retinal vasculature in glaucoma: a review. BMJ Open Ophthalmol. 2017;1(1):e000032. 42. Rao HL, Pradhan ZS, Suh MH, et al. Optical coherence tomography angiography in glaucoma. J Glaucoma. 2020;29(4):312-21. 43. Zheng Y, Wong TY, Mitchell P, et al. Distribution of ocular perfusion pressure and its relationship with open-angle glaucoma: the Singapore Malay Eye Study. Invest Ophthalmol Vis Sci. 2010;51(7):3399-404. 44. Charlson ME, de Moraes CG, Link A, et al. Nocturnal systemic hypotension increases the risk of glaucoma progression. Ophthalmology. 2014;121(10):2004-12. 45. Graham SL, Drance SM. Nocturnal hypotension: role in glaucoma progression. Surv Ophthalmol. 1999;43 Suppl 1:S10-6. 46. Brooks AM, Gillies WE. Ocular beta-blockers in glaucoma management. Clinical pharmacological aspects. Drugs Aging. 1992;2(3):208-21. 47. Hayreh SS, Podhajsky P, Zimmerman MB. Beta-blocker eyedrops and nocturnal arterial hypotension. Am J Ophthalmol. 1999;128(3):301-9. 48. Turner JR, Viera AJ, Shimbo D. Ambulatory blood pressure monitoring in clinical practice: a review. Am J Med. 2015;128(1):14-20. 49. Choi JA, Park YM, Han K, et al. Fasting plasma glucose level and the risk of open angle glaucoma: Nationwide population-based cohort study in Korea. PLoS One. 2020;15(9):e0239529. 50. Bilgin G. Normal-tension glaucoma and obstructive sleep apnea syndrome: a prospective study. BMC Ophthalmology. 2014;14(1):27. 51. Huang J-Y, Su C-C, Wang T-H, Tsai IJ. Migraine and increased risk of developing open angle glaucoma: a population-based cohort study. BMC Ophthalmology. 2019;19(1):50. 52. Cross JM, Girkin CA, Owsley C, McGwin G, Jr. The association between thyroid problems and glaucoma. Br J Ophthalmol. 2008;92(11):1503-5. |
