Optical coherence tomography (OCT) is truly an engineering marvel, with scan resolutions ever-increasing, wider areas of tissue imageable than ever before and more layers of the eye included in every new instrument iteration. It’s been cleverly described as an “optical biopsy.”1 That box sitting in the special testing room at our clinic is able to biopsy in vivo tissue using light. Not only is that cool, but just think of how few other medical specialties have access to a quick, accurate, painless and noninvasive “biopsy” of the organ they are caring for?
Let’s briefly review where this amazing technology came from, where it is now and where it’s headed, then review best practices on how to use OCT to diagnose and manage glaucoma.
Development of a Marvel
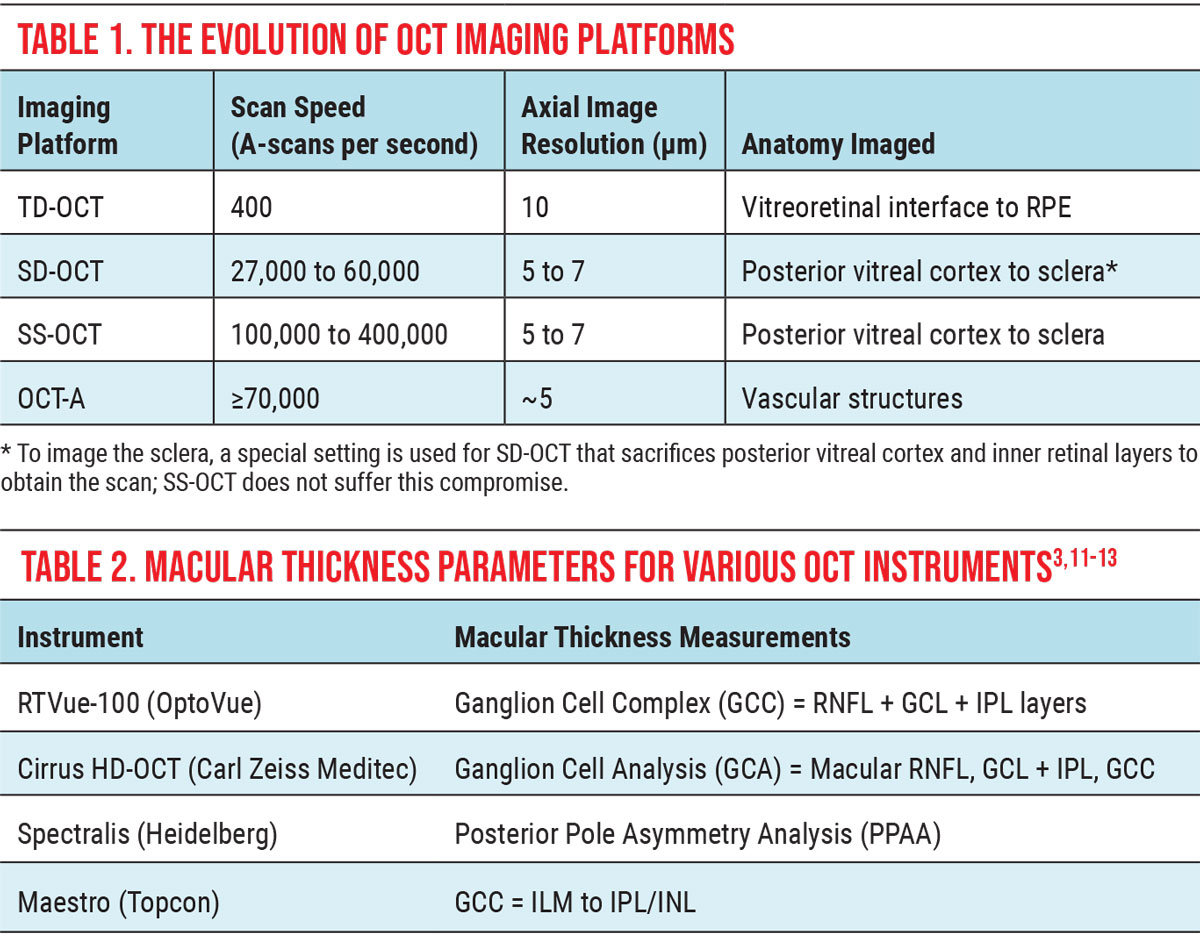
The concept of OCT was first proposed in 1971, but it took another 20 years for the first optical coherence tomogram to be obtained—an in vitro scan of the retina. By 1993, in vivo OCT images of the optic nerve and macula were obtained, further accelerating commercial development. Early OCT instruments used time-domain imaging with speeds of 400 A-scans per second to analyze ocular tissue with resolutions of 10 to 20µm to produce the now familiar temporal, superior, nasal, inferior, temporal (TSNIT) curves and RNFL pie charts (Table 1).2
|
| Click image to enlarge. |
The early 2000s ushered in spectral-domain OCT (SD-OCT), which is the current industry standard, with speeds of 50,000 to 100,000 A-scans per second and resolutions of 5µm to 7µm. However, in 2012, swept-source OCT (SS-OCT) was successfully commercialized, further enhancing OCT capability, followed in 2014 by OCT-angiography (OCT-A), a new add-on module for SD-OCT instruments that tracks movement in vasculature to indirectly evaluate blood flow.
In the near-term, SS-OCT and OCT-A both have approximately 5µm resolutions with scan speeds of up to 400,000+ A-scans per second and up to 70,000 A-scans per second, respectively. Both are poised to further enhance our diagnostic and management capabilities with their ultra-resolution and novel technology.
Image Acquisition and Interpretation
While anterior segment OCT continues to develop, in the posterior segment we can now image from the vitreal cortex to the sclera depth-wise, while capturing single images that span from nasal to the optic disc to temporal to the fovea. Scan protocols vary among manufacturers but share many similarities. Using both A-scan and B-scan technology, OCT instruments measure the amount of backscatter from the coherent light introduced into the eye. The more reflective the material encountered, the brighter its appearance on the OCT image. This allows analysis of each layer of the retina individually, as well as the optic nerve.
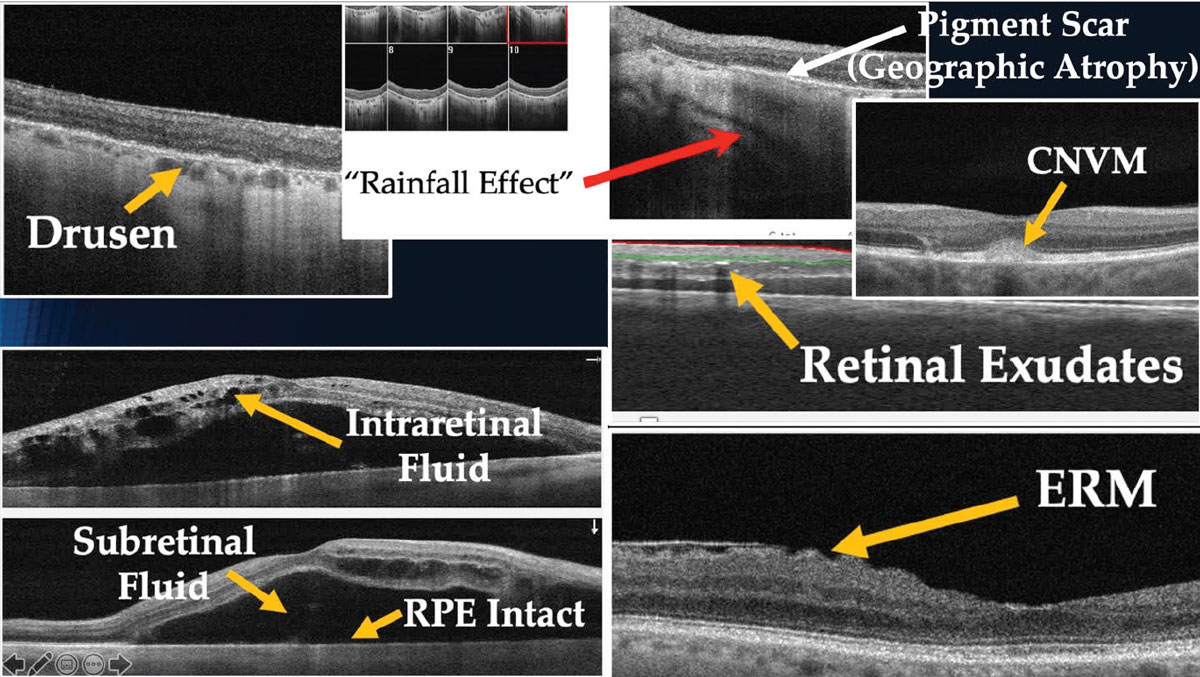
Within the retina, abnormalities such as lipid exudates, pigment, epiretinal membranes (ERM) and chorioretinal scars are brighter white; while subretinal fluid, edema and areas of detachment are optically dark (Figure 1).
Glaucoma Management Using OCT
Glaucoma is a group of progressive optic neuropathies characterized by degeneration of retinal ganglion cells (RGCs) and their axons, resulting in retinal nerve fiber layer (RNFL) loss, neuroretinal rim thinning and corresponding visual field (VF) deterioration.3,4 Since it’s one of the leading causes of preventable blindness, early detection and intervention are vital to prevent vision loss for patients with glaucoma. OCT allows clinicians to monitor for glaucomatous structural damage involving the optic nerve, peripapillary RNFL and macula, as well as to correlate that structural damage to functional vision loss.3
|
|
Fig. 1. Characteristics of ocular abnormalities on OCT images. Click image to enlarge. |
Circumpapillary RNFL measurements have become a commonly used parameter in glaucoma management for assessing RGC structural loss. However, this method of analysis only looks at the axonal portion of RGCs without considering the cell bodies or dendrites, potentially missing early glaucomatous damage.3,5 For these reasons, examination of the macula and, more specifically its ganglion cell complex (GCC), has arguably become the standard of care in detecting early glaucomatous changes.6
Approximately 30% of RGCs are located within the macula (despite the fact that the macula only represents 2% of the retina) resulting in a much thicker retinal ganglion cell layer (GCL) than in the circumpapillary area.7 Consequently, macular GCC thinning has been identified as an early indicator of glaucomatous structural damage.3-8
|
|
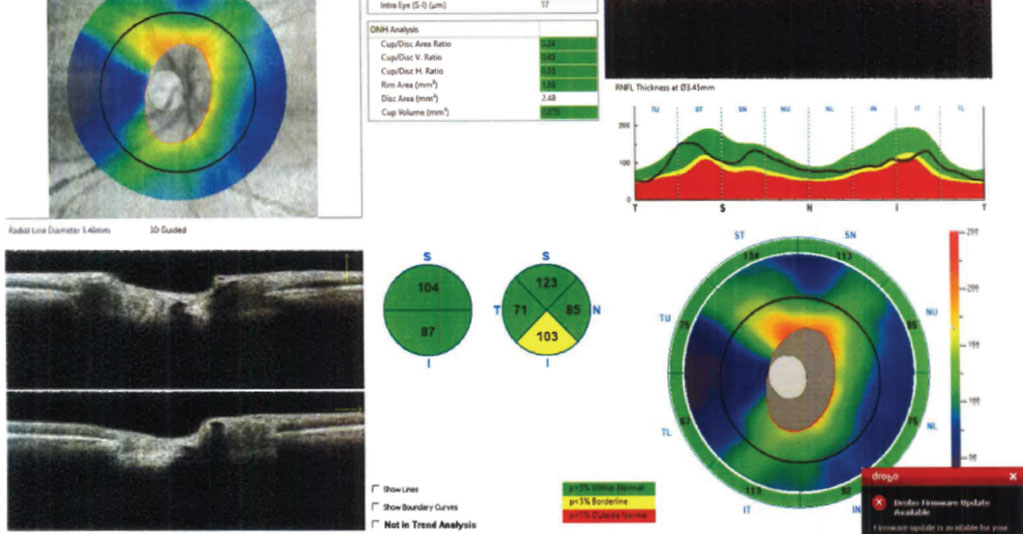
Fig. 2. A normal tension glaucoma suspect’s RNFL scan of the ONH. The data is reliable and grossly normal, with the exception of the inferior RNFL pie chart thickness. Click image to enlarge. |
The GCC is comprised of the three retinal layers that are damaged in glaucoma: the RNFL, the GCL and the inner plexiform layer (IPL). It is hypothesized that the earliest changes are seen as a loss of dendrites (IPL), resulting in subsequent apoptosis of RGC bodies (GCL) and axons (RNFL).5 Previous studies have attempted indirect estimation of RGCs through macular thickness analysis; however, results were found inferior to GCC measurements and inaccurate due to the significant influence from outer retinal layers.3,9,10 Newer OCT instrumentation allows for automated segmentation of macular layers, completely excluding the effect of outer retinal layers.
However, GCC measurements are not always reliable indicators of progression, especially in patients who present with coincident macular disease (e.g., macular degeneration, vitreomacular traction, epiretinal membrane), which can artificially increase or decrease foveal thickness measurements. In these instances, RNFL analysis may prove a more accurate indicator of glaucomatous progression.
Table 2 shows three commonly used OCT instruments and the parameters for which the GCC is calculated.3,11-13 Although GCC analysis techniques vary among the different instruments, all accurately and effectively allow for quantification of the innermost retinal layers and detect pre-perimetric changes related to glaucoma. Further, to better identify damage, the nasal-superior-inferior-temporal-nasal (NSITN) curve and schematics include a map of the region just outside the macula, where most of the 24-2 VF test points fall.14
Many studies have shown GCC parameters to be a superior tool in early detection of glaucoma compared to those of the circumpapillary RNFL in patients with normal macular anatomy.3-5 More specifically, one study reports that the most accurate GCC parameters for detecting early glaucomatous changes are average and inferior GCC thicknesses.-3 Another found that one of the most sensitive predictors of glaucomatous progression is focal loss volume in the GCC and RNFL.15
Additionally, patients who are myopic present another clinical scenario where macular thickness analysis may prove superior to RNFL measurements. Glaucoma detection in highly myopic individuals can be challenging, given the deformation of the retina and optic nerve that accompanies axial elongation of the eye. Unlike RNFL, the diagnostic accuracy of the GCC is not affected by increasing axial length and, therefore, may prove one of the best parameters for detecting the presence and progression of glaucoma in cases where tilted nerves and peripapillary atrophy are present and the optic disc limits cannot be set.4,6
Few studies have demonstrated the superiority of RNFL over GCC analysis in detecting pre-perimetric glaucoma, early glaucoma and glaucoma progression.5 However, it is important to note that GCC measurements are not always reliable indicators of progression, especially in patients who present with macular diseases, which can artificially thin or thicken foveal thickness. In these instances, RNFL analysis may prove a more accurate indicator of glaucomatous progression. As a result, practitioners should incorporate macular GCC measurements as an adjunct to RNFL parameters for all glaucoma patients and glaucoma suspects to aid early detection, diagnosis and disease management to prevent blindness.
Thankfully, many OCT manufacturers have begun incorporating macular scans as part of their glaucoma imaging protocols and analyses (e.g., Carl Zeiss Meditec’s PanoMap, the Hood report from both Topcon and Heidelberg, and Optovue’s ONH/GCC Report).7
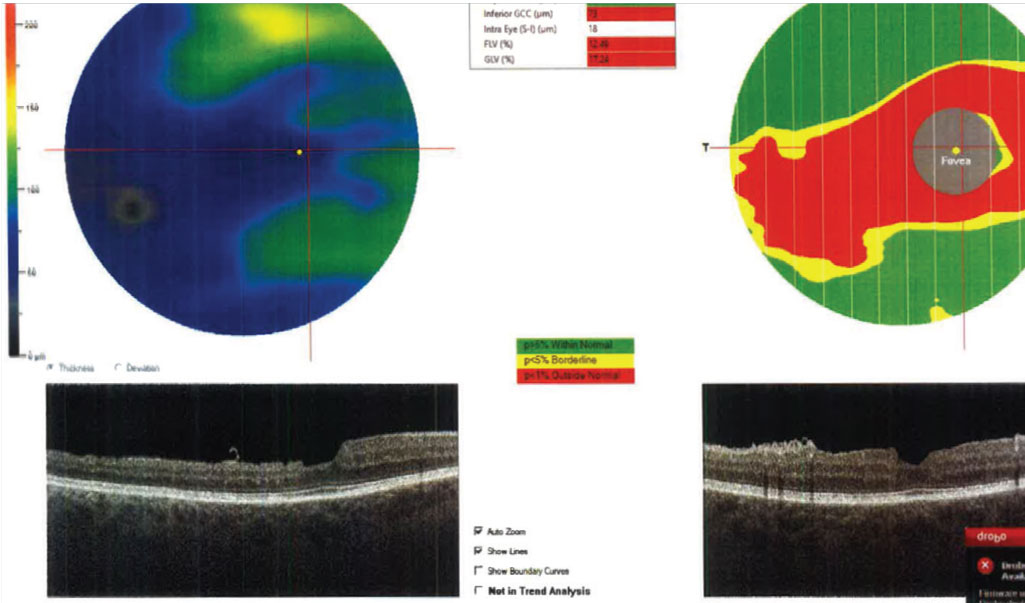
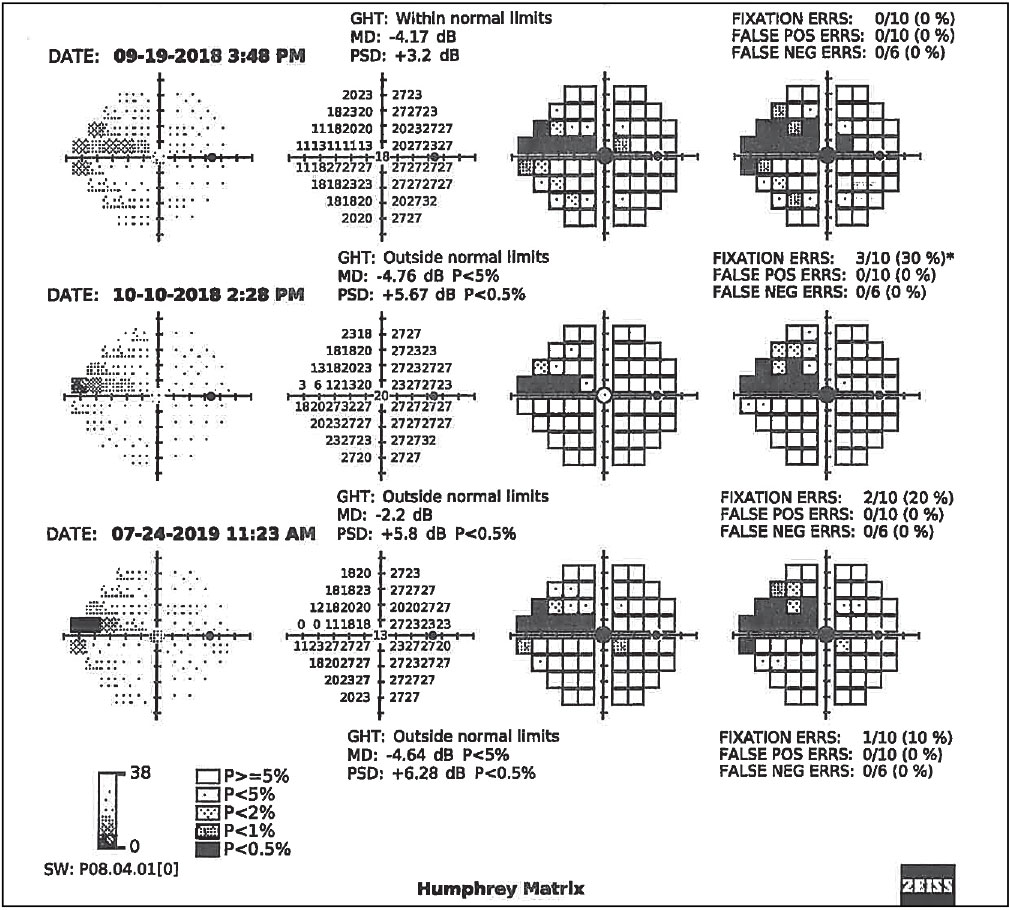
Case in point: Figure 2 shows the RNFL OCT scan of a normal tension glaucoma suspect’s right eye using the Optovue Avanti. The scan is reliable and all parameters appear relatively unremarkable with the exception of the inferior RNFL pie chart thickness, which is borderline but still 103µm thick. That same day, the patient’s macular GCC was also analyzed (Figure 3), which provided additional, clinically useful information that presented a markedly different clinical picture. Even factoring in the coincident epiretinal membrane, the GCC scan is highly suggestive of structural glaucomatous damage that was further confirmed by frequency-doubling visual fields (Figure 4).
|
|
Fig 3. The GCC analysis of the macular region on the same patient as Fig. 2, taken on the same day. Results are reliable and indicated significant GCC thinning in the macular region. Click image to enlarge. |
When only analyzing the RNFL in isolation, it may have been easy to miss the inferior thinning and just schedule the patient back in another year, rather than intervening as was clearly indicated by the VF and GCC scan.
Common Confounders to OCT Interpretation
Knowing what to scan and how to interpret the OCT is vital to glaucoma care, but obtaining accurate, reliable ophthalmic images is also crucial for proper diagnosis and treatment. When image quality is unreliable or subpar, inaccurate data confounds image interpretation—potentially leading to improper clinical decision-making. SD-OCT has gained widespread use among clinicians for its ability to assist with diagnosis and management of ocular conditions; however, one must understand the nuances of the data obtained in order to use the technology effectively.
|
|
Fig. 4. Serial visual field results using Zeiss’s frequency doubling technology on the right eye of the patient in Figs. 2 and 3, confirming functional VF defects in the form of a nasal step progressing to a superior arcuate scotoma. Click image to enlarge. |
There are three main sources of artifact that can erroneously influence data during OCT image acquisition. These confounders can be classified as patient-dependent, operator-dependent and device-dependent.16,17
During OCT image acquisition, light from the device is emitted toward the structure being analyzed, then incident light is back-scattered and captured for processing.2 Obstacles that block the pathway of light can contribute to poor scan quality and subsequently poor reliability metrics, yielding potentially providing misleading information.
Patient-dependent. Examples that can influence scan quality include coincident ocular pathology, as well as patient fixation and cooperation during image capture. Patients with glaucoma often have other co-existing conditions such as cataracts and ocular surface disease, given their increased prevalence with age and use of hypotensive agents.
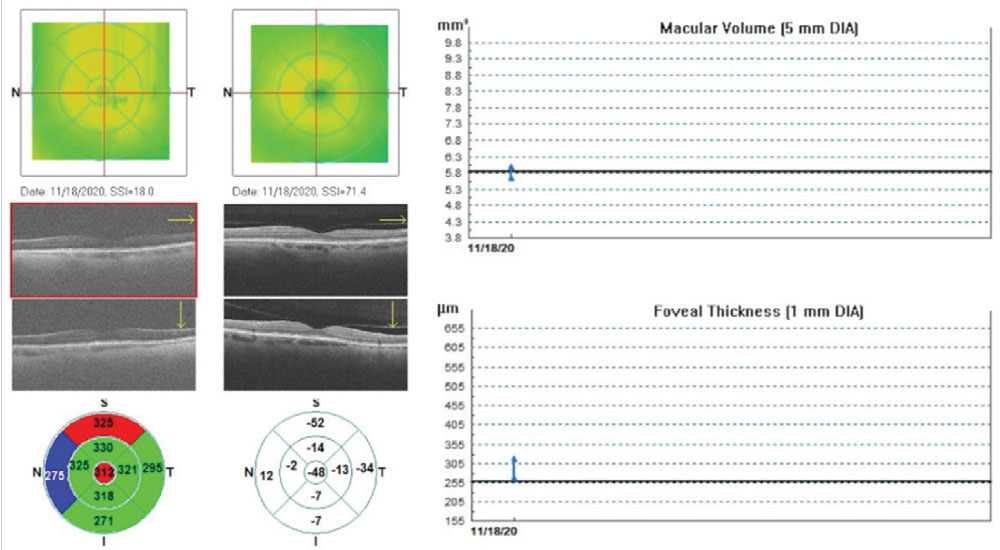
Many studies have demonstrated the direct correlation between reduced scan quality and decreased tissue thickness.18,19 Figure 5 demonstrates this relationship on a patient with dense posterior subcapsular opacification (PCO) immediately pre- and post-YAG capsulotomy. Foveal thickness is falsely reduced prior to removing the opacity, resulting in a clinically significant increase in RNFL tissue thickness once removed.
|
|
Fig. 5. Optovue retinal map change analysis of a patient with grade 3 PCO immediately pre- and post-YAG capsulotomy. Significant improvement in image resolution was obtained, demonstrating artifactual changes in macular volume and foveal thickness and decreased average RNFL thickness, compared with the same eye correctly imaged on the right. Click image to enlarge. |
If we had diagnosed this patient with glaucoma at some point after cataract surgery when the posterior capsule was clear, obtained baseline OCT scans, initiated glaucoma treatment and they then developed PCO over the next several years, the trend-based RNFL analysis would’ve indicated progressive thinning suggestive of worsening disease. In actuality, it was just due to PCO formation. Take the entire clinical picture into account before making clinical decisions.
Instillation of artificial tears and having a patient blink before image capture are some possible solutions to improve scan quality in patients with and without dry eye. This can also help minimize blink artifacts, which are shown in Figure 6. The gaze-tracking feature on most instruments helps minimize the effects of blinking; however, the duration and position of a blink artifact during a scan can result in transient loss of data.
In addition to conditions that block the path of light of the device, it is equally important to determine how existing pathology influences OCT measurements. Vitreous traction and epiretinal membranes are some examples that cause false elevation of tissue thickness, while peripapillary atrophy and scarring results in loss of tissue that can mimic changes related to the glaucomatous process. By minimizing these variables and understanding their effects, optometrists can more accurately determine stability in diseased states.
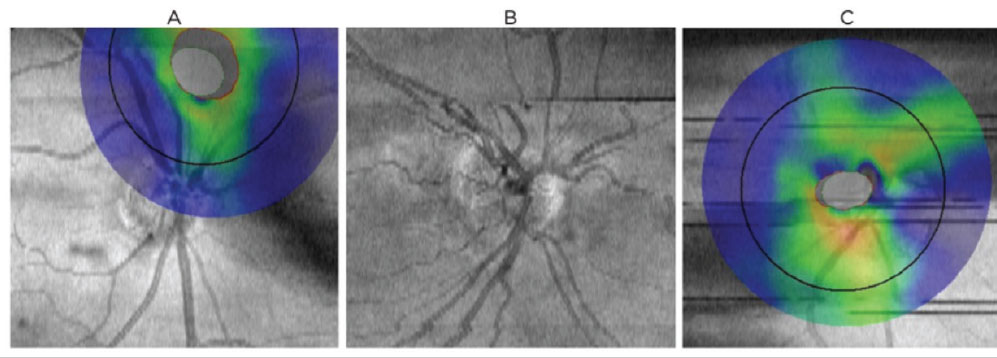
Operator-dependent. These variables are another significant cause of OCT confounders, most of which can be avoided with proper training (Figure 6). Centration artifacts occur when the acquisition frame is not properly aligned over the structure being analyzed (Figure 6a). When monitoring for glaucoma, improper centration of the acquisition circle over the optic nerve can result in false thinning or elevation in various sectors or quadrants.
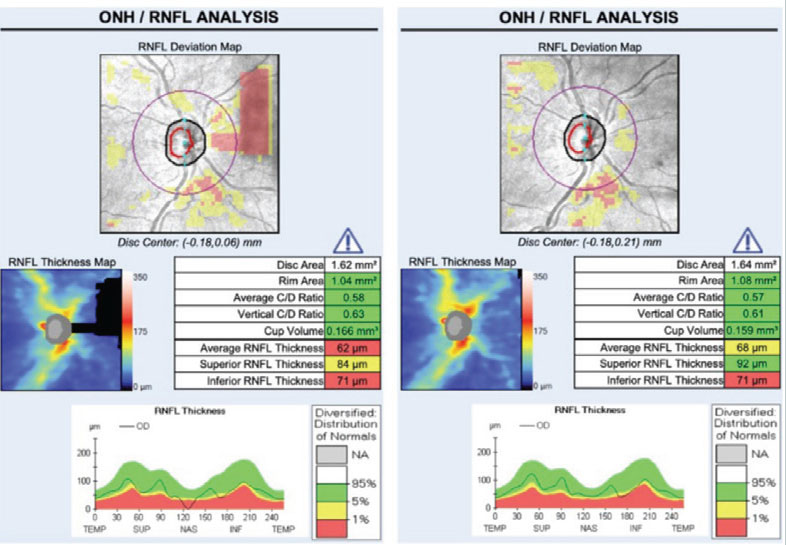
RNFL thickness is greatest at the optic nerve head and decreases as the distance away from the nerve increases.20-22 While mild shifts in scan position do not significantly alter RNFL measurements, moderate to severe misalignment can cause a shift in the TSNIT curve, resulting in artificial thinning or elevation.20 Truncation artifacts result when only a portion of the structure analyzed is in the acquisition frame (Figure 7). The area of missing data falsely underestimates the nasal tissue thickness. Appropriate alignment of data within the scan window ensures the most accurate measurements and ability to track progression.
Device-dependent. These errors occur when instrumentation improperly delineates retinal layers. These segmentation issues are commonly seen in patients who have high myopia, prominent posterior hyaloid membranes and media opacities as they affect image quality and make it difficult for the device to accurately determine retinal boundaries.23 These types of artifacts are sometimes easily overlooked on the final clinical printouts, potentially leading to errors in clinical interpretation. Physicians can limit the effects of such confounders by having access to raw data in the exam lane before making any significant treatment decisions.
|
|
Fig. 6. Common scan artifacts and confounders to OCT interpretation on the Optovue RTVue-100. (A) Centration artifact: poor target alignment of analyzed structures results in a false increase/decrease of tissue thickness. (B) Motion artifact, e.g., as results from head movement, saccades or breathing. Appears as misalignment of blood vessels and can lead to segmentation error. (C) Blink artifact: appears as horizontal gaps in data. Click image to enlarge. |
The influence of image quality on OCT metrics should be considered when analyzing data and making clinical decisions regarding a patient’s care. Before considering the metrics, one must first assess quality by looking at the scan accuracy, signal strength, centration and segmentation and by taking into consideration any ocular pathology that could affect the data. By increasing the accuracy and reliability of OCT data measurements, clinicians can further enhance their management of ocular pathology, thereby improving healthcare outcomes.
Having a general understanding of any potential normative database biases unique to an individual manufacturer’s OCT, relying on the manufacturer’s sophisticated trend-based analyses instead of just “eyeballing” it to look at trends over time, and recalling the normal age-related changes in RNFL and GCC which occur (~0.50µm per year of RNFL loss and ~0.25µm per year of GCC loss) are also critical to accurate OCT interpretation.24,25
Takeaways
Remember to assess the macula when diagnosing and managing glaucoma. If your OCT instrument does not automatically include the macula in its optic nerve/glaucoma analysis protocol, then image the macula separately to enhance clinical decision-making.
|
|
Fig. 7. Truncation artifact: structures being imaged (in this case the optic nerve/RNFL) are only partially included in the acquisition frame in the left image. Superior nasal loss of data results in incorrectly assumed thinning of the superior RNFL and a decrease in the average RNFL thickness compared with the same eye correctly imaged on the right. Click image to enlarge. |
For any OCT scan, prior to making any clinical decisions (and before looking at any colors on the printout), clinicians should always:
- Assess scan quality first.
- Look for any acquisition errors that may affect interpretation.
- Review the patient’s clinical history for pathological confounders.
- Assess results relative to normative databases.
- Consider trend-based analysis results (if available) prior to making clinical decisions.
- Account for normal age-related changes in RNFL and GCC.
Using these ever-improving OCT instruments while maximizing the accuracy and reliability of acquired images, scanning both the macula and the optic nerve and correctly interpreting the data will yield earlier and more precise clinical decisions regarding glaucoma diagnosis and management.
Dr. Reimold completed a residency in primary care and ocular disease, and is a staff optometrist at the Bond-Wroten Eye Clinics in southeast Louisiana.
Dr. Wroten is a staff optometrist and chief operating officer at the Bond-Wroten Eye Clinics and has lectured internationally and published numerous articles on a variety of topics in eye care. They have no financial interests to disclose.
1. Fujimoto JG, Pitris C, Boppart SA, Brezinski ME. Optical coherence tomography: an emerging technology for biomedical imaging and optical biopsy. Neoplasia. 2000;2(1-2):9-25. 2. Bhende M, Shetty S, Parthasarathy MK, Ramya S. Optical coherence tomography: A guide to interpretation of common macular diseases. Indian J Ophthalmol. 2018; 66(1):20-35. 3. Scuderi G, Fragiotta S, Scuderi L, Iodice CM, Perdicchi A. Ganglion cell complex analysis in glaucoma patients: what can it tell us? Eye Brain. 2020;12:33-44. 4. Kita Y, Soutome N, Horie D, Kita R, Hollό G. Circumpapillary ganglion cell complex thickness to diagnose glaucoma: A pilot study. Indian J Ophthalmol. 2017;65(1):41-7. 5. Dascalescu D, Corbu C, Coviltir V, et al. The ganglion cell complex as a useful tool in glaucoma assessment. Rom J Ophthalmol. 2018;62(4):300-3. 6. Rixon A. OCT in glaucoma management: Green isn’t always clean. Optometry Times. May 4, 2021. www.optometrytimes.com/view/oct-in-glaucoma-management-green-isn-t-always-clean. Accessed June 15, 2021. 7. Vidas S, Popović-Suić S, Novak Lauš K, et al. Analysis of ganglion cell complex and retinal nerve fiber layer thickness in glaucoma diagnosis. Acta Clin Croat. 2017;56(3):382-90. 8. Wang Y, Xin C, Li M, et al. Macular vessel density vs. ganglion cell complex thickness for detection of early primary open-angle glaucoma. BMC Ophthalmol. 2020;20(1):17. 9. Na JH, Lee K, Lee JR, et al. Detection of macular ganglion cell loss in preperimetric glaucoma patients with localized retinal nerve fiber defects by spectral-domain optical coherence tomography. Clin Exp Ophthalmol. 2013;41:870-80. 10. Damla A, Tuncay K, Feyza G, Bora Y. Comparison of Ganglion cell complex defect patterns of exfoliative glaucoma and prımary open angle glaucoma using optıcal coherence tomography. JOJ Ophthalmol. 2017;6(1):555677. 11. Alshareef, R.A., Goud, A., Mikhail, M. et al. Segmentation errors in macular ganglion cell analysis as determined by optical coherence tomography in eyes with macular pathology. Int J Retin Vitr. 2017;3:25. 12. Asrani S. Posterior pole assymetry analysis.Heidelberg Engineering. 2010. media.heidelbergengineering.com/uploads/Products-Downloads/99172-001_SPECTRALIS_Brochure_Posterior-Pole-Insert_EN.pdf. Accessed June 15, 2021. 13. Topcon Medical Systems. Precision and reliability for the Topcon 3D OCT-1 Maestro. Topcon. 2016. www.topcon.ca/wp-content/uploads/2019/05/Maestro-Precision-Reliability-0716.pdf. Accessed June 15, 2021. 14. Hood DC. Improving our understanding, and detection, of glaucomatous damage: an approach based upon optical coherence tomography (OCT). Prog Retin Eye Res. 2017;57:46-75. 15. Francis B, Chopra V. Managing glaucoma with OCT: secrets to success. Rev Ophthalmol. 2017;24(2):50-8. 16. Joshua SH, Giovanni T, Seth CN, et al. Factors affecting Cirrus-HD OCT optic disc scan quality: a review with case examples. J Ophthalmol 2015;2015:746150. 17. Teresa C. Chen, MD, et al. “Spectral-domain OCT: helping the clinician diagnose glaucoma: a report by the American Academy of Ophthalmology. Ophthalmology. 2018;125(11):1817-27. 18. Cheung, CYL. Leung, CK. A practical guide for interpretation of optical coherence tomography retinal nerve fiber layer measurement. J Curr Glaucoma Pract..2009; 3(1):9-13 19. Balasubramanian M, Bowd C, Vizzeri G, et al. Effect of image quality on tissue thickness measurements obtained with spectral domain-optical coherence tomography. Opt Express. 2009;17(5):4019-36. 20. Gabriele ML, Ishikawa H, Wollstein G, et al. Optical coherence tomography scan circle location and mean retinal nerve fiber layer measurement variability. Invest Ophthalmol Vis Sci. 2008;49(6):2315-21. 21. Robin R, Sandra SS, Glenn JJ. Evaluation of image artifact produced by optical coherence tomography of retinal pathology. Am J Ophthalmol. 2005;139(1):18-29. 22. Asrani S, Edghill B, Gupta Y, Meerhoff G. Optical coherence tomography errors in glaucoma. J Glaucoma. 2010;19(4):237-42. 23. Asrani S, Essaid L, Alder BD, Santiago-Turla C. Artifacts in spectral-domain optical coherence tomography measurements in glaucoma. JAMA Ophthalmol. 2014;132(4):396-402. 24. Leung CK, Yu M, Weinreb RN, Ye C, Liu S, Lai G, Lam DS. Retinal nerve fiber layer imaging with spectral-domain optical coherence tomography: a prospective analysis of age-related loss. Ophthalmology 2012;119:4:731-7. 25. Zhang X, Francis BA, Dastiridou A, Chopra V, Tan O, Varma R, Greenfield DS, Schuman JS, Huang D; Advanced Imaging for Glaucoma Study Group. Longitudinal and cross-sectional analyses of age effects on retinal nerve fiber layer and ganglion cell complex thickness by fourier-domain OCT. Transl Vis Sci Technol 2016;4:5:2:1. |
