Ease the Burden of GlaucomaThe July 2023 issue of Review of Optometry centers around one of the toughest diseases to diagnose and monitor: glaucoma. The 29th annual glaucoma report targets dozens of areas where some ODs struggle to move beyond the fundamentals. Check out the other articles featured in this issue: |
Once the diagnosis of glaucoma is made and there is ultimately a decision to treat it, an entirely new set of decisions arise that can lead to uncertainty for the practitioner and patient alike. Primarily, we need to determine whether our initial intervention is successful or unsuccessful, and can gauge this by seeing if the patient has progressed. If so, what is the rate of progression? Working within the confines of available technology to streamline confirmation of progression, we can subsequently personalize additional care as much as possible in order to prevent loss of vision and reduced quality of life due to glaucoma.
Confirm There is Progression
Despite having intervened, clinicians should not be surprised or dismayed when further progression occurs.1 Fortunately, when treated, most eyes will not progress at rates rapid enough to lead to vision loss. Although the majority of patients are not at risk of vision loss, there is still a minority (3% to 17%) that are.2-6 A major goal in longitudinal glaucoma care is to determine the rate of progression and prioritize fast progressors who are more likely to have a worse prognosis than slow progressors. Keep in mind the course of glaucoma is not always linear, and patients that have historically progressed slowly may change gears and show more rapid advancement of their conditions along the management road.7
An abundance of data is acquired in longitudinal glaucoma care, and the sheer volume can confound the task of confirming progression if not captured or analyzed appropriately. Here, we will discuss some of the more relevant clinical data collected and how to apply it.
Long-Term Monitoring
Given the chronic progressive nature of glaucoma, multiple variables must be frequently monitored on a customized, long-term basis. Important monitoring considerations are listed below.
Intraocular pressure (IOP). The statement that IOP is the only tangibly modifiable risk factor in glaucoma management is glaucoma dogma at this point. Although it’s accurate, it can create the impression that lowering IOP to a certain pre-determined level implies therapeutic success. More accurately, the stability of our patient’s individual glaucomatous optic neuropathy should be used to gauge the success or failure of our interventions. Let’s examine the relationship between IOP and progression and whether IOP levels have prognostic or confirmatory value in progression.
Major landmark studies have historically demonstrated that lowering IOP does, on average, reduce the percentage of patients who develop glaucoma and suffer progressive visual field loss.8-12 The problem with these findings is that a substantial proportion of patients in each of those studies continued to have visual field progression and none provided a universal level of IOP reduction that specifically guides us on how low it needs to go to blunt progression on an individual basis.13
Recently, it was quantitatively substantiated for the first time that adhering to and meeting the European Glaucoma Society’s severity of disease-based target IOP lowering guidelines resulted in decreasing the rate of visual field progression to that of normal age-related change (MD loss of -1.02dB/decade).14
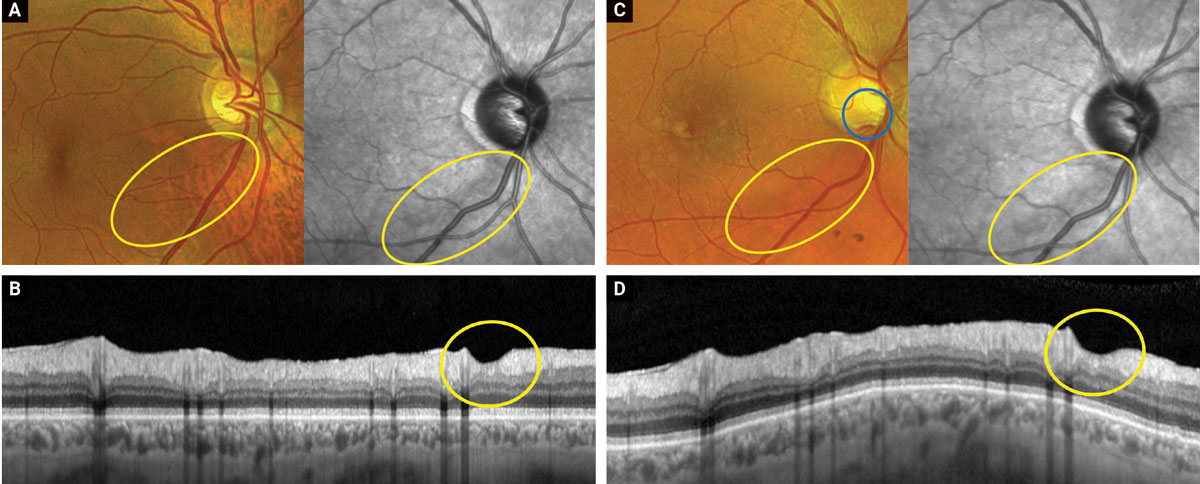 |
Figures A and B show color, near IR and OCT-B scan images of a glaucomatous inferior temporal wedge (yellow circles) from September 2022. Figures C and D show the same images taken in April of 2023. Note how the disc hemorrhage (blue circle, C) arises within the already present area of tissue loss. This is consistent with the proposed theory that disc hemorrhages are part of the continuum of loss and may not be standalone inciting events. Click image to enlarge. |
A recent study examined the relationship between OCT structural measurements, level of average IOP lowering and progression. IOP was shown to significantly impact the rate of global RNFL, isolated ganglion cell layer (GCL) and ganglion cell-inner plexiform layer (GC-IPL) loss, with each additional 1mm Hg mean increase being associated with faster loss of 0.05µm/year of RNFL, 0.021µm/year GCL and 0.032µum/yr of GC-IPL thickness, respectively.15,16 Notably, in the most aggressively managed group (those achieving an average IOP under 15mm Hg at all visits), 9% of patients continued to undergo rapidly progressing RNFL deterioration (>2µm/year).15
The above findings all align to support the contention that higher IOP results in more rapid progression while more aggressive IOP lowering delays progression, on average. However, simply lowering IOP in our individual patients does not substantiate that we, as practitioners, have slowed glaucoma, nor does an inability to show a lower IOP confirm that glaucoma has progressed.
Recently, it was suggested that using SD-OCT tissue measurements as structural biomarkers is a viable approach to determine how effective IOP lowering has been in altering the disease.16 Essentially, if the tissue thickness isn’t deteriorating over time, the level of IOP being achieved is likely sufficient, even if it is greater than initially desired. Conversely, if the tissue is continuing to atrophy in spite of meeting what was presumed to be a “safe” pressure, then the IOP level achieved is, in fact, insufficient. This concept is known as determining the patient’s individual IOP susceptibility.13,17
An additionally helpful concept is the use of a target rate of progression.18 Much like with determining IOP susceptibility, this refocuses the emphasis on the severity of the disease state rather than obsessing over meeting a pre-determined target IOP to gauge success. Accordingly, a sounder approach to determine success is to consider whether the only tangibly modifiable risk factor, IOP, is in fact modifying the disease by achieving a target rate of progression that is unlikely to result in functional loss.
Fundus evaluation. Clinical funduscopic examination of the optic nerve remains integral in assessing disease stability and prognosis. Systematically assessing the optic nerve complex for rim erosion, formation of acquired pits of the optic nerve, evolution of parapapillary atrophy and presence of disc hemorrhages is a must, as all are negative prognostic progression indicators.
Disc hemorrhages are associated not only with OCT and visual field progression (on both 24-2 and 10-2 grids), but also with increased velocity of that progression when compared to glaucoma patients without.19-22 It was found that the rate of RNFL progression was faster with post-disc hemorrhages than pre-disc hemorrhages, and intensifying treatment following hemorrhage slowed progression by an average of -0.50µm/year.23
These findings might suggest that disc hemorrhages should not only alert the practitioner to the presence of progression, but compel them to intensify IOP lowering upon disc hemorrhage detection. However, discovery of a hemorrhage may not warrant immediate intervention, as progression has actually been shown to precede disc hemorrhages, even if it often speeds up post-hemorrhage. In fact, it’s been proposed that disc hemorrhages are part of the continuum of structural loss, not an isolated event that initiates tissue loss.24,25 Hence, when a disc hemorrhage is observed, at minimum it’s necessary to increase monitoring in the region where it occurred, as well as carefully scrutinizing associated visual fields to avoid overlooking deepening of existing defects or development of new defects. Remarkably, the lag time to confirm visual field changes post-disc hemorrhages has been shown to be 16.8±/-2 months, meaning that if you choose to maintain present course of therapy after isolating a disc hemorrhage, patience is required.26
 |
|
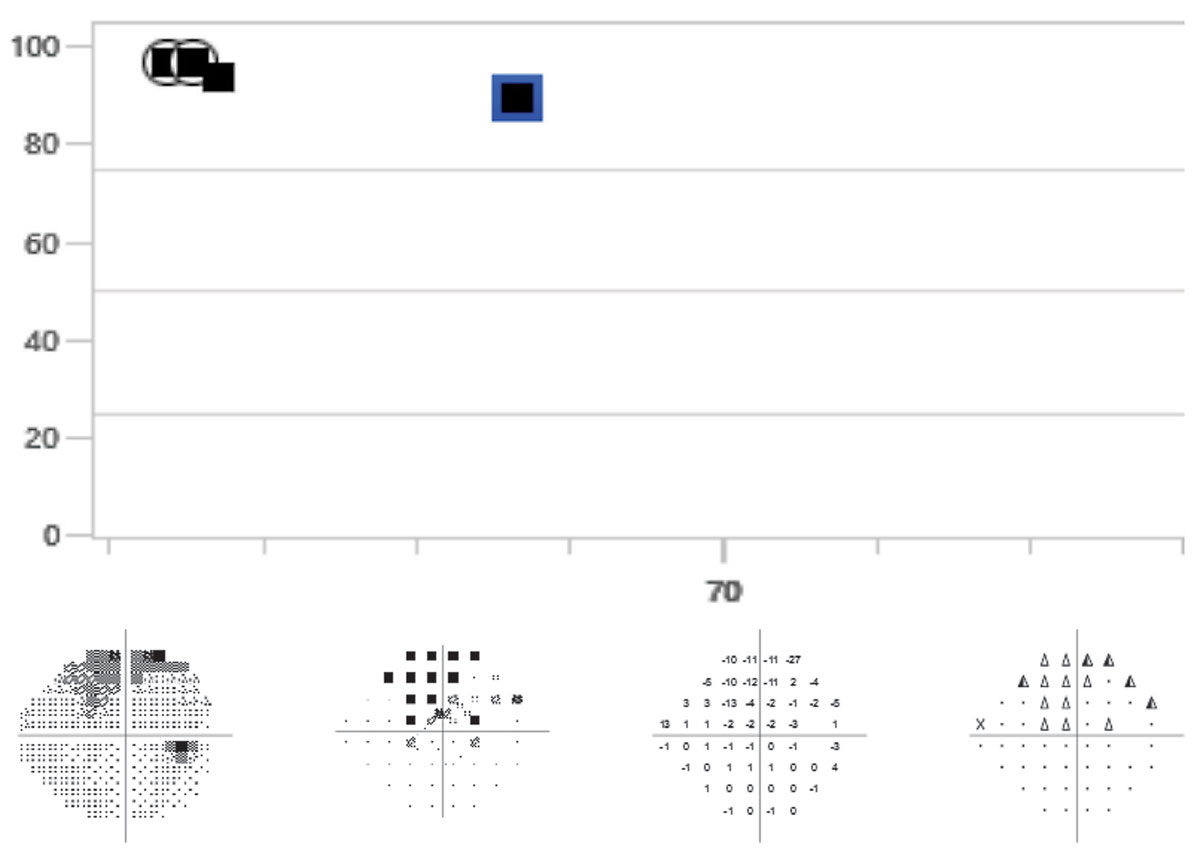
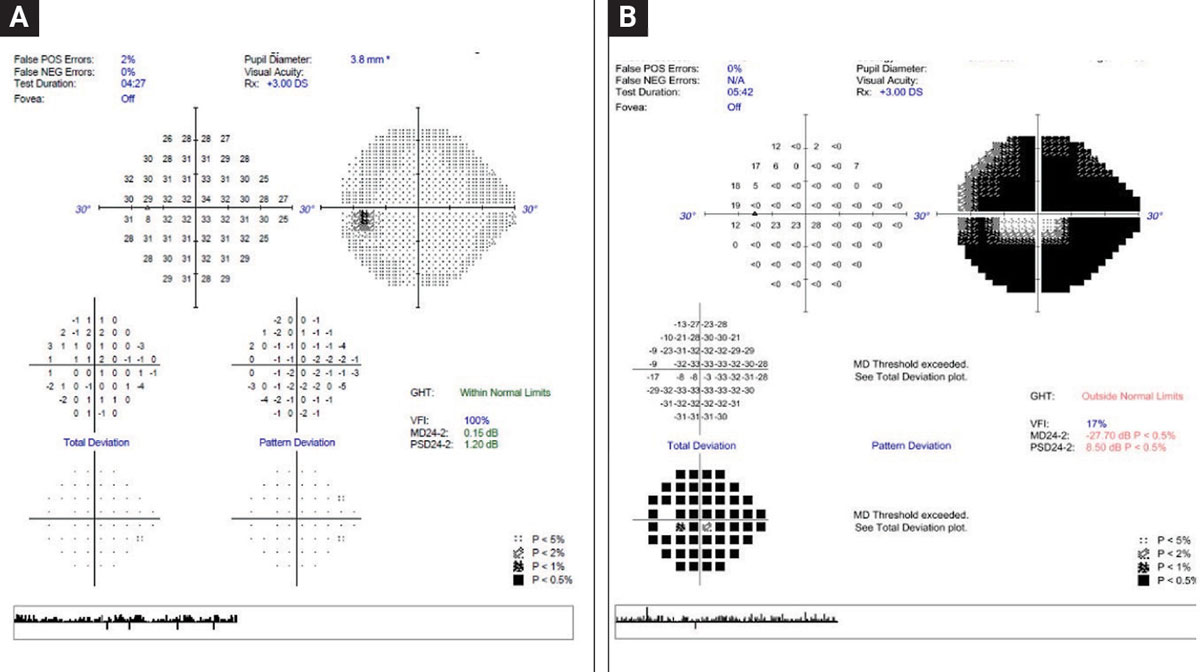
A 68-year-old patient whose visual fields on both event and trend analysis may have progressed when compared to baselines. This patient’s OCTs and clinical appearance do not show signs of progression. The event analysis displays “possible progression.” It is recommended that the visual field be repeated an additional time to confirm progression. Click image to enlarge. |
Visual fields. Perimetry quantitatively assesses the function of retinal ganglion cells at various retinal locations susceptible to damage.29 In deciding which perimetric testing algorithm to use in confirming progression and determining its rate, the decision will hinge on the baseline strategies that each clinician employed when making the initial diagnosis, whether it be 10-2, 24-2, 24-2c or a combination of those strategies. Earlier this year, Sullivan-Mee et al. discovered in their study cohort that having a baseline defect on 10-2 testing was an effective predictor of subsequent progression on 24-2 tests, implying that 10-2 has prognostic progression value and should be considered when establishing the aforementioned baseline.30
For reference, a fast rate of visual field progression is generally considered to be a mean deviation (MD) change of -1.5dB to -2dB per year.31-34 In order to accurately detect rapid field loss, a significant number of visual fields need to be performed. The World Glaucoma Association recommendation is that in order to detect a change of -2dB/year, a minimum of three visual fields per year are required within the first two years, assuming the patients’ fields have low variability.34,35
Unfortunately, these recommendations are often not followed in practice and many practitioners only perform one visual field per year, if that.36 At that rate, it would take five years to exceed test-retest variability (assuming it is low) and confirm the patient is progressing at -2dB/year. Increasing the test frequency from one to two fields per year can be impactful and three per year can provide the managing doctor greater assurance that they are acting upon true progression.37
In detecting progression on perimetry, the various manufacturers have decision-support tools that can be categorized as either trend- or event- based analyses. Evaluating both analyses is compulsory in longitudinal glaucoma management.38
Trend analysis. This uses global metrics, either MD or visual field index from all the tests available during the relevant follow-up period time (in this case, the post-treatment period), to supply an estimated rate of progression, as well as providing a projection of remaining visual sensitivity in the future. The relevance of fast progressors and what is considered a fast rate on MD trend analysis is covered above.
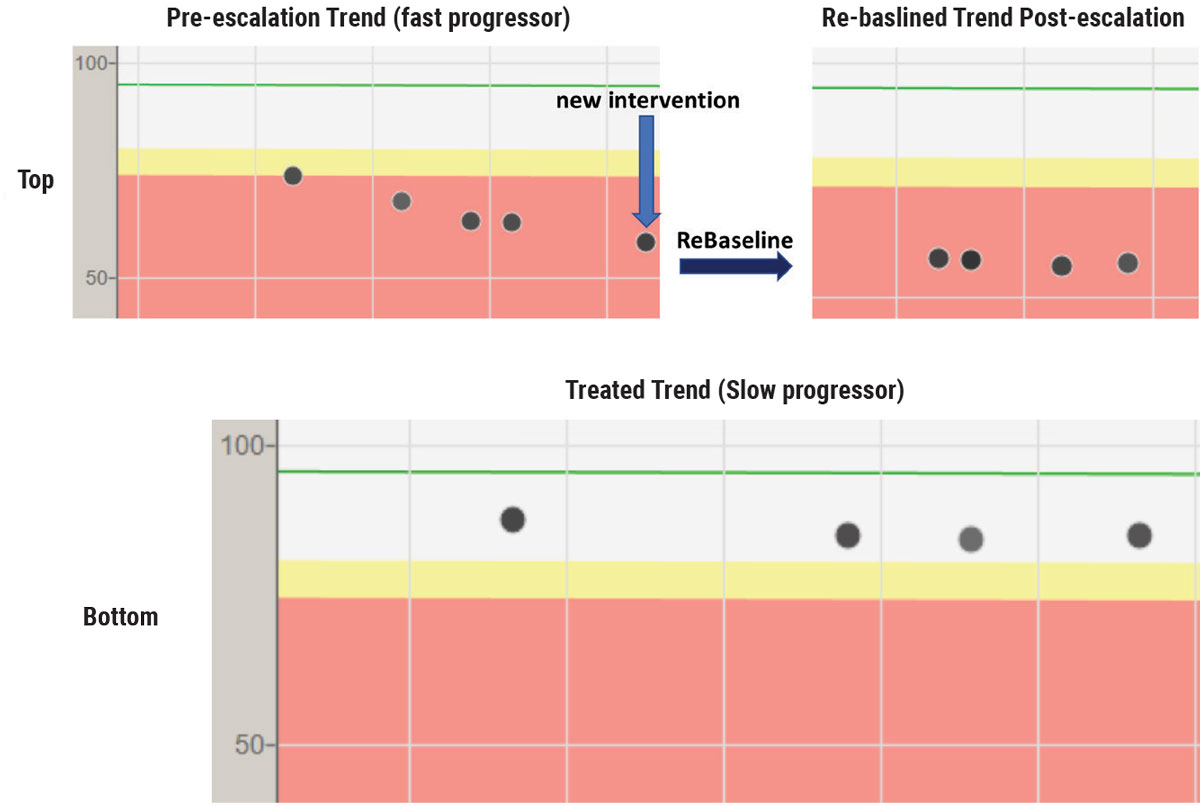 |
OCT trend analysis on a fast progressor with POAG that may have been detected earlier with more initial OCTs (top row). This patient progressed at a rapid rate (-5µm/year) despite intervention on the left image. Treatment was subsequently escalated (blue arrow) and the right image reflects that no additional RNFL tissue loss occurred on the re-baselined (dark arrow) trend analysis. Bottom image shows an extremely slow progressor (<-1µm/year) who was initially put on a second medication because of not meeting target IOP. After the trend analysis showed stability, the patient had the second medication removed and the tissue has remained stable on one medication—a good reminder that OCT biomarkers can guide decision-making. Click image to enlarge. |
Event analysis. This assesses the most recent field and determines whether there are any statistically significant changes to the visual sensitivities in each test location when compared to the same test locations on two established baselines. If the changes exceed a certain threshold, the software will flag the abnormality and alert the clinician to the probability that the change indicates true progression. For instance, with guided progression analysis (GPA), three consecutive fields, having the same three test locations undergo statistically significant change will alert the clinician that progression is “likely.”39
A 2012 study comparing GPA event analysis to manual progression analysis by five world-renowned glaucoma subspecialists showed fair agreement between the two groups, substantiating the value of GPA as a decision support tool.40 Ultimately, regardless of how beneficial the software is, we as doctors must evaluate both trend and event analyses together and do our best to integrate them in our interventional decisions, when visual fields are the most compelling determinant of those decisions.
OCT. This allows the clinician to quantify circumpapillary RNFL, neuroretinal rim and macular tissue loss; in earlier stages of disease progression, it is a more sensitive and less variable technology than automated perimetry.41 In progression analysis, OCT will supply event and trend analyses. These may be labeled differently by the various platforms, but the concept is the same. Event analysis compares each OCT taken to a minimum of two baseline OCTs, generally assessing neural tissue as global, quadrant, sector or clock hour averages. The various platforms will then present probabilities of whether the patient has progressed. Conversely, trend analysis takes an average of the tissue thickness over time and provides the rate at which the disease is progressing.42
The most researched optic nerve complex parameter from a progression trend and event analysis standpoint is global/average RNFL.43,44 Confirmation of disease progression on OCT is limited by the need to exceed machine reproducibility tolerances. Longitudinal use of global/average RNFL is not immune from this limitation. Average RNFL test-retest variability is approximately 4.9µm (this may vary depending on the OCT platform). To compensate for this noise and reinforce the need to exceed it, the informal event analysis based “Rule of 5” has emerged. This rule states that if there is a repeatable 5µm or greater global RNFL loss on consecutive tests, that loss is evidence of progression and changing treatment might be justified.45 The Rule of 5 has actually been shown to result in a 25% false positive rate when studied over five years of progression analysis. Longitudinally, RNFL trend analysis has been shown to be superior to event analysis and is the recommended go-to best progression on OCT.46
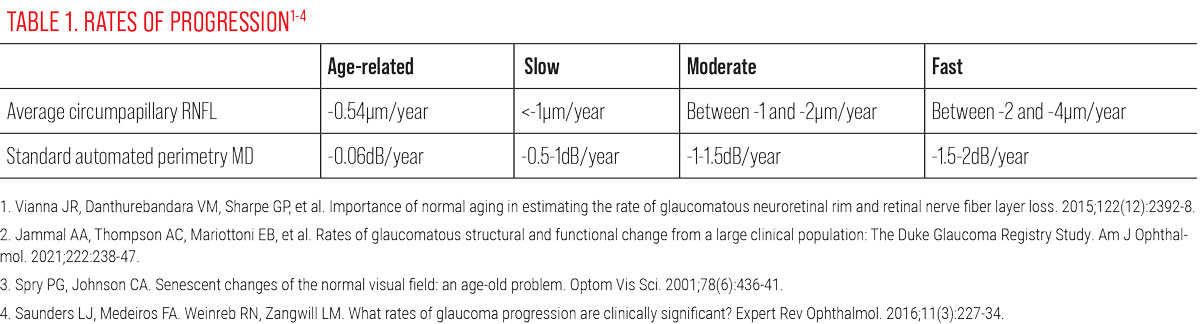
Capturing the rate of progression using trend analysis provides perspective on progression and should inform your next steps. For reference, normal age-related attrition of the RNFL is less than -1µm/year (an average of -0.54µm/year) and rates of
loss are delineated within the Duke Glaucoma Registry as 1µm/year as slow, between 1µm to 2µm/year as moderate, 2µm to 4µm/year as fast and >4µm/year as a catastrophic rate of progression.15,47
Obviously, when discerning glaucoma from normal age-related change and in slower moving cases, more time and testing may be needed to separate normal from pathological results. Mahmoudinezhad et al. recently showed the time required to detect a slow change of -1µm per year was 6.3 years if only one OCT per year was run, five years with two scans per year and 4.2 years if three scans per year are performed.48 For detecting fast progressors, Melchior et al. discovered that performing two quality OCT scans per year is reasonable and sufficient.18
 |
Warning Signs
While both visual fields and OCT scans are helpful in monitoring for progression in glaucoma, artifacts in either method have the potential to lead to false assumptions regarding progression’s validity. In visual field testing, prominent brows, misaligned corrective lenses, blepharoptosis, poor patient instruction and patient or perimetrist inattention all have the capacity to cause artifacts that may show false visual field defects.39 Additionally, media opacities, retinal disease or other optic nerve disease may also cause visual field defects that can be falsely attributed to glaucoma.
OCT is also subject to artifacts and findings that may mimic glaucomatous change. Acquisition errors can be caused by machine, operator or anatomy-related issues and broadly result from the following:
• segmentation errors (leading to
over- or underestimation of tissue)
• tear film abnormalities
• media opacities
• epiretinal membranes
• development of and release of
vitreoretinal traction
• poor scan alignment
• increased axial length
It’s critically important that the B-scans provided on OCT or the printouts are assessed for quality and utility prior to using them in analysis on the current state of the patient’s condition.49,50
Wedge defects are often assumed to be secondary to glaucoma; however, this is not always the case. The Beijing Eye Study demonstrated that localized RNFL wedge defects were present in 15% of patients screened on OCT. These defects were, besides glaucoma, associated with increased axial length, diabetes and other vascular pathologies that resulted in RNFL infarct. Specifically, diabetic RNFL wedge defects have been shown to be smaller than those found in patients diagnosed with glaucoma and do not enlarge over time as glaucomatous wedges do.53,54
Branch retinal artery occlusions may also yield OCT findings consistent with glaucoma. Macular thickness maps have been shown to be valuable diagnostic tools that can accurately differentiate the loss of tissue from glaucoma in comparison to the more extreme loss expected from vascular events such as branch retinal artery occlusions. Increased intra-eye asymmetry and retinal thickness below 200µm is diagnostic of a previous artery occlusion.55
 |
Once Progression is Confirmed, What's Next?
The decision to continue, modify or escalate treatment, coupled with alternating or maintaining a follow-up schedule once progression is confirmed, is multifactorial and should be individualized for each patient. A realistic treatment goal is not one that completely halts all glaucoma progression, but rather one that slows it enough to preserve function.7,14 Visual impairment from glaucoma is linked to increased risk of falls, depressive symptoms and decreased overall self-reported QoL, so identifying patients at risk for additional progression is key.56,57
A silver lining in the glaucoma progression “change the treatment or hold steady?” conundrum is that most patients whose disease is identified early in its course and are treated will not experience visual impairment.6,14,58 Nonetheless, rapid progressors are at a much higher risk of impairment than their slower progressing counterparts. Prognostically, faster visual deterioration is associated with more severe baseline visual field mean deviation levels, larger baseline C/D ratios (>0.7), and older age at initial diagnosis and worse QoL outcomes are associated with faster visual field decline in the better eye.59
Therefore, prospectively identifying signs consistent with the risk of rapid glaucomatous progression and then verifying it should lower the threshold for escalating treatment and adopting a more aggressive stance. Intervening with fast progressors is a necessity, but across the board the level of subsequent intervention after a patient has progressed is dependent on many factors, most importantly; current disease stage, rate of past progression, residual field and predicted remaining lifetime.6,14,58
Accordingly, and depending on the above risk stratification, abandonment of the initially prescribed intervention may not always be the correct reaction to progression. Although topical hypotensives have been a historical first-line therapeutic mainstay in glaucoma care, lack of adherence to these medications is notorious.60-62 Poor treatment adherence can present the illusion that the patient is progressing due to therapeutic failure, when in reality the patient has self-discontinued the drops or was never using them in the first place.60,62-64 Contributors to nonadherence are extensive and include but are not limited to:65,66
• lack of effective doctor-patient communication
• inaffordability of medications
• patient healthcare literacy
• inability to successfully instill drops
• preservative-induced side effects
• lack of self-efficacy (belief in one’s ability to achieve goals)
Confirming treatment adherence provides greater assurance that progression is due to insufficient treatment vigor and additional treatments need to be added. Taking an interventional approach is a viable way to assure treatment is accomplished in nonadherent cases and those where additional treatment complexity is necessary to mitigate patient burden. Interventional options are vast and continue to expand with newer surgical and drug delivery innovations becoming available, as well renewed support for laser treatment in some situations.67,68
The decision to modify glaucoma treatment once progression is confirmed is an infinitely dynamic process and there are myriad combinations of treatments that can be paired to positively influence patient outcomes. Ultimately, the best approach is to attempt to tailor care as much as possible to the individual while acknowledging that treating glaucoma is never simple due to all the unique patient variables we encounter as physicians.69
Re-baselining after Intervening
Lastly, once the decision to further intervene is made, the reference point from which your progression determination was originally based needs to change. The new reference point originates with the newest treatment and is labeled the new baseline; this process is known as re-baselining. It is critical to re-baseline when enhancing therapy, as failure to do so may result in incorrectly interpreting that later progression is occurring post-treatment escalation, when in reality future testing is still being compared to past therapeutic regimens. Re-baselining reduces confusion and establishes whether the newest treatment works or not.
 |
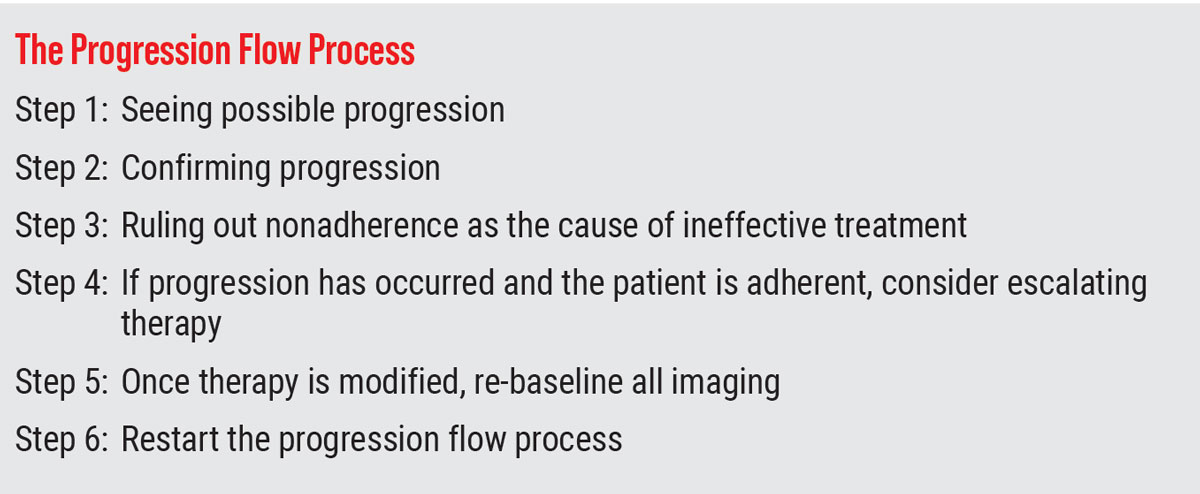
With the goal of preventing progression from Fig. A to Fig. B, a major emphasis is to identify those at greatest risk and knowing associated risk factors. For example, faster progressors are at greater risk of experiencing loss of vision and subsequently experience lower quality of life. Conversely, recognizing that slow progressors with longer expected life expectancy is also a risk for advanced disease progression is also vital. Click image to enlarge. |
Takeaways
Undoubtedly, confirming progression and deciding how to intervene accordingly is an art and may need repeating multiple times throughout a patient’s glaucoma lifecycle. Vigilance in capturing and analyzing longitudinal clinical data is the way and will enhance the soundness and certainty of our decision-making in chronic glaucoma care.Dr. Rixon is an attending optometrist at the Lt. Col. Luke Weathers, Jr. VA Medical Center, a member of the Optometric Glaucoma Society and a glaucoma diplomate of the American Academy of Optometry.
Dr. Cottrill is an attending optometrist and the director of the Intermediate Low Vision Clinic at the Lt. Col. Luke Weathers, Jr. VA Medical Center in Memphis. She is also a faculty member at Southern College of Optometry and a fellow of the American Academy of Optometry.
Dr. Maxey is an consultative optometrist at Deep Blue Retina in Southaven, MS and an attending optometrist at the Lt. Col. Luke Weathers, Jr. VA Medical Center in Memphis. They have no financial interests to disclose.
1. Heijl A, Leske MC, Bengtsson B, et al. Reduction of intraocular pressure and glaucoma progression: results from the Early Manifest Glaucoma Trial. Arch Ophthalmol. 2002;120(10):1268-79. 2. Prata TS, De Moraes CGV, Teng CC, et al. Factors affecting rates of visual field progression in glaucoma patients with optic disc hemorrhage. Ophthalmology. 2010;117(1):24-9. 3. Chauhan BC, Malik R, Shuba LM, et al. Rates of glaucomatous visual field change in a large clinical population. Invest Ophthalmol Vis Sci. 2014;55(7):4135-43. 4. Chauhan BC, Nicolela MT, Artes PH. Incidence and rates of visual field progression after longitudinally measured optic disc change in glaucoma. Ophthalmology. 2009;116(11):2110-8. 5. Aptel F, Bron AM, Lachkar Y, Schweitzer C. Change in visual field progression following treatment escalation in primary open-angle glaucoma. J Glaucoma. 2017;26(10):875-80. 6. Saunders LJ, Russell RA, Kirwan JF, et al. Examining visual field loss in patients in glaucoma clinics during their predicted remaining lifetime. Invest Ophthalmol Vis Sci. 2014;55(1):102-9. 7. Singh K, Shrivastava A. Early aggressive intraocular pressure lowering, target intraocular pressure, and a novel concept for glaucoma care. Surv Ophthalmol. 2008;53 Suppl1:S33-8. 8. The AGIS Investigators. The Advanced Glaucoma Intervention Study (AGIS): 7. The relationship between control of intraocular pressure and visual field deterioration. Am J Ophthalmol. 2000;130(4):429-40. 9. Leske MC, Heijl A, Hyman L, et al. Predictors of long-term progression in the early manifest glaucoma trial. Ophthalmology. 2007;114(11):1965-72. 10. Musch DC, Gillespie BW, Niziol LM, et al; CIGTS Study Group. Intraocular pressure control and long-term visual field loss in the Collaborative Initial Glaucoma Treatment Study. Ophthalmology. 2011;118(9):1766-73. 11. Gordon MO, Beiser JA, Brandt JD, et al. The Ocular Hypertension Treatment Study: baseline factors that predict the onset of primary open-angle glaucoma. Arch Ophthalmol. 2002;120(6):714-20; discussion 829-30. 12. Anderson DR. Collaborative normal tension glaucoma study. Curr Opin Ophthalmol. 2003;14(2):86-90. 13. Clement CI, Bhartiya S, Shaarawy T. New perspectives on target intraocular pressure. Surv Ophthalmol. 2014;59(6):615-26. 14. Melchior B, De Moraes CG, Paula JS, et al. Relationship between mean follow-up intraocular pressure, rates of visual field progression and current target intraocular pressure guidelines. Br J Ophthalmol. 2022;106(2):229-33. 15. Jammal AA, Thompson AC, Mariottoni EB, et al. Rates of glaucomatous structural and functional change from a large clinical population: The Duke Glaucoma Registry Study. Am J Ophthalmol. 2021;222:238-47. 16. Ahmed A, Jammal AA, Estrela T, et al. Intraocular pressure and rates of macular thinning in glaucoma. Ophthalmol Glaucoma. 2023;S2589-4196(23):00068-6. 17. Wilson MR, Singh K. Intraocular pressure: does it measure up? Open Ophthalmol J. 2009;3:32-7. 18. Melchior B, De Moraes CG, Paula JS, et al. Frequency of OCT testing to detect progression in glaucoma. J Glaucoma. 2022;31(11):854-59. 19. Suh MH, Park KH. Pathogenesis and clinical implications of optic disk hemorrhage in glaucoma. Surv Ophthalmol. 2014;59(1):19-29. 20. Razeghinejad MR, Nowroozzadeh MH. Optic disk hemorrhage in health and disease. Surv Ophthalmol. 2017;62(6):784-802. 21. Shukla AG, Sirinek PE, De Moraes CG, et al. Disc hemorrhages are associated with the presence and progression of glaucomatous central visual field defects. J Glaucoma. 2020;29(6):429-34. 22. Akagi T, Saunders LJ, Shoji T, et al. Association between rates of retinal nerve fiber layer thinning and previous disc hemorrhage in glaucoma. Ophthalmol Glaucoma. 2018;1(1):23-31. 23. Akagi T, Zangwill LM, Saunders LJ, et al. Rates of local retinal nerve fiber layer thinning before and after disc hemorrhage in glaucoma. Ophthalmology. 2017:124(9):1403-11. 24. Chung E, Demetriades AM, Christos PJ, Radcliffe NM. Structural glaucomatous progression before and after occurrence of an optic disc hemorrhage. Br J Ophthalmol. 2015;99(1):21-5. 25. de Beaufort HC, De Moraes CGV, Teng CC, et al. Recurrent disc hemorrhage does not increase the rate of visual field progression. Graefes Arch Clin Exp Ophthalmol. 2010;248(6):839-44. 26. Siegner SW, Netland PA. Optic disc hemorrhages and progression of glaucoma. Ophthalmology. 1996;103(7):1014-24. 27. Medeiros FA, Tatham AJ. Structure vs function in glaucoma: the debate that doesn’t need to be. Ophthalmology. 2016;123(6):1170-2. 28. Malik R, Swanson WH, Garway-Heath DF. ‘Structure-function relationship’ in glaucoma: past thinking and current concepts. Clin Experiment Ophthalmol. 2012;40(4):369-80. 29. Sanderson J, Rixon A. Glaucoma: how to build a better baseline. Rev Optom. www.reviewofoptometry.com/article/glaucoma-how-to-build-a-better-baseline. September 15, 2020. Accessed June 25, 2023. 30. Sullivan-Mee M, Kimura B, Kee H, et al. Baseline 10-2 visual field loss as a predictor for future glaucoma progression. J Glaucoma. 2023;32(1):1-8. 31. Chauhan BC, Mikelberg FS, Artes PH, et al. Canadian Glaucoma Study: 3. Impact of risk factors and intraocular pressure reduction on the rates of visual field change. Arch Ophthalmol. 2010;128(10):1249-55. 32. Medeiros FA, Zangwill LM, Mansouri K, et al. Incorporating risk factors to improve the assessment of rates of glaucomatous progression. Invest Ophthalmol Vis Sci. 2012;53(4):2199-207. 33. Kirwan JF, Hustler A, Bobat H, et al. Portsmouth visual field database: an audit of glaucoma progression. Eye (Lond). 2014;28(8):974-9. 34. Chauhan BC, Garway-Heath DF, Goñi FJ, et al. Practical recommendations for measuring rates of visual field change in glaucoma. Br J Ophthalmol. 2008;92(4):569-73. 35. Weinreb RN, Garway-Heath DF, Leung C, Crowston JG, Medeiros FA. 8th Consensus Meeting: progression of glaucoma. World Glaucoma Association. wga.one/wga/consensus-8. October 18, 2011. Accessed June 25, 2023. 36. Fung SSM, Lemer C, Russell RA, Malik R, Crabb DP. Are practical recommendations practiced? A national multi-centre cross-sectional study on frequency of visual field testing in glaucoma. Br J Ophthalmol. 2013;97(7):843-7. 37. Chauhan BC. How many visual fields are enough? Rev Ophthalmol. www.reviewofophthalmology.com/article/how-many-visual-fields-are-enough. July 9, 2011. Accessed June 25, 2023. 38. Medeiros FA, Weinreb RN, Moore G, et al. Integrating event- and trend-based analyses to improve detection of glaucomatous visual field progression. Ophthalmology. 2012;119(3):458-67. 39. Heijl A, Patella VM, Bengtsson B. The field analyzer primer: excellent perimetry. 5th Ed. Carl Zeiss Meditec, Incorporated; 2021. 40. Tanna AP, Budenz DL, Bandi J, et al. Glaucoma progression analysis software compared with expert consensus opinion in the detection of visual field progression in glaucoma. Ophthalmology. 2012;119(3):468-73. 41. Zhang X, Dastiridou A, Francis BA, et al. Comparison of glaucoma progression detection by OCT and visual field. Am J Ophthalmol. 2017;184:63-74. 42. Rixon A, Kirk A. Seeing glaucoma through OCT’s eye. Rev Optom. www.reviewofoptometry.com/article/seeing-glaucoma-through-octs-eye. January 15, 2023. Accessed June 25, 2023. 43. Ghasia FF, El-Dairi M, Freedman SF, et al. Reproducibility of spectral-domain OCT measurements in adult and pediatric glaucoma. J Glaucoma. 2015;24(1):55-63. 44. Mwanza JC, Chang RT, Budenz DL, et al. Reproducibility of peripapillary retinal nerve fiber layer thickness and optic nerve head parameters measured with cirrus HD-OCT in glaucomatous eyes. Invest Ophthalmol Vis Sci. 2010;51(11):5724-30. 45. Thompson AC, Jammal AA, Medeiros FA. Performance of the rule of 5 for detecting glaucoma progression between visits with OCT. Ophthalmol Glaucoma. 2019;2(5):319-26. 46. Thompson AC, Jammal AA, Berchuck SI, et al. Comparing the rule of 5 to trend-based analysis for detecting glaucoma progression on OCT. Ophthalmol Glaucoma. 2020;3(6):414-20. 47. Vianna JR, Danthurebandara VM, Sharpe GP, et al. Importance of normal aging in estimating the rate of glaucomatous neuroretinal rim and retinal nerve fiber layer loss. Ophthalmology. 2015;122(12):2392-8. 48. Mahmoudinezhad G, Moghimi S, Proudfoot JA, et al. Effect of testing frequency on the time to detect glaucoma progression with OCT and OCT angiography. Am J Ophthalmol. 2023;245:184-92. 49. Chen JJ, Kardon RH. Avoiding clinical misinterpretation and artifacts of OCT analysis of the optic nerve, retinal nerve fiber layer and ganglion cell layer. J Neuroophthalmol. 2016;36(4):417-38. 50. Hardin JS, Taibbi G, Nelson SC, et al. Factors affecting cirrus-HD OCT optic disc scan quality: a review with case examples. J Ophthalmol. 2015;2015:746150. 51. Fard MA, Afzali M, Abdi P, et al. Optic nerve head morphology in nonarteritic anterior ischemic optic neuropathy compared to open-angle glaucoma. Invest Ophthalmol Vis Sci. 2016;57(11):4632-40. 52. Braga J, Soares R, Loureiro M, et al. Bruch’s membrane opening minimum rim width in the differential diagnosis of optic neuropathies. Neuroophthalmology. 2020;44(2):76-88. 53. Zhao L, Wang YX, Zhang W, et al. Localized retinal nerve fiber layer defects detected by OCT: the Beijing Eye Study. PLoS One. 2013;8(7):e68998. 54. Yoo YC, Lee CM, Park JH. Changes in peripapillary retinal nerve fiber layer distribution by axial length. Optom Vis Sci. 2012;89(1):4-11. 55. Sullivan-Mee M, Amin P, Pensyl D, Katiyar S. Differentiating occult branch retinal artery occlusion from primary open-angle glaucoma. Optom Vis Sci. 2018;95(2):106-12. 56. Diniz-Filho A, Abe RY, Cho HJ, et al. Fast visual field progression is associated with depressive symptoms in patients with glaucoma. Ophthalmology. 2016;123(4):754-9. 57. Baig S, Diniz-Filho A, Wu Z, et al. Association of fast visual field loss with risk of falling in patients with glaucoma. JAMA Ophthalmol. 2016;134(8):880-6. 58. Lee JM, Caprioli J, Nouri-Mahdavi K, et al. Baseline prognostic factors predict rapid visual field deterioration in glaucoma. Invest Ophthalmol Vis Sci. 2014;55(4):2228-36. 59. Moghimi S, Kamalipour A, Nishida T, et al. Progressive visual field loss and subsequent quality of life outcomes in glaucoma. Am J Ophthalmol. 2023;252:295-305. 60. Shu YH, Wu J, Luong T, et al. Topical medication adherence and visual field progression in open-angle glaucoma: analysis of a large US health care system. J Glaucoma. 2021;30(12):1047-55. 61. Friedman DS, Quigley HA, Gelb L, et al. Using pharmacy claims data to study adherence to glaucoma medications: methodology and findings of the Glaucoma Adherence and Persistency Study (GAPS). Invest Ophthalmol Vis Sci. 2007;48(11):5052-7. 62. Sleath B, Blalock S, Covert D, et al. The relationship between glaucoma medication adherence, eye drop technique and visual field defect severity. Ophthalmology. 2011;118(12):2398-402. 63. Waterman H, Read S, Morgan JE, et al. Acceptability, adherence and economic analyses of a new clinical pathway for the identification of non-responders to glaucoma eye drops: a prospective observational study. Br J Ophthalmol. 2020;104(12):1704-9. 64. Rossi GCM, Pasinetti GM, Scudeller L, et al. Do adherence rates and glaucomatous visual field progression correlate? Eur J Ophthalmol. 2011;21(4):410-4. 65. Newman-Casey PA, Niziol LM, Lee PP, et al. The impact of the support, educate, empower personalized glaucoma coaching pilot study on glaucoma medication adherence. Ophthalmol Glaucoma. 2020;3(4):228-37. 66. Hahn SR, Friedman DS, Quigley HA, et al. Effect of patient-centered communication training on discussion and detection of nonadherence in glaucoma. Ophthalmology. 2010;117(7):1339-47.e6. 67. Gillmann K, Mansouri K. Minimally invasive glaucoma surgery: where is the evidence? Asia Pac J Ophthalmol (Phila). 2020;9(3):203-14. 68. Cantor L, Lindfield D, Ghinelli F, et al. Systematic literature review of clinical, economic and humanistic outcomes following minimally invasive glaucoma surgery or selective laser trabeculoplasty for the treatment of open-angle glaucoma with or without cataract extraction. Clin Ophthalmol. 2023;17:85-101. 69. Realini T, Fechtner RD. 56,000 ways to treat glaucoma. Ophthalmology. 2002;109(11):1955-6. |
