 |
Glaucoma is a progressive optic neuropathy characterized by retinal nerve fiber layer loss with or without subsequent visual field (VF) damage. Both the diagnosis and management of glaucoma is largely dependent on the patient’s VF tests.1,2 Deciding when to initiate or change treatment is determined by a number of different factors, one of the most important being the interpretation of various aspects of the patient’s VF testing. However, interpreting a VF printout can be daunting, with several elements to evaluate and consider. An easy and important index to keep track of is the mean deviation (MD).
VF Basics
Automated VF perimetry is a standard test that clinicians can use to evaluate the presence and progression of glaucomatous defects, most commonly using the Humphrey Field Analyzer. The most common VF test employed for glaucoma patients and glaucoma suspects is the 24-2 test. This measures the central 24 degrees of field, consisting of a total of 54 test points, each separated by six degrees.
In the setting of severe visual loss, or even in cases of early macular glaucoma, a 10-2 may replace or supplement the 24-2 test. In contrast to the 24-2, the 10-2 test measures the central 10 degrees of fixation with higher resolution, consisting of a total of 68 test points separated by two degrees. Assessing the central 10 degrees of fixation in standard 24-2 testing would be of little value, as it is only represented by 12 overall points.2
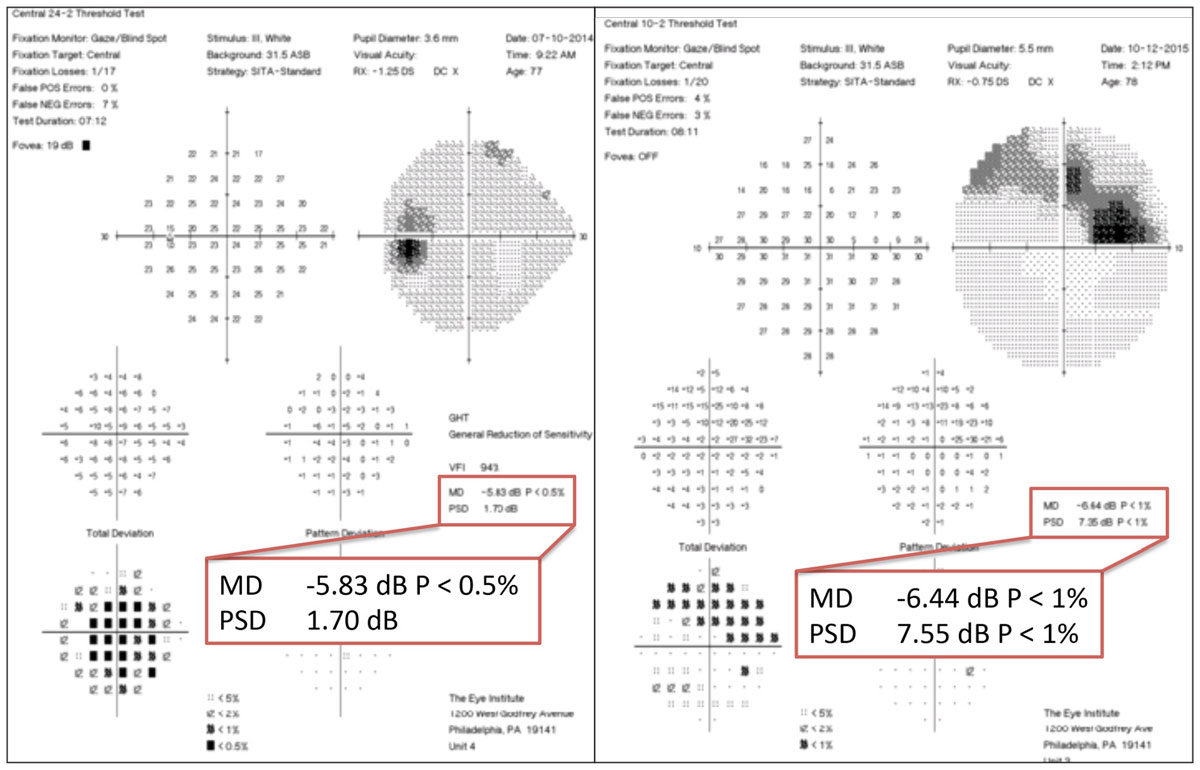 |
| At left, the 24-2 VF shows one centrally depressed point, which manifests as a larger defect on the 10-2 VF, at right, due to higher resolution and more central field. The MDs are similar but slightly worse on the 10-2 VF due to larger defect detected with higher resolution. Click image to enlarge. |
Before performing any VF interpretation, clinicians must first evaluate the test for accuracy. The three indices that determine reliability are fixation losses, false positives and false negatives. Generally speaking, the arbitrary cutoff values are set at 33% for false negatives and false positives and 20% for fixation loss.3 Once clinicians determine that the test is valid, they can use the VF readout for clinical management.
Mean Deviation
While there are several useful aspects of a VF printout, the MD is one of the most important. The MD is the average, point-wise difference between a given test result and the normal, age-matched reference value.1 This value is derived from the total deviation plot and indicates the overall depression or elevation of a patient’s hill of vision. For example, a patient with a positive MD value will have a better than normal hill of vision (which could occur simply because the patient’s VF is better than the normative database, or in a patient with excessively high false positives), whereas a patient with a very low MD will have a decreased hill of vision, indicating pathology.4
Visual Field IndexA similar measurement that is often used in correlation with the MD is the visual field index (VFI). The VFI was developed to better establish changes in glaucoma patients and address the drawbacks of the MD. While the MD is measured as a decibel value, the VFI is a percentage relative to the sensitivity of a reference group of healthy observers. For example, a healthy patient with no vision loss and a full field would have a VFI of 100%. Unlike the MD, the VFI disregards general reductions in sensitivity associated with cataracts or refractive errors, unless they are associated with patter deviations outside the normal range.8 |
Identifying if a patient’s visual field is truly progressing is a multifactorial process that can be challenging. Many patients may exhibit progressive VF loss in the absence of clear, structural optic nerve changes.5 In addition, VF results can be inconsistent, making it difficult to discern a clinically significant progression compared with regular test variability.
To help improve visual field testing consistency, clinicians should perform at least six VF tests in the first two years after a patient is diagnosed with glaucoma to establish baseline reliability and rule out rapid progression.
Using MD values can be an important tool in these cases. A rapid rate of progression based only on the MD is established at more than -2dB per year. The less decrease in the MD over time, the better the chance of maintaining visual outcome.1 MD is also a measure used in clinical trials to determine drug efficacy. For example, one study comparing timolol and brimonidine treatments concluded that they were both similarly efficacious by comparing study participants’ MD slopes in their VFs over time as an outcome measure.6
MD Beyond GlaucomaThe MD, an easily identified value on a standard VF printout, can provide a significant amount of information to aid in the management and treatment of glaucoma patients. It can also help clinicians measure possible progression in other ocular disorders. For example, research shows MD can help clinicians determine visual outcome in patients with papilledema secondary to idiopathic intracranial hypertension—patients with low MD values at initial presentation had a more favorable visual outcome.9 Additionally, comparison of MD values between the two eyes can be an excellent predictor of the presence of an afferent pupillary defect (APD).10 The greater the difference in MD values, the larger grade the APD when observed clinically. In the same manner, glaucoma patients who present clinically with an APD will have more asymmetric VF loss.11 |
Reliability of a VF test can also affect the MD value. The greater the percentage of false negatives—which may be increased in glaucoma patients—the lower the MD. Similarly, a trigger-happy patient with high false positives will yield a higher MD.3 Age is also something worth considering, as research shows an association with increasing age and lower MD values, suggesting more aggressive treatments in elderly patients with VF secondary to glaucoma.7
Mean deviation values are present on both the 24-2 and 10-2 analyses. Rates of MD changes in glaucomatous eyes with VF defects on both types of tests are similar in mild to moderate loss. However, the changes in MD in severe glaucoma with advanced VF loss are more significant in the 10-2. This is likely due to the peripheral points of the 24-2 reaching their “floor.” Having the inability to detect peripheral worsening will mask the severity of changes occurring centrally. As such, it is more important to monitor the MD in 10-2 VFs for severe defects.2
Mean deviation is a simple measure that can help clinicians efficiently identify visual changes in a number of ocular conditions, the most notable being glaucoma. It should be an integral part of a clinician’s assessment when caring for patients with the potential for visual field loss.
1. Chauhan BC, Garway-Heath DF, Goñi FJ, et al. Practical recommendations for measuring rates of visual field change in glaucoma. Br J Ophthalmol. 2008;92(4):569-73. 2. Rao HL, Begum VU, Khadka D, et al. Comparing glaucoma progression on 24-2 and 10-2 visual field examinations. PLoS One. 2015;10(5):e0127233. 3. Tan NYQ, Tham YC, Koh V, et al. The effect of testing reliability on visual field sensitivity in normal eyes: the Singapore Chinese eye study. Ophthalmology. 2018;125(1):15-21. 4. Thomas R, George R. Interpreting automated perimetry. Indian J Ophthalmol. 2001;49(2):125-40. 5. Anderson AJ. significant glaucomatous visual field progression in the first two years: what does it mean? Transl Vis Sci Technol. 2016;5(6):1. Erratum in: Transl Vis Sci Technol. 2017;6(1):10. 6. Yokoyama Y, Kawasaki R, Takahashi H, et al. Effects of brimonidine and timolol on the progression of visual field defects in open-angle glaucoma: a single-center randomized trial. J Glaucoma. 2019;28(7):575-83. 7. Bommakanti N, De Moraes CG, Boland MV, et al. Baseline age and mean deviation affect the rate of glaucomatous vision loss. J Glaucoma. 2020;29(1):31-38. 8. Mansuri G, Chawala A, Gandhi S, et al. Relationship of a new visual field index, the VFI, with Mean deviation (MD) in 30-2 and 24-2 threshold tests examined by Humphrey field analyzer in POAG patients. Gujarat Med J. 2014;69(1):93-95. 9. Mikkilineni S, Trobe JD, Cornblath WT, De Lott L. Visual field mean deviation at diagnosis of idiopathic intracranial hypertension predicts visual outcome. J Neuroophthalmol. 2019;39(2):186-90. 10. Bobak SP, Goodwin JA, Guevara RA, et al. Predictors of visual acuity and the relative afferent pupillary defect in optic neuropathy. Doc Ophthalmol. 1998;97(1):81-95. 11. Bruckmann A, Gäßler C, Dietzsch J, et al. High correlation between relative afferent pupillary defect (RAPD) and visual field loss in patients with glaucomatous optic neuropathy. Invest Ophthalmol Vis Sci. 2011;52(14):5513. |