 |
Diabetic eye exams are a routine part of any optometric practice and are encountered daily. Oftentimes, we ask the same pertinent history elements that help us determine the extent of a patient’s control of their diabetes so that we can best manage their ocular health and have somewhat of an expectation of their risk and progression.
Two of these historical elements are numerical: the patient’s last fasting blood sugar and hemoglobin A1c (HbA1c). Understanding the difference as well as the significance of both is important in assessing the overall clinical picture for the diabetic patient.
Diagnosis Criteria
It has long been established that a criterion for the diagnosis of diabetes mellitus includes last fasting blood sugar level, specifically a value greater than or equal to 126 mg/dL or a two-hour oral glucose tolerance test greater than or equal to 200 mg/dL. However, in 2010, the American Diabetes Association recognized a new diagnostic criterion using HbA1c. This test offers many advantages over the rest and is now measured routinely for all diabetics. Since it is a newer classified criterion, it is necessary to understand how this measurement works and what it means for our patients.1,2
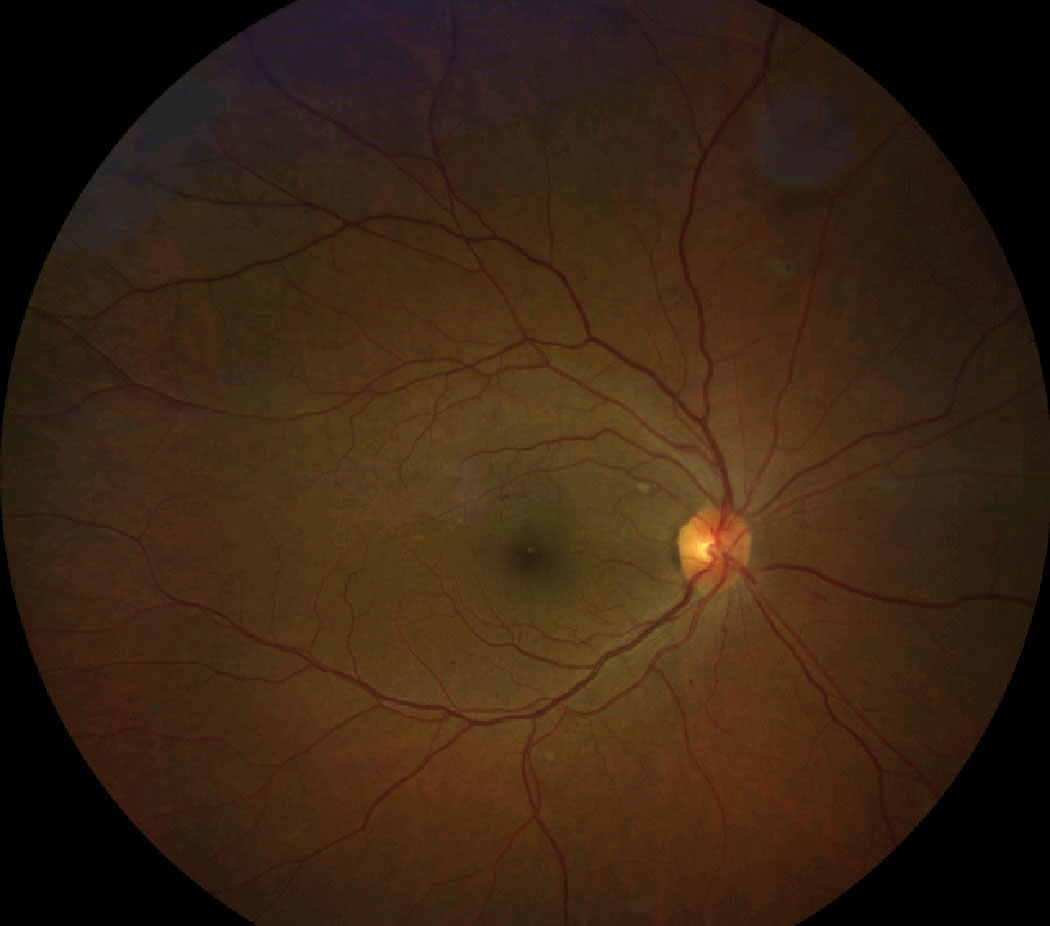 |
| Patient with high Hb A1c and nonproliferative diabetic retinopathy. Click image to enlarge. |
Chemical Structure
Hemoglobin (Hb) is the oxygen-carrying protein found within human red blood cells and is essential for oxygen transportation to sustain life. In terms of its chemical structure, Hb is a metalloprotein tetramer—meaning it is an iron-containing compound composed of four protein chains. The most abundant form of Hb within the human circulatory system is HbA. This form is made up of two alpha chains and two beta chains, constituting 97% of all healthy adult hemoglobin.2
Additional minor forms of Hb arise due to posttranslational modification of the parent Hb A compound. Of these minor Hb, the most common form is the infamous HbA1c, which makes up the approximate 3% remaining of the total Hb in a healthy adult.2,3 HbA1c is formed from the parent Hb A compound through a process called glycation. When glycation occurs, a glucose molecule is nonenzymatically attached to the parent Hb A compound, thus converting Hb A to HbA1c. As red blood cells contain both Hb A and glucose molecules, the process of glycation to form HbA1c occurs spontaneously throughout the life span of the cell, which is 120 days.
Also, because the process is nonenzymatic, the amount of glycation is directly proportional to blood glucose levels—high levels of glucose will yield higher concentration of HbA1c. This means that generally, for every 30mg/dL increase in blood glucose, a 1% increase in HbA1c concentration results.
 |
| Click table to enlarge. |
Clinical Significance
These features make HbA1c measurements excellent indicators of long-term glycemic control. It is an overall better index of general, more long-term control and is less subject to acute shifts in blood glucose levels due to acute illness or stress. As such, HbA1c is used in clinical practice both to diagnose and prognosticate. Patients with a HbA1c greater than or equal to 6.5% meet criteria for a diagnosis of diabetes mellitus while those with values greater than or equal to 5.7% but less than 6.5% are classified to have prediabetes or impaired fasting glucose.2,4
Another advantage is that patients do not need to fast prior to their HbA1c measurement for an accurate result. In terms of prognostication, every 1% reduction in HbA1c value has been associated with a 37% reduction in the risk of developing diabetic retinopathy.4
Keep an Eye Out
As many advantages as there are to this tool, there are some instances where it can be inaccurate. One important caveat to bear in mind is that HbA1c measurements are a time-dependent, weighted mean of a patient’s blood glucose levels over the past three months. Thus, more recent blood glucose trends influence a patient’s HbA1c measurement more than the more remote trends. As a result, if a patient, for example, had excellent blood glucose control during months one and two but poor control during month three due to steroid course for uveitis, his HbA1c measurement would be disproportionately elevated by the more recent blood glucose trend in month three.2
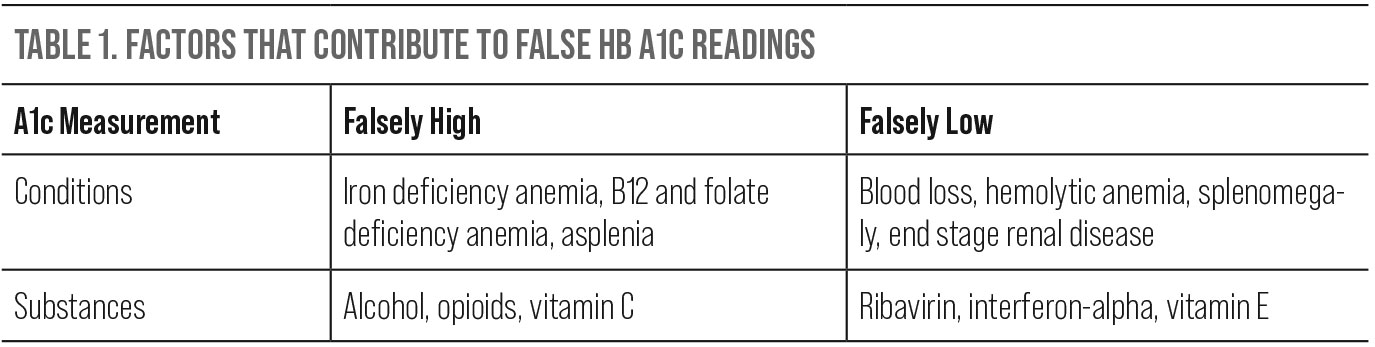
There are also several instances in which HbA1c measurements can be falsely high or low. Since the measurement is directly related to red blood cells, any condition that either prolongs or shortens the life span of a red blood cell can yield an inaccurate measurement. Some conditions resulting in a falsely elevated HbA1c include iron deficiency, B12 and folate deficiency anemias and asplenia. Chronic alcoholism, use of opioids and vitamin C supplements may also yield similar effects. Conversely, shortened red blood cell life or turnover can result in a falsely lowered HbA1c. These conditions include acute or chronic blood loss, hemolytic anemia, splenomegaly, end stage renal disease and even pregnancy. Substances that do the same include vitamin E, ribavirin and interferon-alpha.1
Takeaways
The ocular complications of diabetes are well-established, including ocular surface disease, corneal complications, increased risk for infection, cataracts, retinopathy and macular edema.5 As such, paying close attention to diabetic control in our patients is vital because it may serve as a predictor of disease or dictate how closely they should be followed. The HbA1c is a helpful element in this scenario.
Dr. Labib graduated from Pennsylvania College of Optometry, where she now works as an associate professor. She completed her residency in primary care/ocular disease and is a fellow of the American Academy of Optometry and a diplomate in the Comprehensive Eye Care section. She has no financial interests to disclose.
1. Radin MS. Pitfalls in hemoglobin A1c measurement: when results may be misleading. J Gen Intern Med. 2014 Feb;29(2):388-94. 2. Steinberg MH. Structure and function of normal hemoglobins. In: UpToDate, Shefner JM (Ed), UpToDate, Waltham, MA. Accessed on September 13, 2022. 3. Inzucchi SE, Lupsa B. Clinical presentation, diagnosis, and initial evaluation of diabetes mellitus in adults. In: UpToDate, Shefner JM (Ed), UpToDate, Waltham, MA. Accessed on September 13, 2022. 4. UK Prospective Diabetes Study (UKPDS) Group. Intensive blood-glucose control with sulphonylureas or insulin compared with conventional treatment and risk of complications in patients with type 2 diabetes (UKPDS 33). Lancet. 1998; 352:837. 5. Seewoodhary M. An overview of diabetic retinopathy and other ocular complications of diabetes mellitus. Nurs Stand. 2021;36(7):71-6. |
