Each of the many retinal imaging modalities available on the market today help to aid in the diagnosis of retinal diseases in their own ways. Using these modern wonders, we can monitor progression (or improvement) of retinal pathology and treatment with a degree of clarity we’ve never seen before. It is the responsibility of the practitioner to determine if, when and how often these imaging modalities are appropriate for diagnosis and management. To do so, we must delineate the type of information each test provides, how it relates to the current state of the patient’s retinal disease, as well as its ability to provide a beneficial way of serial monitoring.
This article provides an overview of a variety of retinal imaging devices and how you can use them in your practice.
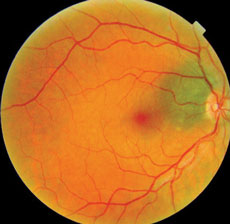 |
| Fig. 1. This fundus image, obtained as a baseline in 2007, shows a new patient with a choroidal nevus. |
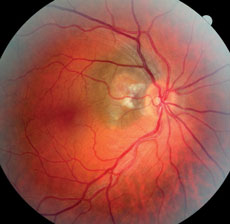 |
| Fig. 2. The same patient, seen in 2015, displays visible changes to the nevus. |
Basic Imaging
Fundus photographs capture the current funduscopic appearance of the retina, macula, vasculature and optic nerve. Many fundus cameras allow full color as well as red-free and green-free filters to visualize inner and outer retinal layers. Many cameras also allow side-by-side comparison, or overlapped imaging that aligns successive retinal photos, to assess subtle changes to the size and shape of lesions. Many cameras also have measuring calipers within the software to measure length, diameter, perimeter and area of retinal pathology.
Fundus photography can also image mid-peripheral and far-peripheral lesions and then stitch the various images together, creating a collage of systematic peripheral sweeps. The latest scanning laser ophthalmoscope uses confocal laser scanning microscopy to deliver high-resolution, widefield images. The images created by the laser wavelengths can also be separated into red-free and green-free images. To date, these cameras cannot give a full 360 degree view to the ora serrata, so they cannot replace clinical funduscopy to identify retinal lesions, but they can be quite useful to photodocument and monitor peripheral lesions sequentially.
Obtaining baseline fundus photos may prove invaluable if changes to a patient’s retinal lesions develop between visits. Figures 1 and 2, for example, show a patient with a choroidal nevus adjacent to the optic nerve head that appears normal. Figure 1 was obtained in 2007, as a baseline. In 2015, the patient returned for a routine, comprehensive examination and the photos showed a definite change (Figure 2). It was exceedingly helpful to compare his baseline 2007 image to the current clinical picture to help guide the diagnosis. Because the size of the choroidal nevus remained the same and there was only a central elevated lesion, we determined—with the aid of additional tests—that the diagnosis was peripapillary choroidal neovascular membrane. It was, quite coincidentally, located within the same, unchanged, choroidal nevus. The most concerning differential diagnosis we considered was choroidal melanoma, but because the size of the nevus itself had not changed compared to the baseline image, we considered this less likely.
It is also possible to take fundus photographs in three dimensions. Stereoscopic fundus photography has the distinct advantage of imaging depth of the retina and optic nerve compared to conventional photography. It allows the clinician to evaluate excavation of the optic nerve in glaucoma or amount of swelling in papilledema. Especially with tumors, retinal neovascular nets and edema of the retina or optic nerve head, stereoscopic photography captures the binocular clinical view to monitor these conditions over time for depth changes that two dimensional imaging cannot. In fact, for the patient in Figures 1 and 2, stereoscopic photography would have been particularly helpful in following this patient over time. One year after diagnosis, the size and shape of the choroidal neovascular net remains the same, but appears significantly shallower compared to previous images, as it continues to resolve untreated. Serial two-dimensional photography does not easily depict this improvement.
Although fundus photography, compared to newer imaging technology, does not often yield new information above clinical examination findings, it can be invaluable for retinal disease progression and if a patient moves to another doctor for continuity of care. Baseline imaging should be obtained on any retinal finding with potential for change. Re-imaging should be used if you suspect a change from the baseline and should then be analyzed in a side-by-side, or overlapping, comparison with previous images with computerized measurements to confirm and properly manage any pathology.
Certainly, fundus photography can be overused if imaging a stable retinal finding more than once a year—especially when change is unlikely. Overall, baseline and periodic imaging can aid in prompt diagnosis and treatment intervention if discrepancy is subtly measured with the tools now available in most photographic software.
 |
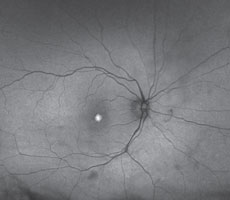 |
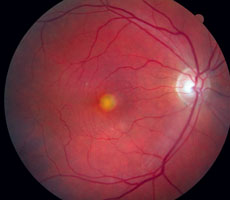
| Figs. 3 and 4. This is an expected finding for AOVD with a large hyper FAF area of the vitelliform lesion without any diffuse change to the macular autofluorescence. |
A Metabolic Evaluation
A noninvasive imaging modality for retinal pigment epithelium (RPE) metabolic function is fundus autofluorescence (FAF). The yellow fluorescence emitted is a result of lipofuscin when stimulated with blue light in the range of 488nm. Lipofuscin is a retinal fluorophore that ultimately accumulates in RPE lysozomes during phagocytosis of photoreceptor outer segments. This physiology allows indirect interpretation of the metabolic activity of the RPE.1 Both confocal scanning laser ophthalmoscopy and standard fundus photography can be used to record autofluorescence (AF).
FAF of a healthy retina appears as a uniform, granular, slightly hyperfluorescent signal. This is due to levels of lipofuscin present in RPE lysozomes during normal phagocytosis and metabolism. The optic nerve and blood vessels are black, due to blockage of the signal. The central fovea is also dark due to the absorbing pigment (xanthophyll) of the central macula.
Loss of photoreceptors results in decreased autofluorescence because the metabolic demand on the RPE is diminished or eliminated—indicating a dead or dying retina with poor visual prognosis in that location. Hypoautofluorescence is also seen in pathology that blocks the normal signal such as vitreal or preretinal hemorrhage.
An increase in AF is due to rapid turnover of the photoreceptors or an abnormality in the phagosomal uptake of lipofuscin from them. Therefore, an increase in AF denotes a sick or stressed RPE and active retinal disease.2 Other causes of increased AF include: fluorophores that are not within the RPE lysozomes, most commonly drusen of the optic nerve head; astrocytic hamartomas; chronic hemorrhage; and deposition in Best’s disease or adult onset vitelliform macular dystrophy.3
Similar to color fundus photography, FAF is useful for baseline, as well as serial, imaging to help identify hyperautofluorescent or hypoautofluorescent lesions and monitor their size, shape and location over time. Baseline FAF imaging is especially useful for retinal diseases likely to cause metabolic change to the RPE. In early stages of many diseases, the fundus may appear normal during funduscopic examination and colored fundus photography, but FAF has the ability to show dysfunctioning RPE health at the metabolic level. FAF is useful in any retinal disease that affects the integrity of the RPE and should be used in all cases for both baseline and periodic monitoring, the frequency of which is case dependent. Functional deterioration of the retina can occur much earlier than structural changes, which are detected clinically later in the disease process. As such, it should be used more liberally than conventional photography to allow the clinician to assess the disease state at both an anatomic and metabolic level.
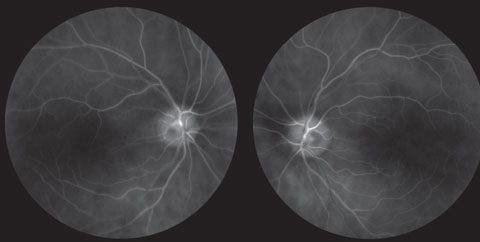 |
| Fig. 5. This multispectral imaging photo shows two healthy eyes. With this system, the wavelengths of LED sourced light are used to highlight the oxyhemoglobin molecule in blood. If oxy heme is present, the image are will appear white. Photo: Dorothy Hitchmoth, OD. |
FAF is exceedingly useful in diseases of RPE dysfunction such as Stargart’s disease and pattern dystrophies that cause hyper FAF; diseases of RPE atrophy, such as geographic atrophy; hereditary RPE or macular dystrophies that cause hypo FAF; subretinal autofluorescent accumulation disorders such as vitelliform dystrophies and central serous chorioretinopathy; window defects in the cases of white dot syndromes and macular telangiectasia; and other diseases of increased lipofuscin deposition including optic disc drusen and astrocytic hamartomas. It is also now a recommended objective modality of monitoring for Plaquenil maculopathy, along with multifocal ERG and spectral domain OCT. Hyper FAF is likely to precede visual acuity or visual field loss due to macular toxicity.4
FAF can also help differentiate between clinically similar looking retinal diseases, or to confirm a suspected diagnosis. An example is adult onset vitelliform dystrophy (AOVD) versus age-related macular degeneration (AMD). Both have risk for choroidal neovascular membranes (CNVM) that should be monitored carefully, but AMD is much more likely to progress to severe vision loss so it should be monitored more closely and AREDS therapy should be initiated. Similar to fundus photography, the software for many FAF cameras allow for caliper measurements. That way, if any hypofluorescence or hyperfluorescence is imaged, it can be measured and monitored over time.
Figures 3 and 4 show a patient who, funduscopically, has a large, central, yellow, elevated lesion, but also has pinpoint surrounding drusen. FAF can help determine if the retinal dysfunction is concentrated solely in the lipofuscin-filled yellow lesion—diagnostic for AOVD—or if it is more diffuse with mixed hypoautofluorescence and hyperfluorescence, indicating AMD is more likely. In this case AOVD was confirmed with FAF and other diagnostic techniques, and the patient is being monitored and managed accordingly.
Peeling Back The Layers
Multispectral imaging (MSI) is another noninvasive imaging technique that allows individual assessment of retinal layers and choroid based on their absorption spectra (Figure 5). Monochromatic LED wavelengths ranging from 450nm to 800nm dissect the in vivo retina and choroid into spectral slices.5 This allows a gradual examination of differing depths of tissue to a microscopic degree unavailable with funduscopy, fundus photography or FAF.
MSI takes advantage of five light-absorbing molecules in the eye called chromophores. These chromophores are retinal hemoglobins, choroidal hemoglobins, choroidal melanin, RPE melanin and macular pigment.6 Each chromophore absorbs a different wavelength of light and can be imaged separately with MSI technology. Generally, longer wavelengths—including those beyond the human visible spectrum—image deeper elements of the posterior segment. A compilation of scans shows a topographical map of each layer of the retina from the inner limiting membrane through the choroid. These en face progressive images enhance our ability to localize and interpret retinal pathology.
MSI allows a detailed analysis of the RPE and choroid without interference from the anterior retinal structures, which is helpful in evaluating early outer retinal diseases. Unlike FAF, which extrapolates RPE health from its metabolic activity, MSI can directly visualize RPE structural changes. This is especially beneficial in early AMD cases when the RPE undergoes subtle physical changes only visable through MSI. Focal hyperpigmentation, seen in long wavelength spectral slices, is often not visualized with funduscopy, color photography, FAF or OCT. MSI is especially helpful in evaluating macular pigment, which has a protective role in the retina and is important in the development and progression of AMD. MSI allows the practitioner to examine variation in pigment distribution to identify individuals at risk of developing visual loss and to change treatment accordingly. In addition, MSI can image lipofuscin and melanin, giving it credible applications for a wide variety of inner and outer retinal diseases and choroidal pathology including retinitis pigmentosa; congenital retinal pigment epithelial hypertrophy (CHRPE); hyperpigmentation after reabsorption of fluid as in central serous chorioretinopathy (CSCR) and adult-onset vitelliform dystrophy (AOVD); choroidal nevi and melanoma; and for drug induced retinal toxicity due to Plaquenil (hydroxychloroquine, Sanofi-Aventis), as it has an affinity for melanin.7
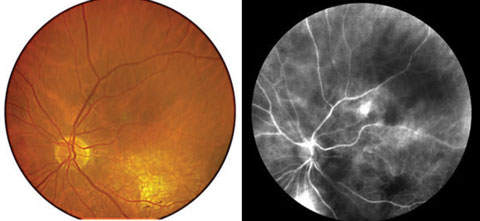 |
| Figs. 6 and 7. Perfusion mapping (right) compared with a color fundus photo. The area of hyperperfusion superior indicates leakage and CNVM, which was confirmed with FA. |
Once retinal disease is apparent, MSI can identify subtle progression that standard methods cannot. These differences can be used to track disease progression in three-dimensional space: length, width and exact depth within retinal layers.
In addition to retinal imaging, the Retinal Health Assessment (RHA) MSI (Annidis Health Systems) also offers a perfusion map feature that can identify exudative retinopathy. Perfusion mapping examines oxygenated—as opposed to deoxygenated—hemoglobin to assess change in retinal vasculature (Figures 6 and 7). It has the ability to identify early choroidal neovascularization noninvasively in an optometric setting, unlike fluorescein angiography.
In the normal eye, retinal arteries appear brighter (hypersaturated) compared with veins because of their oxygenation level. The choriocapillaris is also imaged with this technique, which has been described as a virtual indocyanine green (ICG). If leakage is present from a neovascular membrane, the area appears hypersaturated and the net can be visualized. The hypersaturation in perfusion mapping in exudative AMD tends to agree with late-phase fluorescein angiography leakage and thus an active CNVM.
MSI can be performed to evaluate any stage of retinal or choroidal disease. In early stages, unexpected structural alterations may be found that cannot be viewed with either conventional imaging or funduscopy. It can distinguish overlapping or occult disease and can evaluate retinal vasculature abnormalities.
Because it is capable of detecting these invisible funduscopic changes, it can be used as a screening device for certain patient populations, specifically those at risk for macular degeneration, diabetic retinopathy or macular edema, and in children with a family history of hereditary macular degeneration. In these cases it is prudent to offer this as part of an annual comprehensive examination for earliest detection and intervention to improve long-term outcomes.
Optical Coherence Tomography
OCT is extremely helpful with retinal—specifically macular—diagnoses. It has enhanced identification and treatment of subtle and subclinical signs of a multitude of retinal disease and it also aids in differentiating disease entities that are similar in clinical appearance. Certainly the advent of spectral domain (SD), compared with time domain (TD), OCT has made diagnoses even more concrete with high definition technology and deep choroidal imaging. New OCT software has the ability to examine the inner and outer retina simultaneously or separately and can show en face imaging for macular surface disease such as epiretinal membrane.
OCT is a pseudohistologic study in cross-section. Although it has not replaced fluorescein angiography for the identification and localization of CNVM in neovascular AMD, it has decreased the use of this somewhat invasive procedure.8 It can accurately detect even subtle fluid accumulation under or within the retina that can’t always be visualized clinically.
For example, a patient presented with no reported symptoms for her annual comprehensive examination. Upon dilation, a large microaneurysm with exudate was noted close to the foveal avascular zone (FAZ) in her right eye. Central FAZ fluid could not be visualized during funduscopy, but because of the likelihood of macular edema being present due to the amount of exudate seen, an OCT was ordered (Figure 8). The OCT confirmed subtle cystic spaces centrally in her right eye. She was referred to a retinologist who agreed with the diagnosis. Because subtle edema was evident on OCT, focal laser treatment was promptly recommended to prevent further leakage, fluid accumulation and possible permanent deterioration to her central vision. The macular edema and microaneurysm resolved without permanent consequence to her vision. If the OCT did not show macular edema, treatment would have been deferred, and monitoring would have been more appropriate.
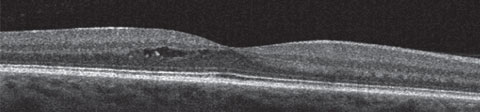 |
| Fig. 8. This image of subclinical central macular edema is due to a temporal macular large microaneurysm and can only be detected with OCT. It would not visible on funduscopy or fundus photography. |
Because of the many benefits of OCT, it should be used to obtain a baseline on all macular disease states. Most OCT instruments have software to calculate thickness change to microscopically measure macular edema, thickening or atrophy between serial scans. OCT has proven more sensitive in identifying diabetic macular edema than a clinician during funduscopy and fluorescein angiography.9,10 It is clinically useful in a wide variety of macular diseases, including; vitreomacular traction, epiretinal membrane, RPE detachments, macular degeneration, Central serous chorioretinopathy (CSCR), vitelliform dystrophy, hereditary macular dystrophies, any form of macular edema and toxic maculopathy. It will often identify microscopic macular disturbances before it progresses to being funduscopically visible.
Similar to FAF, SD-OCT is now a recommended testing guideline to diagnose Plaquenil maculopathy prior to visual acuity loss, color vision or visual field deficit.4 It also has great benefits for glaucoma patients by measuring both retinal nerve fiber layer thickness and calculating change over time, as well as ganglion cell complex thickness—which is becoming ever more important in the diagnosis and management of glaucoma.
Additionally, OCT imaging of the cornea, iris and angle is now more advanced and more detailed than ever before and, as a result, is used on a more frequent basis to improve upon our ability to manage anterior segment diseases.
OCT Offspring
OCT has been improving since its advent. First generation OCT was TD-OCT, which translated the path length of the reference arm for depth information about the retina longitudinally with time. SD-OCT, which measures the inferometric signal as a function of optical frequencies, allows faster imaging with increased detail and greater number of images per scan compared with TD-OCT with less artifacts and noise.11 However, SD-OCT is still somewhat insensitive to higher frequencies, which is why the quality of the signal decreases with depth of the posterior segment.
To compensate for this, enhanced depth imaging (EDI-OCT) was made to move the peak of sensitivity inward, allowing for imaging beneath the RPE into the choroid and lamina cribrosa. Imaging of the choroid is helpful in several retinal pathologies including measurements of choroidal changes, such as nevi and melanoma, as well as retinal diseases that have a direct effect on the choroid. Notably, investigators have found the choroid is significantly thickened in CSCR, leading scientists to believe that increased hydrostatic pressure in the choroid is a direct cause.12 Age-related choroidal atrophy, which was also associated with loss of visible blood vessels, was discovered with EDI-OCT studies.13 Patients with age-related choroidal atrophy may be at a higher risk to develop glaucoma or macular degeneration.13
OCT technology continues to evolve and improve today. Now called the third generation of OCT, swept source OCT (SS-OCT) scans through a series of wavelenghts and interprets the spectral components in time as opposed to spatial separation. This provides low artifacts while achieving exceptional quality at extremely high frequencies. The result is a deeper range of imaging into the eye, a higher axial resolution and faster scanning speed. This larger range of imaging allows the same sensitivity over the entire scan window, which allows the vitreous, retina, choroid and lamina cribrosa to be visualized at the same time. SS-OCT also has the capability for widefield scanning to image both the disc and macula in a single scan. This benefit makes imaging off-axis pathology, such as choroidal nevi, much easier with a larger target area. As compared with SD-OCT—which segments full thickness, inner and outer retina—SS-OCT can automatically segment the retina into seven layers: internal limiting membrane, retinal nerve fiber layer, macular ganglion cell layer, inner segment-outer segment junction, RPE, Bruch’s membrane and choroid, making it easy to delineate the precise anatomic location of deficits.14 The new generation of OCT provides better image quality, more easily interpreted and more repeatable than previous models.
Both SD-OCT and SS-OCT are being used to image retinal blood flow known as OCT-angiography (OCT-A) without the use of intravenously injected fluorescein or indocyanine green. Speed of imaging is particularly vital to the quality of an OCT-A image, which is one reason why SS-OCT will be of great benefit to optometrists as this technology becomes more widespread. OCT-A uses an algorithm known as split-spectrum amplitude-decorrelation angiography to detect motion in blood vessels by the variation in reflected OCT signal amplitude between consecutive scans. This algorithm can quantify data on both flow index—a measure of capillary flow velocity—and blood vessel density. Clinically, it detects capillary dropout as well as neovascularization. It differs from both FA and ICGA, as it does not measure leakage from blood vessels; rather, it images exact delineation and size measurements of aberrant blood vessels (such as seen with choroidal neovascularization), or lack thereof. It is also able to correspond blood flow and measurement information in tandem with OCT B-scans. The clinician can scroll through an OCT cube, just as in SD-OCT 3D imaging, to view the precise location of pathology. While OCT-A is able to image both retinal and choroidal microvasculature, FA is better for retinal abnormalities and ICGA is more ideal in choroidal imaging.15
Conditions best studied with this novel technology include macular degeneration, diabetic retinopathy, macular edema, and retinal vein and artery occlusions. Although this is a new technique, it is likely to play a large role in the management of all ocular diseases that affect the vasculature of the retina or choroid.
Furthermore, because it is less invasive than either FA or ICGA, it will be more frequently employed, likely aiding in identifying neovascularization or blood vessel dropout much easier throughout the population than ever before.
OCT is such a dynamic tool in optometric practice that it can and should be used on almost all retinal conditions as baseline. The timing of retesting is determined on a case-by-case basis. Because it is such a versatile instrument that yields information not able to be visualized with funduscopy, it is exceedingly useful for serial monitoring to determine prompt initiation or change to treatment.
Retinal Oximetery
This new, noninvasive technology is designed to calculate relative oxygen saturation of retinal blood vessels. The ratio between a wavelength of light sensitive to oxygen saturation and a wavelength control that calibrates light intensity is linearly related to hemoglobin oxygen saturation.16 Specifically, it calculates retinal vessel oxygen saturation and vessel width, which has been shown to be different in a variety of retinal diseases, including: exudative AMD, retinitis pigmentosa and in retinal vascular diseases such as central retinal vein occlusion (CRVO) and central retinal artery occlusion (CRAO).17-20
Although this is a relatively new technology, studies show dual wavelength oximetry can help doctors identify diseases that affect retinal vasculature.21 Retinal oxygen saturation is lower in venules affected by CRVO, variable in BRVO, lower in retinal arterioles during CRAO and is increased in diabetic retinopathy, according to investigators.21 Clinically, it can be helpful in identifying the extent of retinal vascular disease to better determine a prompt treatment plan and discuss a more accurate prognosis. Because of the simple graphics in the software, it is also easier for patient education than fluorescein angiography.
Retinal imaging has greatly enhanced the diagnosis and management of a multitude of ocular disease. Baseline imaging in the appropriate modalities can be invaluable. Some imaging technology has the ability to capture retinal function before it affects funduscopic structure. Others can, in detail, image single layers of retinal tissue and identify defects that are invisible during a dilated fundus examination. Noninvasive imaging is also starting to help clinicians diagnose retinal vasculature status, and may someday be able to take the place of invasive fluorescein angiography.
It is vital to understand the clinical utility of each imaging modality in order to appropriately order, interpret and repeat imaging in the future. In doing so, it can benefit the patient by improving clinical diagnosis and management without unnecessary overuse.
Dr. Legge is in private practice at Wyomissing Optometric Center in Pennsylvania and has an advanced retinal studies certificate through Salus University.
|
1. Wing G, Blanchard G, Weiter J. The topography and age relationship of lipofuscin concentration in the retinal pigment epithelium. Invest Ophthalmol Vis Sci. 1978;17(7):601-7. 2. von Rückmann A, Fitzke F, Bird A. Distribution of fundus autofluorescence with a scanning laser ophthalmoscope. Br J Ophthal. 1995;79:407-12. 3. Eldred G, Katz M. Fluorophores of the human retinal pigment epithelium: separation and spectral characterization. Exp Eye Res 1988;47(1):71-86. 4. Marmor M, Kellner U, Lai T, et al. Revised recommendations on screening for chloroquine and hydroxychloroquine retinopathy. Ophthalmol. 2011 Feb;118(2):415-22. 5. Annidis. The Technology. Available at: www.annidis.com. Accessed: May 2016. 6. Everdell N, Styles I, Calcagni A, et al. Multispectral imaging of the ocular fundus using LED Illumination. Rev Sci Instructum. 2010 Sept;81(9):093706. 7. Bone R, Brener, B, Gilbert, J. Macular pigment, photopigments, and melanin: distributions in young subjects determined by four wavelength reflectometry. Vis Res. 2007;47(26):3259-68. 8. American Academy of Ophthalmology Retina/Vitreous Panel. Preferred Practice Pattern Guidelines. Age-related macular degeneration. San Francisco, CA:American Academy of Ophthalmology; 2015. 9. Browning D, McOwen M, Bowen R, Marah T. Comparison of the clinical diagnosis of diabetic macular edema with diganosis made by optical coherence tomography. Ophthalmol. 2004, April;111(4):712-5. 10. Ouyang Y, Keane P, Sadda S, Walsh A. Detection of cystoid macular edema with three-dimensional optical coherence tomography versus fluorescein angiography. Invest Ophthalmol Vis Sci. 2010 Oct;51(10):5213-8. 11. Drexler W, Sattmann H, Hermann B, et al. Enhanced visualization of macular pathology with the use of ultrahigh-resolution optical coherence tomography. Arch Ophthalmol. 2003;121(5):695–706. 12. Maruko I, Iida T, Sugano Y, et al. Subfoveal choroidal thickness after treatment of central serous chorioretinopathy. Ophthalmol. 2010;117(9):1792-99. 13. Spaide RF. Age-related choroidal atrophy. Am J Ophthalmol. 2009;147(5):801-10. 14. Copete G, Flores-Moreno I, Montero J, et al. Direct comparison of spectral-domain and swept-source OCT in the measurement of choroidal thickness in normal eyes. Br J Ophthalmol. 2014;98:334-38. 15. Schwartz D, Fingler J, Kim D, et al. Phase-variance optical coherence tomography: a technique for noninvasive angiography. Ophthalmol. 2014;121:180–7. 16. Beach J, Schwenzer K, Srinivas S, et al. Oximetry of retinal vessels by dual-wavelength fundus imaging: calibration and influence of pigmentation. J Appl Physiol. 1999 Feb;86(2):748-58. 17 Geirsdottir A, Hardarson S, Olafsdottir O, Stefansson E. Retinal oxygen metabolism in exudative age-related macular degeneration. Acta Ophthalmol. 2014 Feb;92(1):27-33. 18. Eysteinsson T, Hardarson S, Bragason D, Stefansson E. Retinal vessel oxygen saturation and vessel diameter in retinitis pigmentosa. Acta Ophthalmol. 2014 Aug:92(5):449-53. 19. Hardarson S, Stefansson E. Oxygen saturation in central retinal vein occlusion. Am J Ophthalmol. 2010 Dec;150(6):871-5. 20. Hardarson S, Elfarsson A, Agnarsson B, Stefansson E. Retinal oximetry in central retinal artery occlusion. Acta Ophthalmol. 2013 Mar;91(2);189-90. 21. Hardarson S. Retinal oximetry. Acta Ophthalmol. 2013 Mar;91 Thesis 2:1-47. |
