 |
|
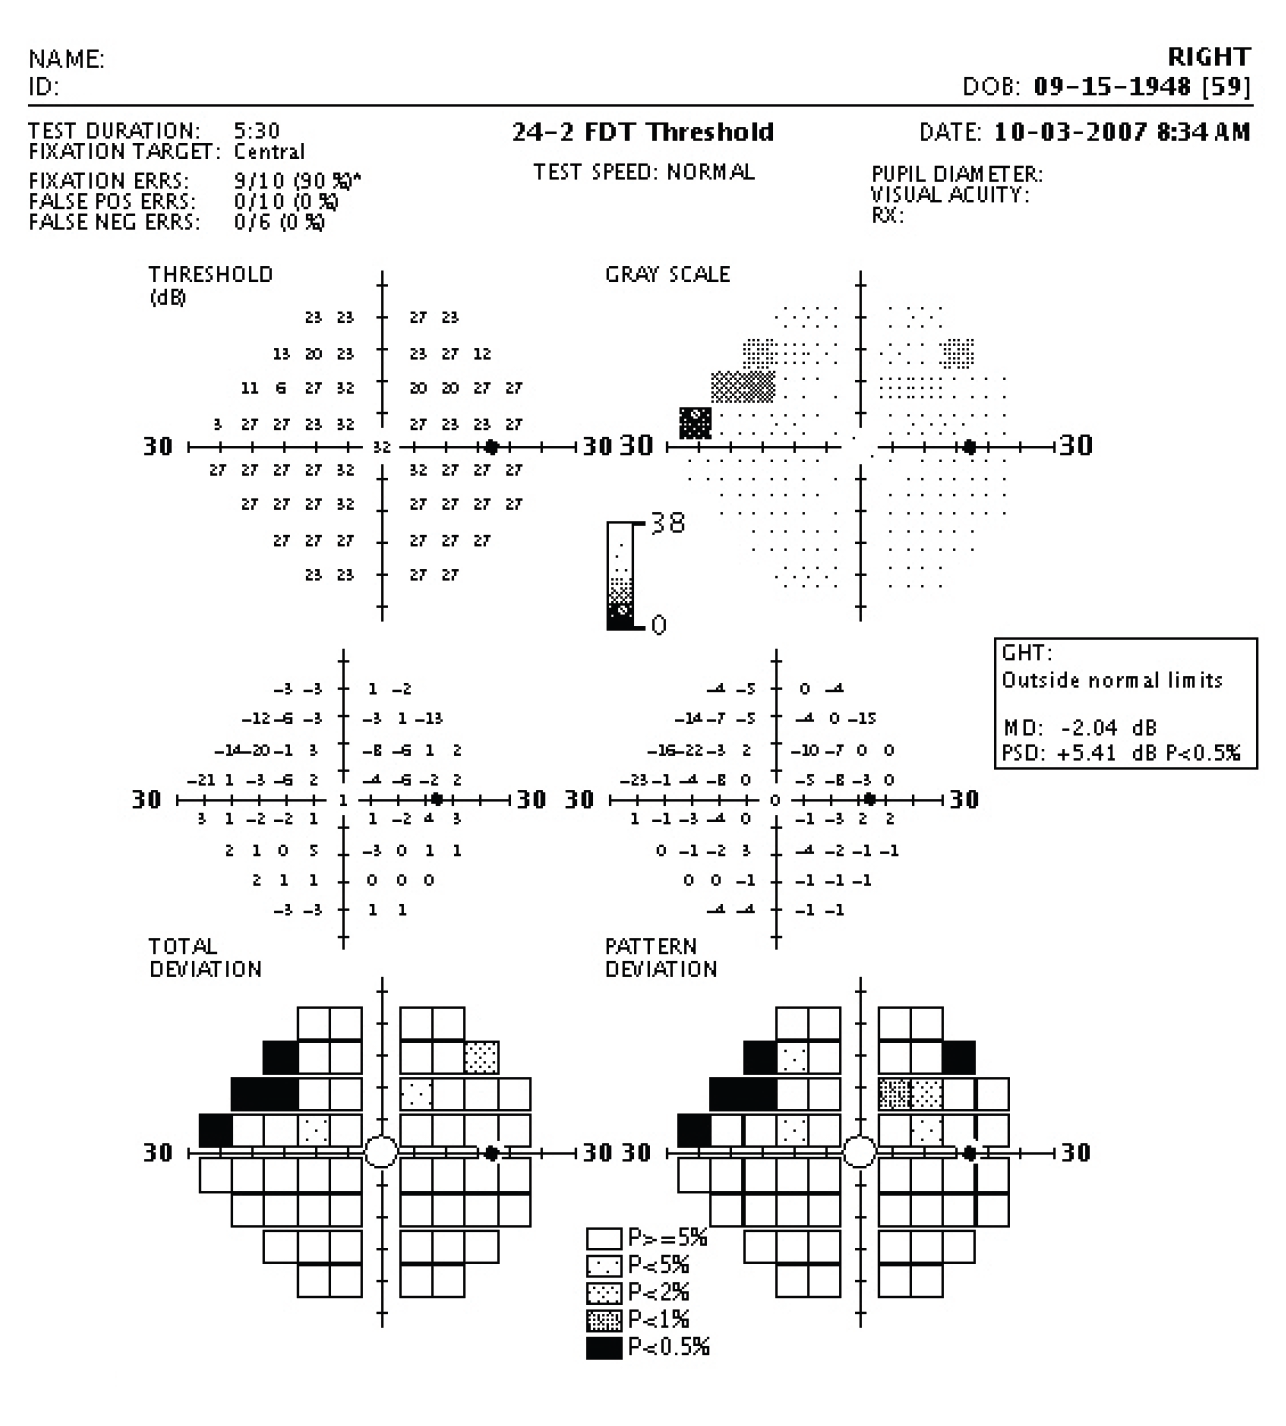
Variability of standard automated perimetry increases in areas of glaucomatous loss. Photo: Carl Zeiss Meditec. Click image to enlarge. |
In clinical care for patients with glaucoma, accurately measuring the rate at which functional loss is progressing is vital for making treatment decisions. So, accurate rate measurements require either very frequent testing (which is inconvenient for patients) or long follow-up durations (during which more disease progression may have occurred). By minimizing and quantifying the algorithm-dependent short-term variability in standard automated perimetry, one research team believes they can pinpoint true fluctuations in sensitivity between visits. A recent study in Translational Vision Science and Technology demonstrated that this long-term variability increases markedly in regions of glaucomatous loss.
Four locations were chosen for testing, including at least two with significantly reduced sensitivity that remained ≥6dB (i.e., not perimetrically blind), with the locations spaced around the visual field in all four quadrants to promote stable fixation during testing. The researchers measured frequency-of-seeing curves in 35 participants with glaucoma. The standard deviation of cumulative Gaussian fits to those curves was modeled for a given sensitivity and used to simulate the expected short-term variability of a 30-presentation algorithm.Then, the team tested that algorithm twice on a separate cohort of 137 participants—six months apart—to calculate long-term variance at different sensitivities.
Long-term and short-term variability both increase with damage for perimetric stimuli smaller than Ricco's area. Below 28dB, short-term variability increased linearly with loss. Long-term variability also increased with damage below this point, attaining a maximum standard deviation of 2.4dB at sensitivity 21dB, before decreasing due to the floor effect of the algorithm. Above 30dB, the observed test-retest variance was slightly smaller than the simulated short-term variance.
Above 28dB, long-term variability constitutes a negligible proportion of test-retest variability. For these locations with near-normal sensitivity, test-retest variability is driven almost entirely by the short-term variability caused by the probabilistic nature of the frequency-of-seeing curve.
“Our results therefore emphasize that adjusting the testing algorithms to reduce short-term variability may not be enough by itself to meaningfully improve the repeatability of perimetry,” the researchers wrote in their paper. “It is important to also reduce long-term variability, which can be greater than short-term variability in regions of glaucomatous loss.”
Possible approaches they proposed included shortening the test to reduce patient fatigue or altering it to make it more engaging and less stressful for the patient.
Gardiner SK, Swanson WH, Mansberger SL. Long- and short-term variability of perimetry in glaucoma. Transl Vis Sci Technol. 2022;11(8):3. |
