 |
|
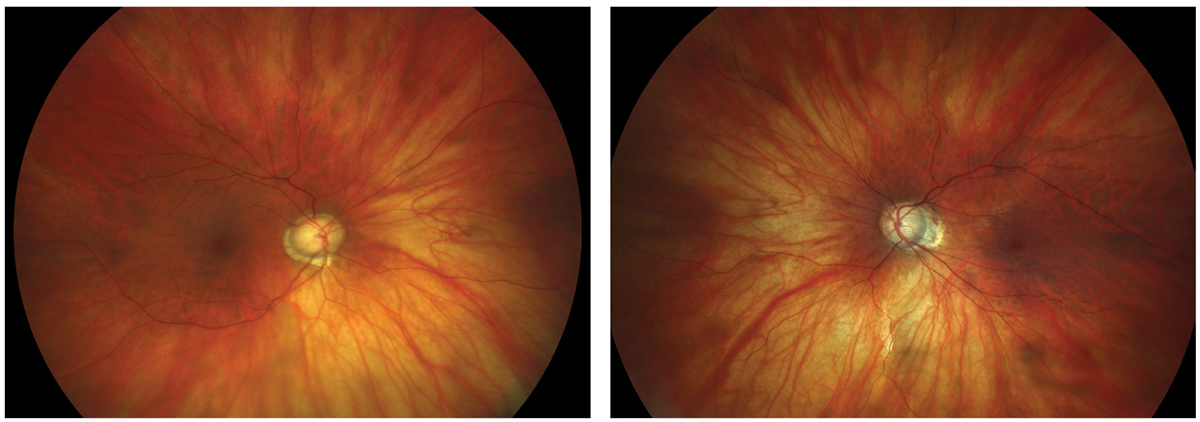
Variations in myopia definitions yield different prevalences of the condition, making cross-study comparison difficult, but findings from this study may offer a new means of comparison. Click image to enlarge. |
The absence of unified definitions and criteria for diseases can stymie research by making it difficult to compare the results of multiple studies. In the case of a study recently published in Ophthalmic Epidemiology, myopia and high myopia definitions were found to vary considerably, and researchers sought to examine how those differing definitions affect prevalence estimates. They reported that a standard definition is sorely needed but were able to offer a “conversion rate” to enable cross-study comparisons.
The population-based, cross-sectional study included 1,588,508 Israeli adolescents (at least 17 years old) who had undergone non-cycloplegic autorefraction as part of a medical fitness assessment for mandatory military service between 1993 and 2015. The researchers found nine different definitions of myopia and seven definitions of high myopia. They calculated prevalence estimates for each definition and compared those to a reference definition to produce a ratio rate across definitions.
The reference definition was right eye spherical equivalent (SE) ≤-0.50D and ≤-6.00D for myopia and high myopia, respectively. Using this myopia definition, a 31% myopia prevalence was reported. The table below summarizes additional myopia prevalence estimates and ratio rates.
The researchers reported a wider range of high myopia prevalence, with a 1.7-fold increase when using the narrower criteria SE ≤-5.00D vs. the reference definition SE ≤-6.00D, yielding 4.2% and 2.4%, respectively.
“Variations were accentuated across high myopia definitions, in which stricter threshold-derived prevalence estimates almost doubled,” the researchers wrote in their paper. “These findings emphasize the need for standardization of myopia definition and support the prerequisite of sensitivity analyses exploring alternative definitions under specific circumstances.”
Additionally, they pointed out in their paper that the ratio rates they derived can be used as estimates of a “conversion rate” to help compare the findings of studies using varying myopia definitions.
Table 1. Myopia Prevalence by Definition
Definition | Prevalence | Ratio Rate | Reduction in Myopia Ratio Rate |
Right eye SE | 28.8% | 0.93 | 7.1% |
Right eye SE | 26.3% | 0.85 | 15.1% |
Least minus meridian | 26.9% | 0.87 | 13.4% |
Nitzan I, Akavian I, Einan-Lifshitz A, et al. The definition-dependent nature of myopia prevalence: a nationwide study of 1.5 million adolescents. Ophthalmic Epidemiol. January 4, 2023. [Epub ahead of print]. |

