 |
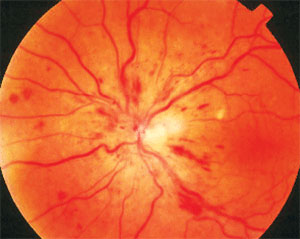
Through month 60 of anti-VEGF therapy, this study found that the following variables were not correlated to VA change or treatment intensity: presence of subretinal fluid, intraretinal cystoid spaces and intraretinal fluid, DRIL, continuity of the EZ, presence of retinal hemorrhage and percent of area of nonperfusion in the NETWORC and ETDRS grids. Click image to enlarge. |
In 2017, a group of researchers performed a study known as SCORE2 (Study of COmparative Treatments for REtinal Vein Occlusion 2) to evaluate the outcomes of patients treated with off-label bevacizumab vs. FDA-approved aflibercept. The six-month visual acuity results showed that, in eyes with macular edema associated with non-ischemic central RVO (CRVO) or hemiretinal vein occlusion (HRVO), bevacizumab was noninferior to aflibercept.
This week in the American Journal of Ophthalmology, the SCORE2 research group published the study’s long-term results in a new report that followed 362 participants for up to 60 months. The goal of the follow-up analysis was to assess how anti-VEGF treatment affected imaging findings over time and to potentially correlate these findings to treatment outcomes, such as visual acuity and the number of treatments received.
Throughout the 60-month follow-up period, the group performed visual acuity, injection frequency and imaging tests, including color fundus, OCT and ultra-widefield fluorescein angiography (UWFA). The following eight imaging variables were assessed:
- On OCT: presence of subretinal fluid, intraretinal cystoid spaces and intraretinal fluid, disorganization of the retinal inner layers (DRIL) and continuity of the ellipsoid zone
- On color fundus: presence of retinal hemorrhage
- On UWFA: percent of area of nonperfusion in the NETWORC Grid and the ETDRS grid
The data showed that the most likely imaging variable to resolve was subretinal fluid; at month 60, less than 6% of eyes had this finding, down from 67% at baseline. Other imaging findings that diminished over time included intraretinal cystoid spaces, intraretinal fluid on OCT and intraretinal hemorrhage on color photography. On the other hand, the most common finding to persist despite treatment was DRIL, found in 96% of patients at baseline and 95% at month 60.
With respect to UWFA findings, at baseline, the researchers reported a mean of 5.0% non-perfusion area in the NETWORC grid, which hardly changed through month 60. For the ETDRS grid at baseline, they noted a mean of 2.3% nonperfusion area that also showed little change through month 60. The researchers point out that the relatively stable OCT findings seen over 60 months of follow-up in this study speak to the need for consistent injections in patients with central or hemiretinal RVO.
“It is possible that there was no appreciable reduction of the area of non-perfusion over time because anti-VEGF was provided and the untreated natural history of HRVO and CRVO would be to have progressive increases in non-perfusion area as prior studies have suggested,” the study group explained.
Interestingly, between months 12 and 60, the researchers reported that none of the eight imaging variables measured at baseline correlated to visual acuity change or the number of injections administered. They noted in their paper that in the original SCORE2, “we performed a similar analysis at two years, and early change in visual acuity was found more predictive than any OCT variable for future visual acuity change.” The results of this 60-month analysis agree with those initial findings, they added. Considering this, they advise clinicians against using the eight variables described above to predict visual acuity or intensity of treatment.
In summary, the group wrote, “The results from this report showing that at 60 months many of the anatomic disruptions at baseline were still present provide an additional anatomic explanation for why clinical practice patterns should emphasize continued assessment and individualized treatment and also help to explain persistent functional deficits many years following initial treatment.”
Ip MS, Scott IU, VanVeldhuisen PC, Oden NL, Blodi BA: SCORE2 Investigator Group. Month 60 imaging findings and relationship to treatment outcomes following anti-VEGF therapy for macular edema due to central or hemi retinal vein occlusion. Am J Ophthalmol. December 5, 2023. [Epub ahead of print]. |
