 |
|
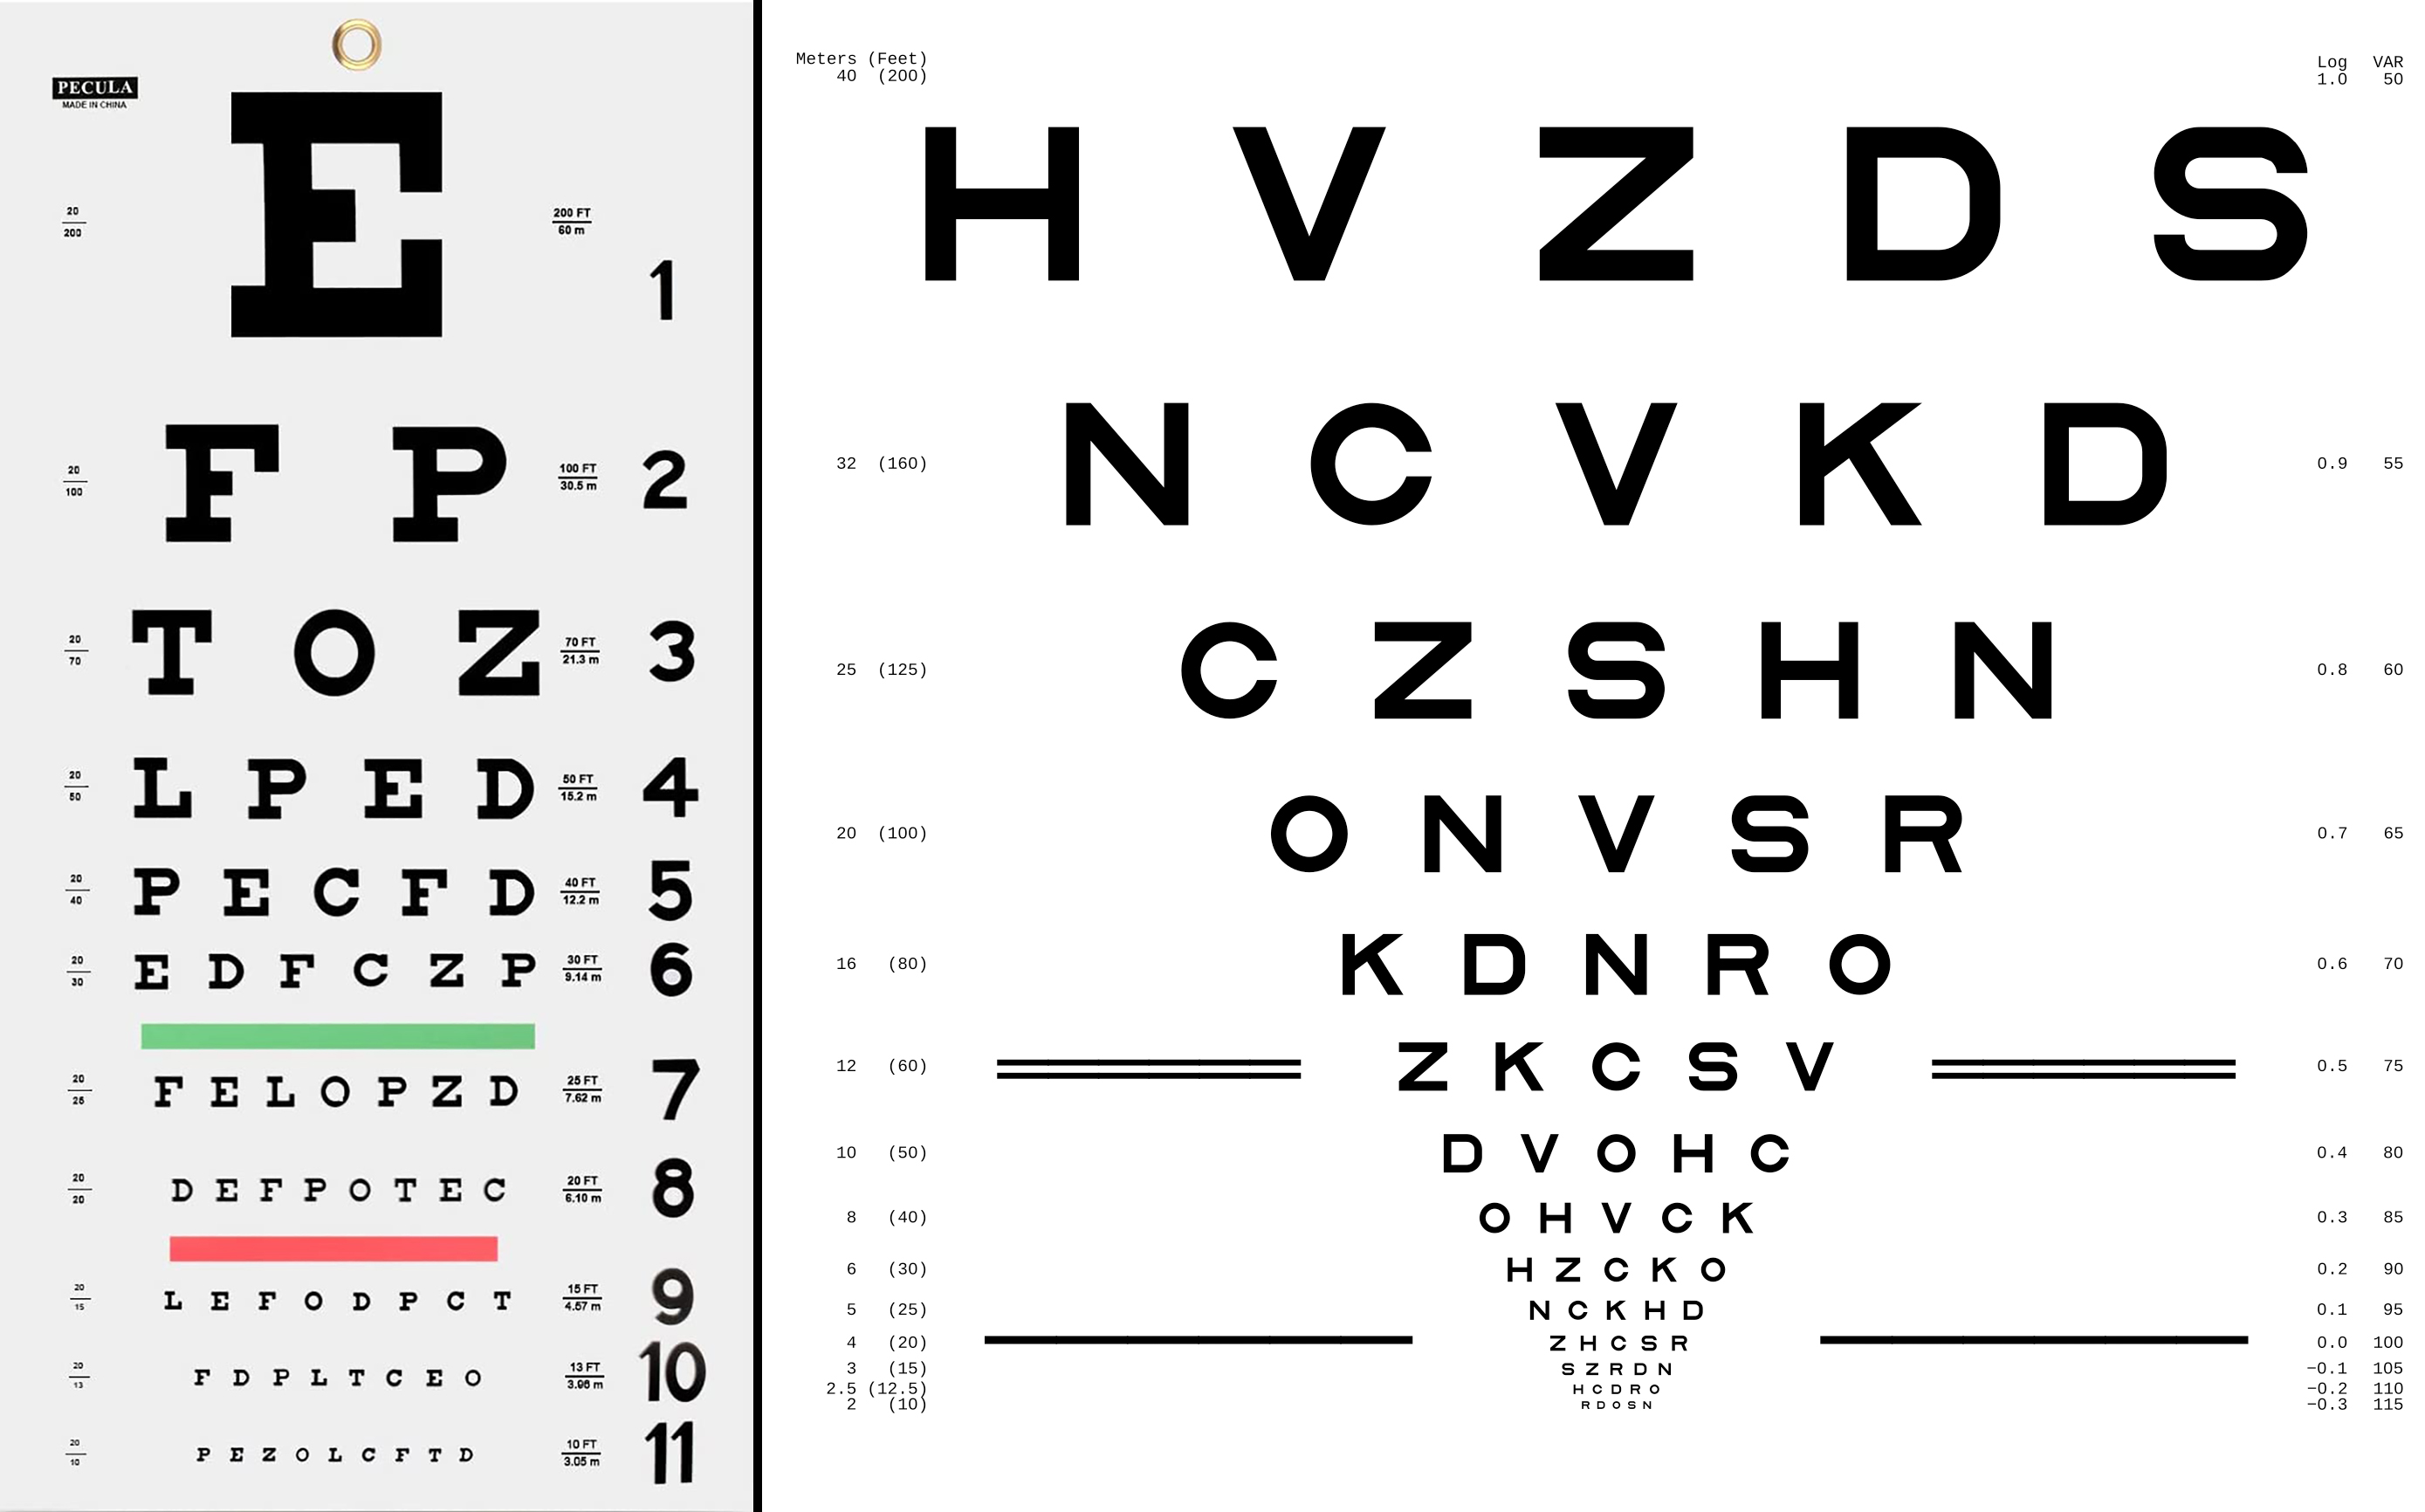
An assessment of differences between Snellen and ETDRS VA revealed that the latter test recorded results 7.6 letters (~1.5 lines) better on average. Click image to enlarge. |
Current clinical trials involving retinal disease usually quantify and report outcomes for visual acuity (VA) with measurements using modified ETDRS protocols for refraction. Testing with either ETDRS VA charts or an eETDRS is required for FDA registration trials. However, the ultimate purpose of VA measurements in a clinical setting can be different from that of a study. While clinical VA results may help diagnose and assess treatment response, protocol VA measurements often determine a study’s inclusion/exclusion criteria and primary outcome. Converting ETDRS to Snellen VA does not completely account for the differences between the two tools or the differing circumstances of clinical trials and clinical practice. A recent study published in Ophthalmology has demonstrated that, on average, converted clinical Snellen VA measurements were likely to be one to two lines worse than eETDRS protocol refraction and VA testing.
The study assessed the variability in acuity measurement techniques for three different DRCR Retina Network clinical trials across 74 clinical centers. The researchers retrospectively analyzed data from 1,016 eyes of 511 patients. The centers followed varied practices to obtain routine clinical VA assessments three months before referring patients for clinical trial eligibility in which the VA was remeasured using standard eETDRS protocols.
The mean VA measurements were 68.6 letters (Snellen equivalent 20/50) at the clinical visit and 76.3 letters (Snellen equivalent 20/32) at the protocol visit, with a mean of 26 days between visits. Mean protocol VA was better than clinical VA by 7.6 letters overall, 10.7 letters in eyes with clinical VA ≤20/50 (n=376) and 5.8 letters in eyes with clinical VA ≥20/40 (n=640).
On average, the difference between clinical and protocol VA was 1.3 letters smaller for every one-line (five letters) increase in clinical VA. Mean differences by clinical correction of refractive error were 3.9 letters with refraction, 6.9 letters with glasses/contact lenses, 7.9 letters with pinhole and 9.8 letters without correction.
The researchers emphasized that the differences analyzed in their study do not reflect the differences between eETDRS and Snellen measurements tested under the same conditions (e.g., each tested after refraction). Instead, they showed the discrepancies between protocol eETDRS and recent Snellen VA measured in routine practice at the retina clinic that recruited the patient for the protocol.
When applying clinical trial-based guidelines in managing DR and DME, clinicians should be aware that Snellen VA, as measured in clinical care, is likely to be worse than that achieved after eETDRS protocol refraction and VA testing.
“We expect clinical Snellen measurements to be one to two lines lower than protocol eETDRS measurements on average,” the authors of the paper wrote. “However, the difference between measurements for an individual patient may be substantial, particularly at poorer levels of vision.”
They recommend that selecting a treatment plan determined by baseline ETDRS should use a VA testing procedure that includes detailed refraction and mimics the ETDRS protocol testing approach whenever possible.
“The findings of this study may explain, at least in part, why clinical study results are not always reproduced in clinical practice,” the team concluded. “They also suggest that clinicians need better methods for accurate and reliable vision testing in standard clinical practice.”
Baker CW, Josic K, Maguire MG, et al. Comparison of Snellen visual acuity measurements in retinal clinical practice to eETDRS protocol visual acuity assessment. Ophthalmology. December 11, 2022. [Epub ahead of print]. |
