 |
As the patient population ages, the incidence of AMD increases with it. The combination of glaucoma with age-related macular degeneration (AMD) poses a challenge for us to preserve vision, although strides are always being made, like with the two recently approved medications for treatment of geographic atrophy (GA). As you know, GA is a progressive form of dry AMD, accounting for about 10% of dry AMD cases. Here is a case of an 82-year-old Caucasian woman with both advanced glaucoma and fortunately stable GA.
Case
Last seen in October 2023, this pleasant 82-year-old patient was being medicated with 0.5% timolol QAM OU and generic latanoprost QHS OU. She had been on this regimen for the past six years and was maintaining good control of her glaucoma.
She had come to me several years prior as a new patient who carried a diagnosis of open-angle glaucoma, for which she had been medicated with Lumigan (bimatoprost, AbbVie) HS OU. Ultimately, due to increasing ocular surface issues as well as medication cost increases, we decided on the combination of latanoprost and timolol.
At the current visit, her medications included simvastatin, atenolol, metformin, amlodipine, Prozac (fluoxetine hydrochloride, Eli Lilly), lomotil and both ibuprofen and Flonase on a PRN basis with her reporting no allergies any medications. Best-corrected visual acuities were 20/40 OU through hyperopic astigmatic correction. Pupils were ERRLA with no afferent pupillary defect and extraocular movements were full in all positions of gaze.
 |
|
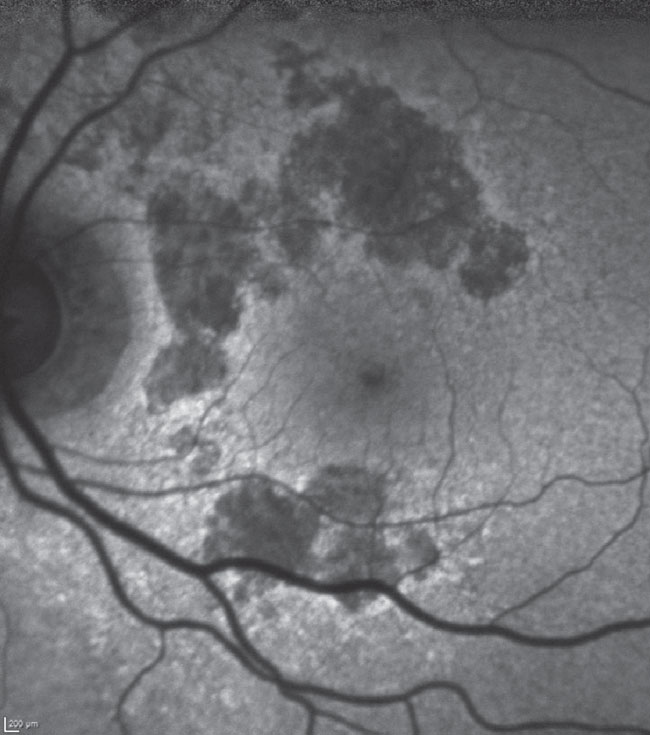
Fig. 1. Fundus autofluorescence of the patient’s left macula. Hypofluorescent areas are surrounding, but not involving, the foveal avascular zone, especially above the horizontal raphe. The patient maintains good visual acuity at 20/40 in this eye. Click image to enlarge. |
The anterior segment evaluations at the patient’s most recent visit were essentially unremarkable, though she has had the occasional bout of seborrheic blepharitis. Her corneas were clear, as were the anterior chambers. Angles were wide open in both eyes, as the patient was pseudophakic OU, having undergone cataract surgery five years earlier.
Through dilated pupils, I could see that her intraocular lenses were clear and centered and the posterior capsules were open. Bilateral posterior vitreous detachments were present. Her cup-to-disc ratio was 0.85x0.9 OD and 0.7x0.85 OS; both temporal neuroretinal rims were thinned and no disc hemorrhages were present. The retinal vasculature was slightly attenuated and there was mild arteriosclerosis noted.
Both her maculae were characterized by GA, fortunately in a pattern encircling the foveal avascular zone but not extending into it; there were some drusen subfoveally OU but there was no evidence of choroidal neovascularization. The peripheral retinal examinations were essentially unremarkable, apart from reticular degeneration (Figure 1).
Discussion
With advanced glaucoma at this stage, tight intraocular pressure (IOP) control is essential to preserve her remaining vision. Her pachymetry readings were 531µm OD and 540µm OS, and her treated IOPs over the last three years had averaged 11mm Hg OD and 12mm Hg OS. Her OCTs from a glaucoma perspective had remained stable with stable neuroretinal rims (BMO-MRW), retinal nerve fiber layer (RNFL) thicknesses in the circumpapillary region and ganglion cell macular evaluations. All were thin or reduced due to her advanced glaucoma, but they remained steady where they were.
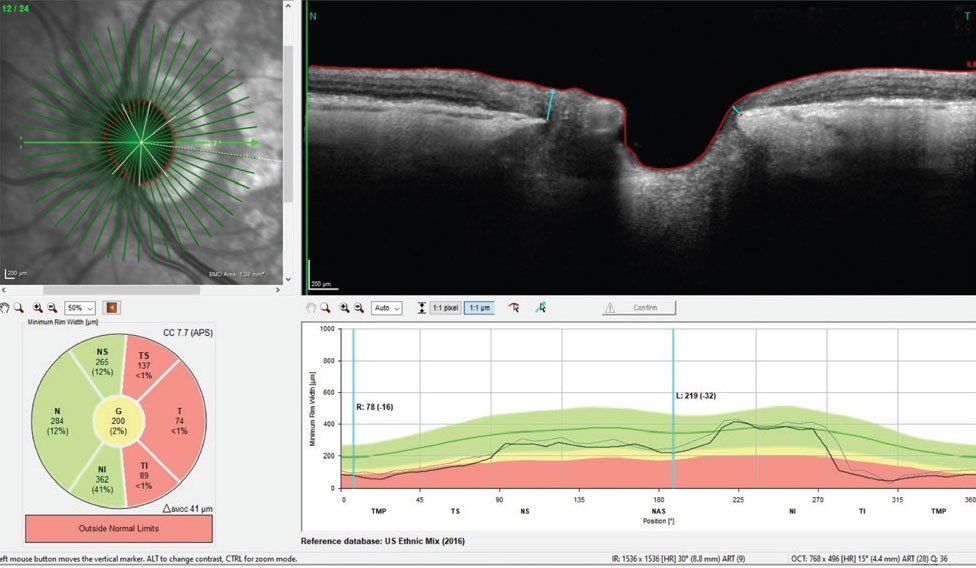
What was somewhat different over the last four years were changes associated with AMD. Namely, the central subfoveal drusen had slightly increased over this period and the GA changed minimally over the same period. Figure 2 shows the thinned neuroretinal rim of her left eye.
 |
|
Fig. 2. BMO-MRW measurements of the left neuroretinal rim. Note, especially inferotemporally, the erosion of the neuroretinal rim, which accounts for her superior nasal step field defect in the same eye. Click image to enlarge. |
At this point, you’re likely wondering about her visual fields: Were they stable? What did they look like? As you can imagine, the fields were consistent with both advanced glaucomatous damage and central disruption owing to the AMD.
 |
|
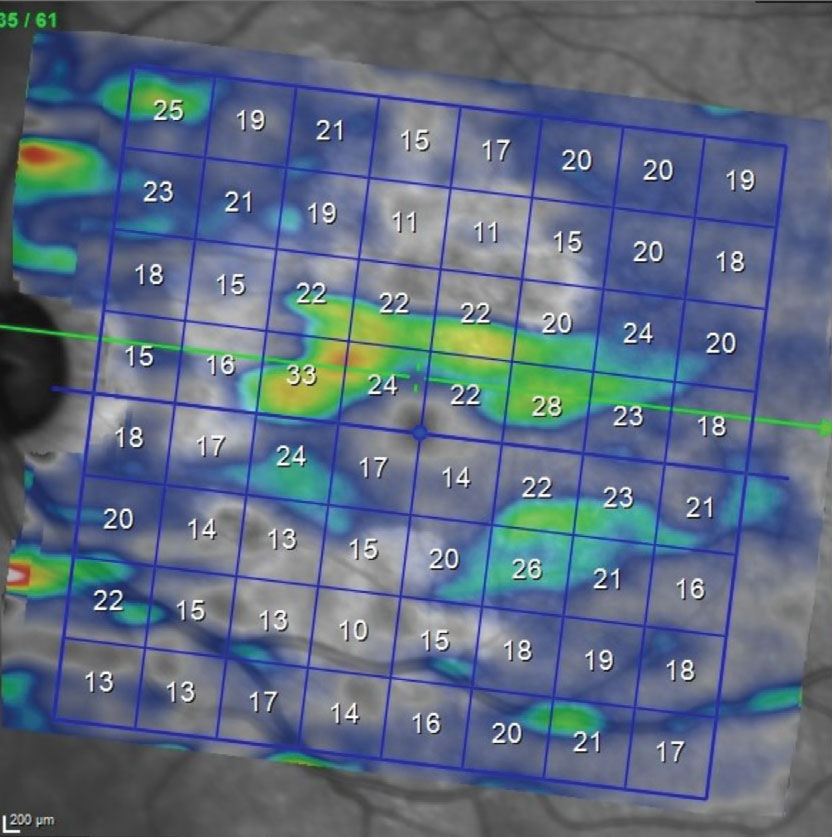
Fig. 3. OS macular ganglion cell layer thickness map. Note the paucity of the ganglion cell thickness below the horizontal raphe. This reduction in ganglion cells correlates well with the superior arcuate scotoma seen on the visual field. Note in Figure 1 the asymmetry between the superior and inferior hemispheres related to the GA; of particular importance, the GA is less evident inferiorly than superiorly, enabling us to isolate glaucomatous damage to the ganglion cell layer due to glaucoma rather than AMD. Click image to enlarge. |
In cases like this, it can be difficult to sort out what part of the visual fields are related to AMD and, in particular, what part of the fields are indicative of glaucomatous loss involving fixation, or at least close to fixation. If you have been following a patient for many years, it is somewhat easier to see visual field changes over time correlated with posterior pole changes, as well as be better able to sort out worsening due to AMD, glaucoma or both. When I initially saw this patient, her fields were a mix of both types for field loss.
Glaucomatous field loss is rather predictive as the disease worsens, whereas field loss due to AMD tends to vary. She does in fact have superior arcuate field defects, which do correlate to her neuroretinal rim findings and a visible nasal step in the left eye; however, central fields (within the central 10°) do show more defects associated with AMD than with glaucoma. Overall, it is difficult, if not impossible, to sort out which defects centrally are due to which disease. Fortunately, the patient does maintain relatively good visual acuity OU. At the end of the day, the visual fields can be difficult to dissect in cases like this.
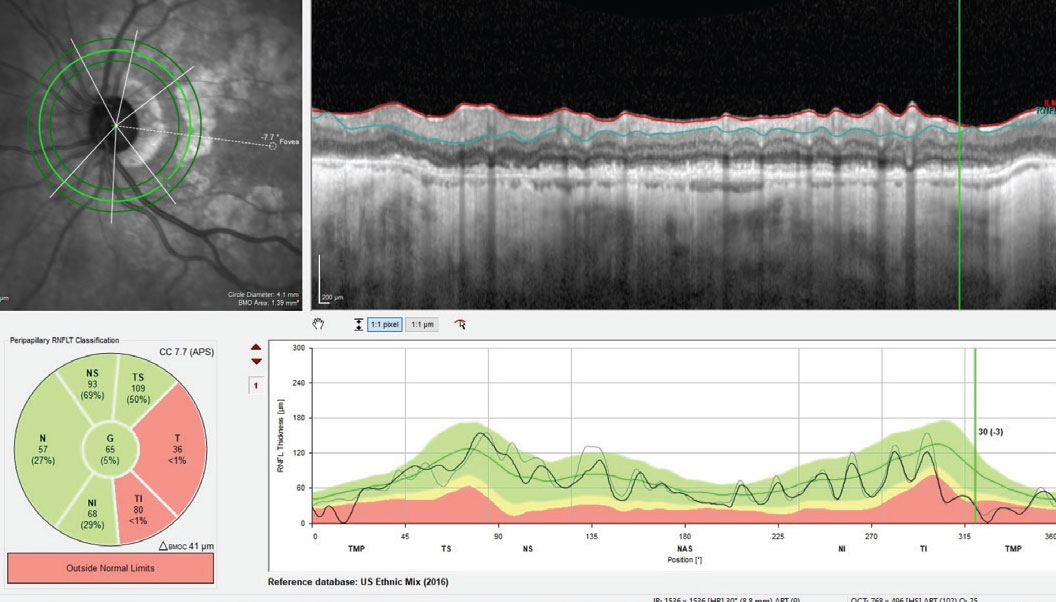
That said, her fundus images fortunately show that the GA is in a perifoveal region and was relatively stable over the past couple years. Neither the glaucoma nor the AMD will “get better,” as we know; the challenge is determining which, if either, are progressing. Luckily, the patient’s macular ganglion scan correlates nicely with the glaucomatous damage (Figure 3) more so than the GA-related damage as seen in Figure 1. This helps tremendously in sorting out damage due to glaucoma vs. AMD. Further complicating interpretation, sometimes GA can interfere with RNFL analysis, too (Figure 4).
While there are current guidelines for administering the recently approved GA medications, those guidelines will invariably change once more patients have been treated. In this patient’s case, she may very well be a good candidate for earlier intervention with these agents, given the advanced state of her glaucoma. We regularly use fundus autofluorescence in all our patients with geographic atrophy; this has a highly predictive benefit of identifying areas of GA more likely to progress. Should her FAF images indicate any move toward central macular progression, she’d be evaluated for possible treatment.
 |
|
Fig. 4. The RNFL circle scan of the left eye. Note that GA particularly can sometimes interfere with thickness readings of the RNFL if the circle scan encompasses areas affected by GA. Click image to enlarge. |
In the interim, serial IOPs, OCT scans and visual fields are still the standard, but at least we now have another tool in our toolbox to help preserve vision; in this case, agents to slow the GA progression. Close monitoring of patients on one of these therapies by a retina subspecialist is critical, as is monitoring done by you and I. n
Dr. Fanelli is in private practice in North Carolina and is the founder and director of the Cape Fear Eye Institute in Wilmington, NC. He is chairman of the EyeSki Optometric Conference and the CE in Italy/Europe Conference. He is an adjunct faculty member of PCO, Western U and UAB School of Optometry. He is on advisory boards for Heidelberg Engineering and Glaukos.
