OCT: Eye Care’s All-Purpose ToolThis versatile device has dozens of functions in eye care today. In the January 2023 issue of Review of Optometry, our experts explore its capabilities in full. Check out the other articles featured in this OCT-themed issue:
|

Glaucoma is a progressive optic neuropathy characterized by the death of retinal ganglion cells and their axons.1 Per this definition then, it behooves the optometric community to examine retinal structures in both qualitative and quantitative ways. OCT technology was designed for this very purpose and, when used properly, it can improve our virtuosity in the management of glaucoma.
The Breakdown
Understanding the anatomy of the OCT is just as important as understanding the information it generates, which can be broken into a few anatomical regions: the retinal nerve fiber layer (RNFL) or circumpapillary RNFL (cpRNFL), the ganglion cell and inner plexiform layers (GC-IPL) and Bruch’s membrane opening minimum rim width (BMO-MRW). In addition to anatomical landmarks, reports and newer parameters exist that further assist physicians in diagnosing and managing glaucoma.
RNFL. This is a widely recognized and extensively researched parameter in the diagnosis and management of glaucoma, as it includes the optic nerve head (ONH) and the surrounding RNFL feeding into the neuroretinal rim. The cpRNFL acquisition and algorithm varies among SD-OCTs, but the data supplied is consistently cohesive, quantifying ganglion cell axonal loss. As the variety of SD-OCTs on the market is substantial, this article will briefly discuss facets of four platforms: the Cirrus HD-OCT (Carl Zeiss Meditec), Spectralis (Heidelberg Engineering), RTVue (Visionix) and Maestro2 (Topcon Medical Systems). Each OCT curates a ring scan involving the optic nerve: the Maestro2 (3.4mm), RTVue (3.45mm) and Cirrus (3.46mm), while the Spectralis allows the user to choose their preferred diameter (3.46mm, 4.1mm or 4.7mm).
Color mapping helps the user visualize areas of thinning, denoted as cooler colors.2 Many OCTs will section the RNFL into “sectors” and further color-match RNFL thickness to that of their respective database. It is important to ensure the scan data is complete and high quality and the sectors agree with the anatomy of the ONH and its emerging vasculature.
Two clinically relevant RNFL parameters captured in these scans are the superotemporal and inferotemporal quadrant RNFL thicknesses and the average/global RNFL thickness. The inferior RNFL is especially susceptible to glaucomatous damage and consequential focal visual field defects as there are fewer RNFL bundles derived from the inferior portion of the macula compared with the superior macula.3 However, superotemporal RNFL bundles may be more often overlooked due to the larger density of the bundles that reside there, and RNFL loss can result in more shallow, widespread visual field depression; therefore, special attention should be given to both quadrants. Average RNFL thickness, when obtained reliably, can be a useful metric to use in assessing progression. A difference in 9µm between the average RNFL thickness of intra-eye measurements should be closely evaluated. Also, each OCT has its own criteria for “normal” RNFL thickness and should be considered when interpreting this data (Table 1).
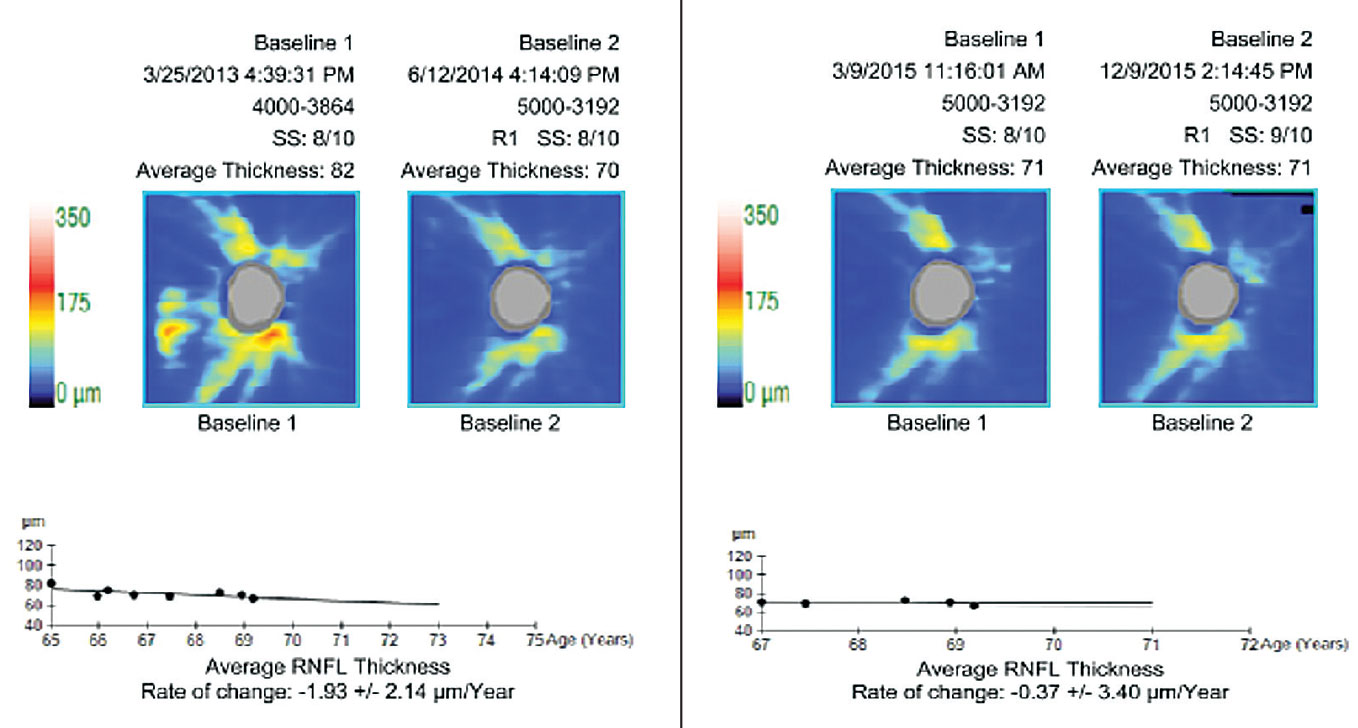 |
| The pre-treatment rate of change (at left) is borderline fast. The re-baselined rate of change (at right) is less than age-related attrition. Re-baselining post-modification of treatment maintains an appropriate perspective and prevents over-management. Click image to enlarge. |
GC-IPL. Scanning the macula is known to be very useful in glaucoma management. Various scan protocols across multiple instruments will capture tissue differently, but their universal goal is to assess retinal ganglion cell (RGC) thickness directly or indirectly. These cells are found most densely concentrated in the macula.4 RGCs span the GC-IPL (bodies and dendrites, respectively). RGCs are thought to be affected by glaucoma early in the disease process, thus evaluating this crucial area is considered to be the new standard of care.5
This genre of scan analysis employs color overlays (similar to that of RNFL maps) of a macular image, allowing the physician to use tissue thickness as a surrogate for RGC health. These scans can provide early insight into glaucomatous changes that may precede functional loss shown on visual fields.6 The Ganglion Cell Analysis (Cirrus) uses the outer boundary of the RNFL, while the Ganglion Cell Complex (RTVue) report comprises the entire RNFL and the GC-IPL. In comparison, the Posterior Pole Asymmetry Analysis (Spectralis) spans Bruch’s membrane to the internal limiting membrane (ILM), with a separate ganglion cell analysis also available. The Maestro2 spans the ILM to the inner plexiform/inner nuclear layers (IPL/INL) in its Ganglion Cell Complex report.5,7
Interpreting a macular scan can be uncomplicated. A loss in warmer colors in a typical arcuate glaucomatous pattern (often referred to as the nautilus or temporal raphe sign) quickly indicates a discrepancy in the anatomy of the RGCs. Macular scans also provide further complex parameters to detect early glaucomatous changes such as the focal loss volume and global loss volume available on the RTVue. The former measures the percentage of average focal loss over the entire map scan, while the latter measures the average ganglion cell complex loss over the entire map.5,8 One study suggested that the focal loss volume is the most reliable single predictor in the conversion of functional loss.9 These indices take less time to acquire, require less data processing and have a high correlation with the total RGC count.
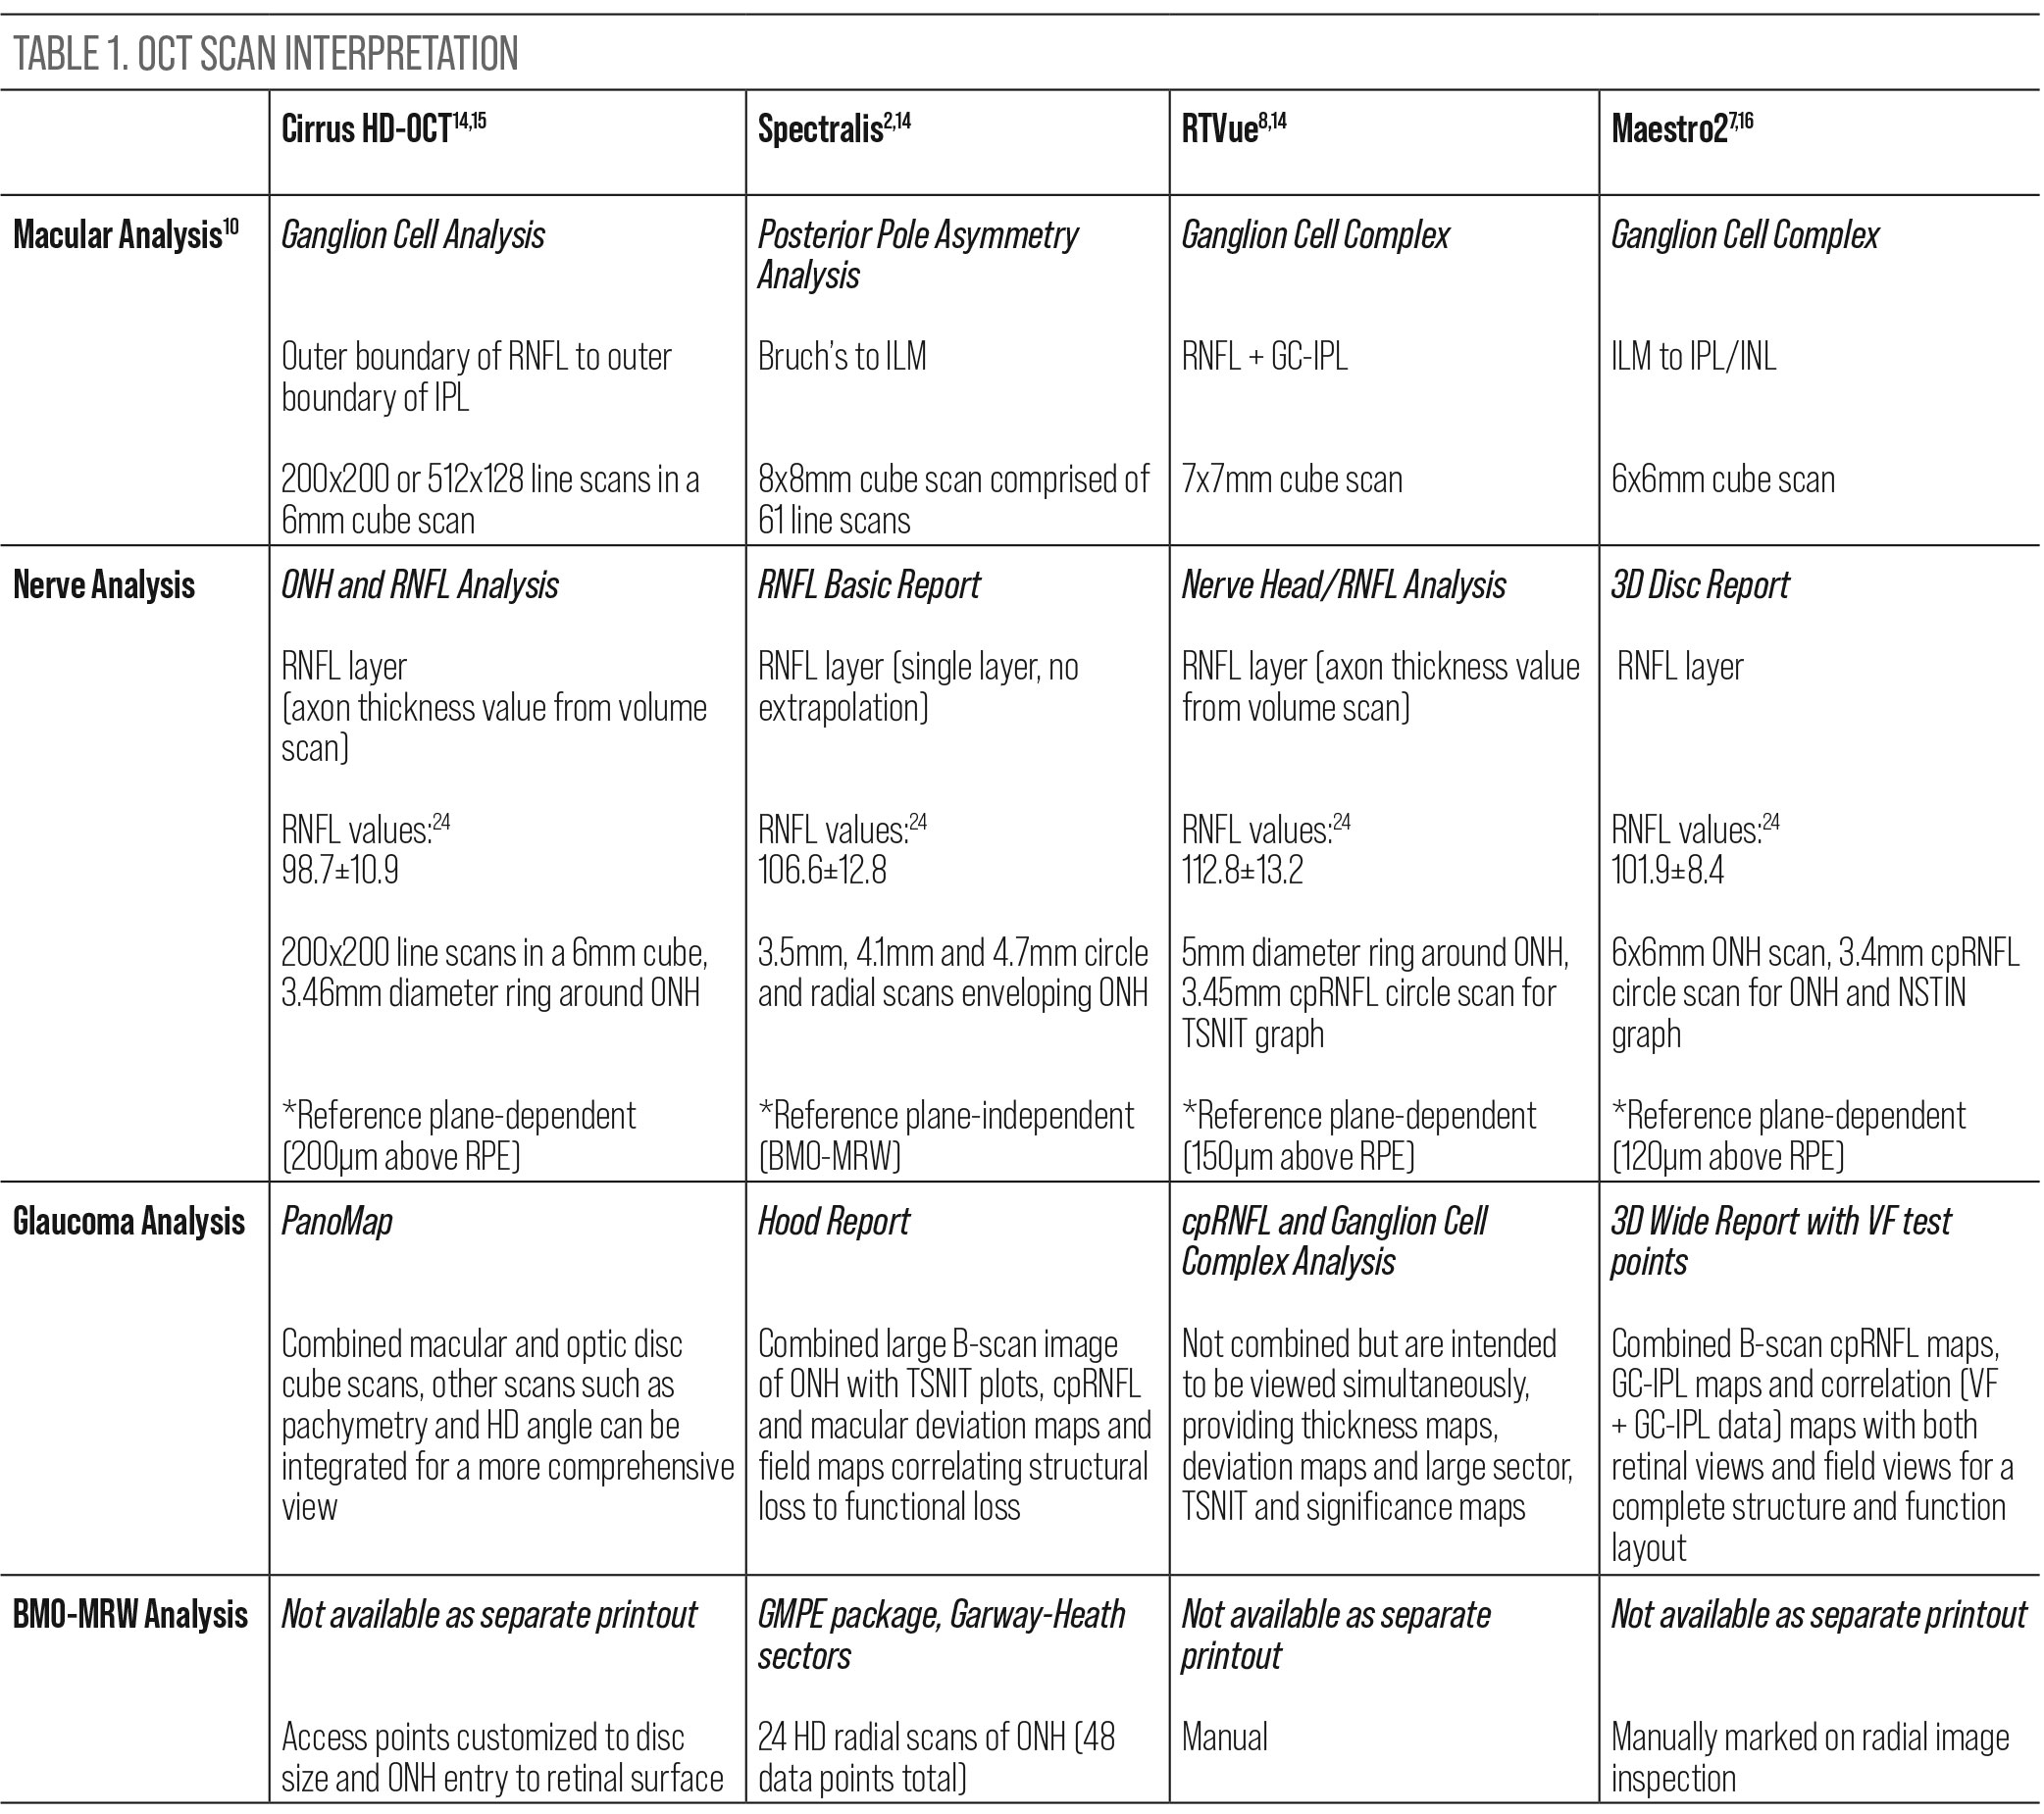 |
| Click table to enlarge. |
BMO-MRW. Bruch’s membrane is the innermost layer of the choroid and is a stable anatomical landmark of the optic nerve. The MRW marks the true anatomic disc margin denoted by the end of Bruch’s membrane and provides a highly accurate measure of the neuroretinal rim. It measures the minimum distance between the termination of Bruch’s and the nearest point of the ILM. This structure is reproducible throughout most of the disease spectrum and can be a stable reference point.10 Additionally, it can provide an accurate correlation between structural and functional loss, especially in normal-tension glaucoma and patients with disc hemorrhages.11,12 It is obtained via Spectralis 24 high-resolution ONH radial scans.13
The Process
In the past, studies on how to screen for and confirm glaucoma with OCT looked at the diagnostic sensitivities of the macula, RNFL and optic disc parameters in isolation, as well as global summary parameters, i.e., whether the overall scan was normal, abnormal or borderline. It is now understood and accepted that combined analysis of at least both the GC-IPL and cpRNFL performs better than using each individual parameter on its own in cases of early glaucoma.17
To maximize outcomes in the initial screening process, it is recommended that all the tissues affected by glaucoma should be evaluated on OCT in combination.18 Specifically, given that glaucomatous loss primarily behaves in an arcuate pattern, a topographical approach to assessing loss demonstrated on OCT is recommended.19 This is the approach taken with many of the widefield glaucoma analysis reports, including the RNFL deviation map. As glaucoma-like artifacts can exist on healthy RNFL deviation maps, it is suggested to employ the vertical midline rule, wherein true glaucomatous arcuate damage will cross a vertical line through the fovea outside the macular-papillary bundle, while an artifact resembling glaucoma will not.20 Although there is a push toward using OCT as a stand-alone, it should be used in concert with a combination of other diagnostic tools—such as funduscopy—to evaluate the presence of glaucomatous optic nerve abnormalities and confirm the diagnosis of glaucoma.
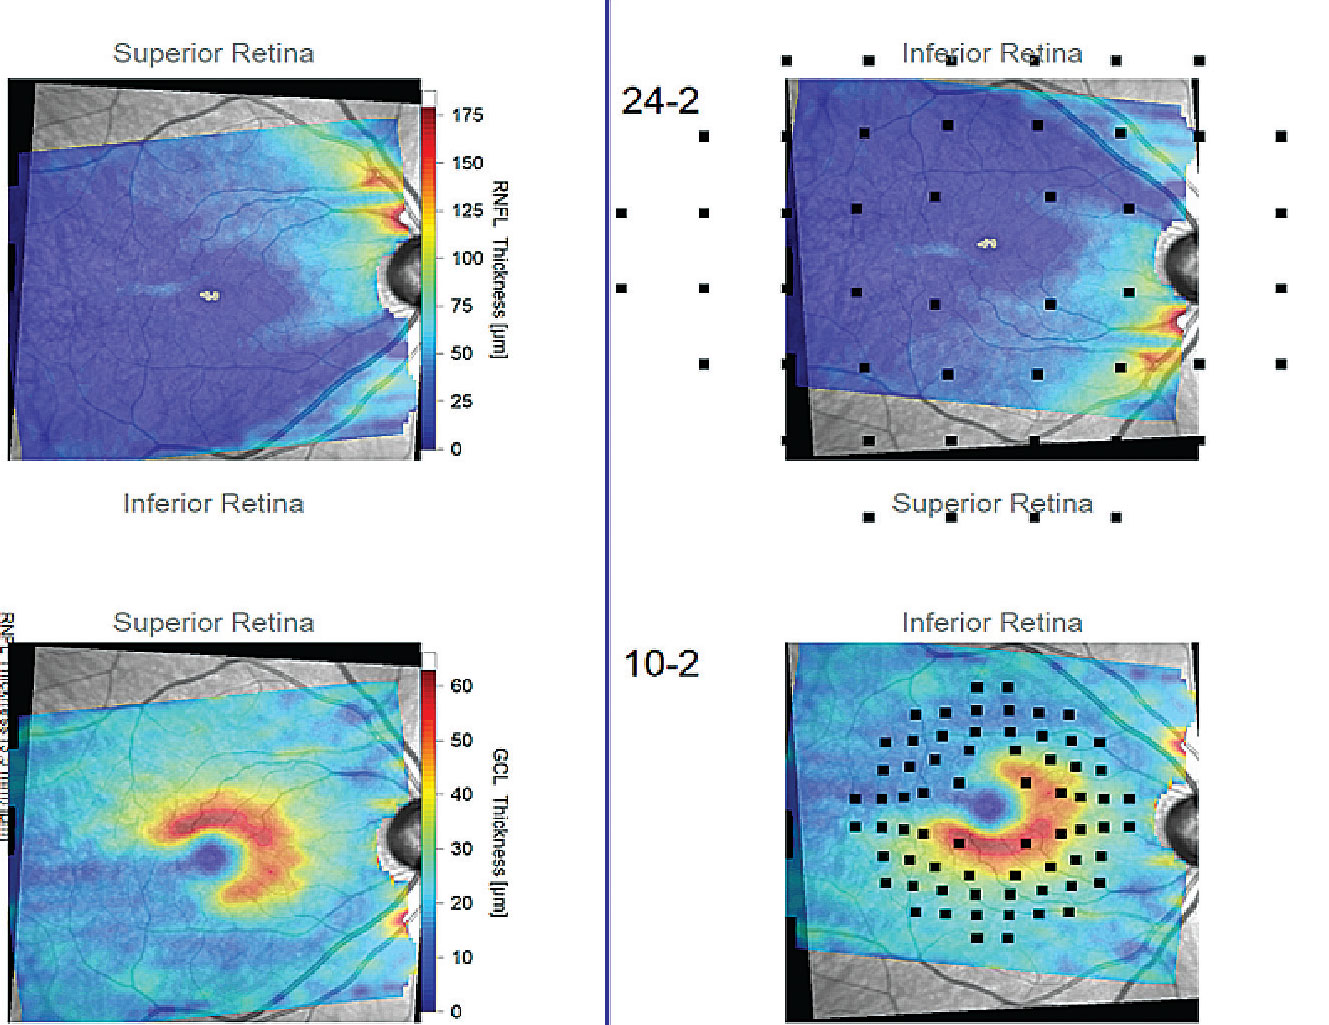 |
| The Hood report of a patient with a wide-angle glaucomatous wedge that extends temporal past the vertical midline (black lines). These reports enhance the practitioner’s ability to topographically analyze patterns of neural tissue loss that may or may not be consistent with glaucoma. Click image to enlarge. |
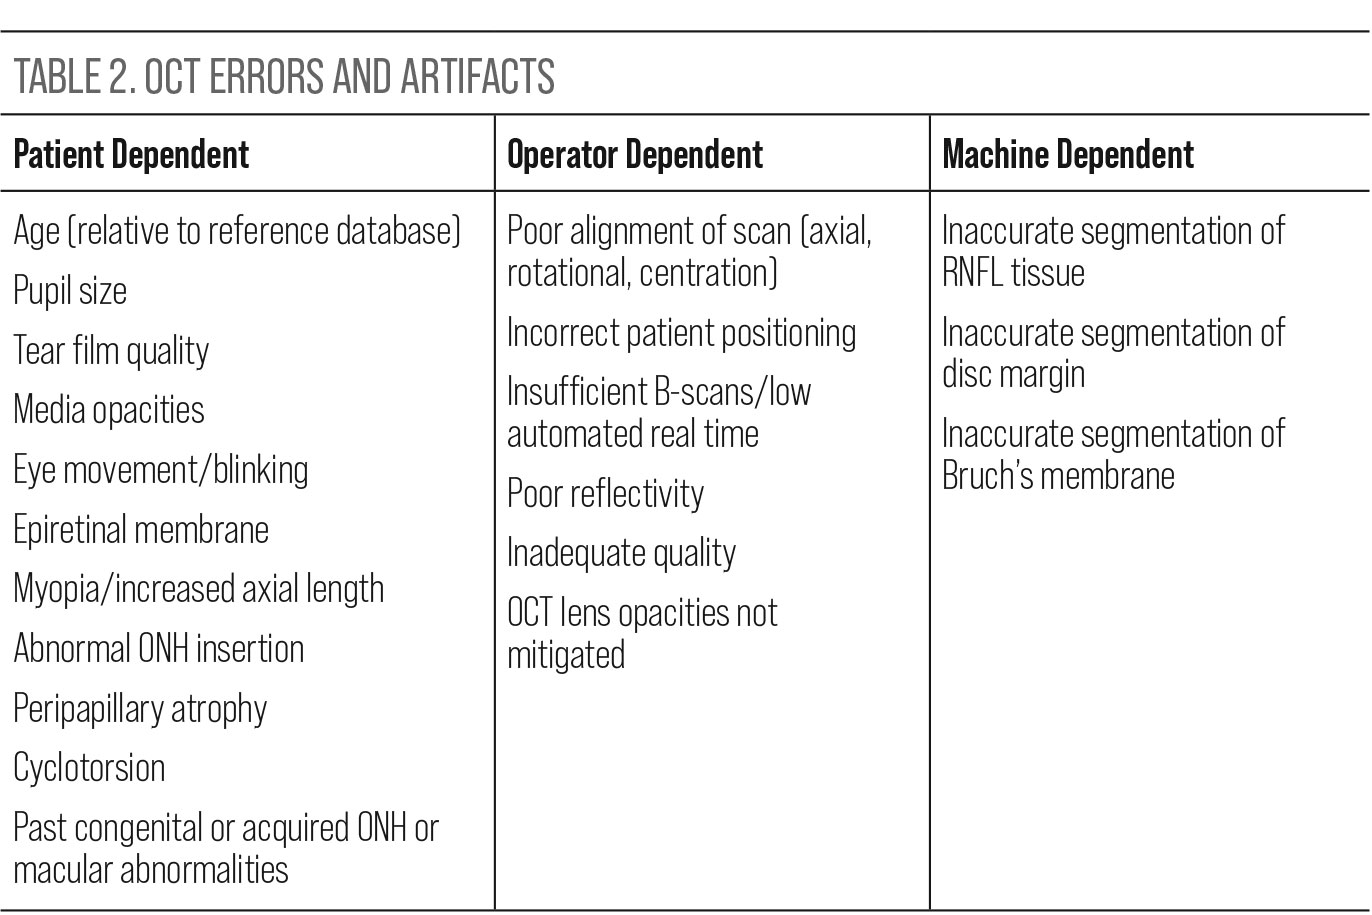
Misinterpretation. When reviewing the ONH and macular data provided by the various OCT instruments, it is important to trust but verify that the information is usable. Proactively looking for sources of misinterpretation is a more realistic approach than being surprised by avoidable errors upon review. Research supports this approach, confirming that artifacts affecting the quality and therefore utility of images are common in clinical practice. A recent review of this issue noted that over 25% of patients are expected to have artifacts in their SD-OCT glaucoma imaging that could introduce either false positive or false negative interpretation.21 Awareness of potential artifacts and errors is pertinent to maximize the quality and interpretability of the scans. Potential error generating factors can be broken down into three categories: patient dependent, operator dependent and machine dependent (Table 2).21,22
After accounting for artifacts that affect the utility of the data, it is necessary to be aware of how the various machines present normally and what deviation from that normal may look like, recognizing that green isn’t always clean. Each instrument has its own normative database comprised of multiple individuals of various ages, races and genders unique to those platforms. Remarkably, the FDA has no standards or guidelines for the types or numbers of subjects who should be included in these databases or how that data should be presented or analyzed.23 A more realistic way to classify these databases is to use the term “reference database,” as they do not represent population norms but are comprised of averages of included patients. Those averages are based on proprietary segmentation, scanning protocols and thickness algorithms.24
Regardless of how the individual databases were compiled, tissue thicknesses are presented by all platforms as normal, borderline or outside normal limits/abnormal. These thicknesses are based on the percentile distribution of database thicknesses and employ color schemes to aid analysis. These color schemes use white and typical traffic light colors green, yellow and red. White includes the 95th to the 99th percentile (above normal), green includes the 5th to the 95th percentile (normal), yellow the 1st to the 5th (borderline) and red the 1st percentile (below normal).24 Therein lies the trap: green accounts for 90% of the tissue thickness on these machines. A normal finding does not signify the patient is free of disease and/or from progression over time; conversely, an abnormal finding does not mean the patient has disease, and misinterpretation of results could lead to misdiagnosis and mistreatment.
So, what is the relevance of this broad range of tissue for clinical practice? Let’s step back for a second and quickly review dynamic ranges, measurement floor and steps. For OCT, the dynamic range is the usable range between the highest and lowest capturable values of tissue, based on healthy eyes. The measurement floor is the lowest detectable value beyond which measurement has no clinical value. In any test run multiple times, there will be test-retest variability, or a measurement step. The test-retest variability for average RNFL thickness on most platforms is 4µm to 5µm and 2µm to 3µm for average GC-IPL thickness. The number of steps in the overall range determines how much significant change can be detected over time; the greater the number of measurement steps in a given range, the greater the ability to capture glaucomatous change over time.25
The relevance of this information is that within the green category there can be a considerable number of steps of RNFL progression, meaning there can be substantial, clinically meaningful glaucomatous loss even though the machine will categorize these changes as normal. As a point of reference, one study employing estimated RGC count at various stages of glaucoma found that a loss of 5µm was equivalent to a loss of 100,000 RGCs. There were six 5µm steps between 75µm and 105µm.26 The take-home was that reliance on colors for affirmation of normalcy is a mistake.
 |
| Click table to enlarge. |
Monitoring. OCT can be used to monitor progression and in doing so can confirm the success or failure of treatment. The only repeatable way to objectively confirm the success or failure of a glaucoma treatment is through tracking the progression of structure and function. As a result, there has been a recent effort to implement the use of target rate of progression as a more impactful, quantitative concept than attempting to use target intraocular pressure (IOP) as a monitor for success, given how the dynamics of IOP, among other factors, make this difficult to confirm.27 The most repeatable, researched and therefore usable metric for tracking progression is the average/global RNFL, and the least repeatable is clock hours.28,29
The value of the BMO-MRW and GC-IPL when tracking progression has also been studied but not as extensively as the global RNFL. However, it has been suggested that, although the BMO-MRW has good intra-visit repeatability in mild and moderate disease, it may be less useful in advanced disease where the location of the BMO may change over time and be less consistently trackable.30,31
In general, GC-IPL and RNFL rates of thinning in early glaucoma have been shown to be comparable, but not interchangeable.32 Although not commercially available, combining the RNFL and GC-IPL has been shown to reveal eyes that are progressing prior to detection by the RNFL or GC-IPL alone and might be a useful integrated parameter in the future.33 The GC-IPL may be most useful in advanced-stage disease when the RNFL has reached the floor effect.6
Prior to delving into what are considered slow or fast rates of RNFL progression it is critical to perform baselining/re-baselining. As discussed previously, it is an absolute necessity to have high-quality baseline scans from which to compare. Once the practitioner initiates or escalates treatment with the intent to modify the disease, re-baseline. Comparing a pre-treatment tissue thickness to a post-treatment tissue thickness may give the impression that treatment has been unsuccessful and result in additional treatments that may be unnecessary. Realistically, the goal of treatment is to blunt the disease, not halt it entirely. Fortunately, an unrealistic number of scans per year is not necessary to confirm success or failure by determining the rate of progression. A 2022 study discovered that performing two quality OCT scans per year is reasonable and sufficient to determine those patients who are fast progressors.34
For reference, normal age-related attrition of the RNFL is less than -1µm/year (an average of -0.54µm/year), normal age-related attrition of the BMO-MRW is -1.92µm/year and the GC-IPL is -0.31µm/year.35,36 A faster rate of change in any of these parameters might be indicative of true pathological tissue loss.12 In fact, average RNFL progression rates from the Duke Glaucoma Registry are delineated into 1µm/year as slow, between 1µm to 2µm/year as moderate, 2µm to 4µm/year as fast and >4µm/year as a catastrophic rate of progression.37 It is particularly important to capture these rates, as research recently found that rapid initial RNFL deterioration is a good predictor of a faster disease course and rate of visual decline.38
In progression analysis, OCT software will supply event and trend analysis. These may be labeled differently by the various platforms, but the concept is the same. Event analysis compares each OCT taken to a minimum of two baseline OCTs. The various platforms will then present probabilities of whether the patient has progressed. Conversely, trend analysis takes an average of the tissue thickness over time and provides the rate at which the disease is progressing.
Specifically in regard to event analysis, the test-retest variability of OCT has led to the informal “Rule of Five,” which states that if a glaucoma patient undergoes a repeatable 5µm or greater loss of average RNFL on consecutive scans/events, then that loss is considered quantitative evidence of progression and might justify escalating treatment.15 Although this concept is simple and easy to implement, recent research recommends exercising caution with its application, noting that this rule is not specific for glaucoma progression between tests and actually performs worse than OCT trend analysis when compared longitudinally.39,40 For example, after five years of semiannual testing, use of the rule resulted in a false positive rate of 24.8%, signifying that it might result in unnecessary treatment in patients with stable disease, causing unnecessary burden.
Regardless of whether an informal rule or a more structured machine-based trend analysis is used, practitioners cannot over-rely on average RNFL trend or event analysis as a stand-alone; they need to be used in tandem to capture both local and global loss. Even then local defects may be missed, so grossly looking at how the tissue is captured and how it changes over time in deviation maps has value. Ultimately, don’t get caught up in the minutiae of the data and make it impossible to comprehensively analyze all clinical information before deciding whether to intensify management.41,42
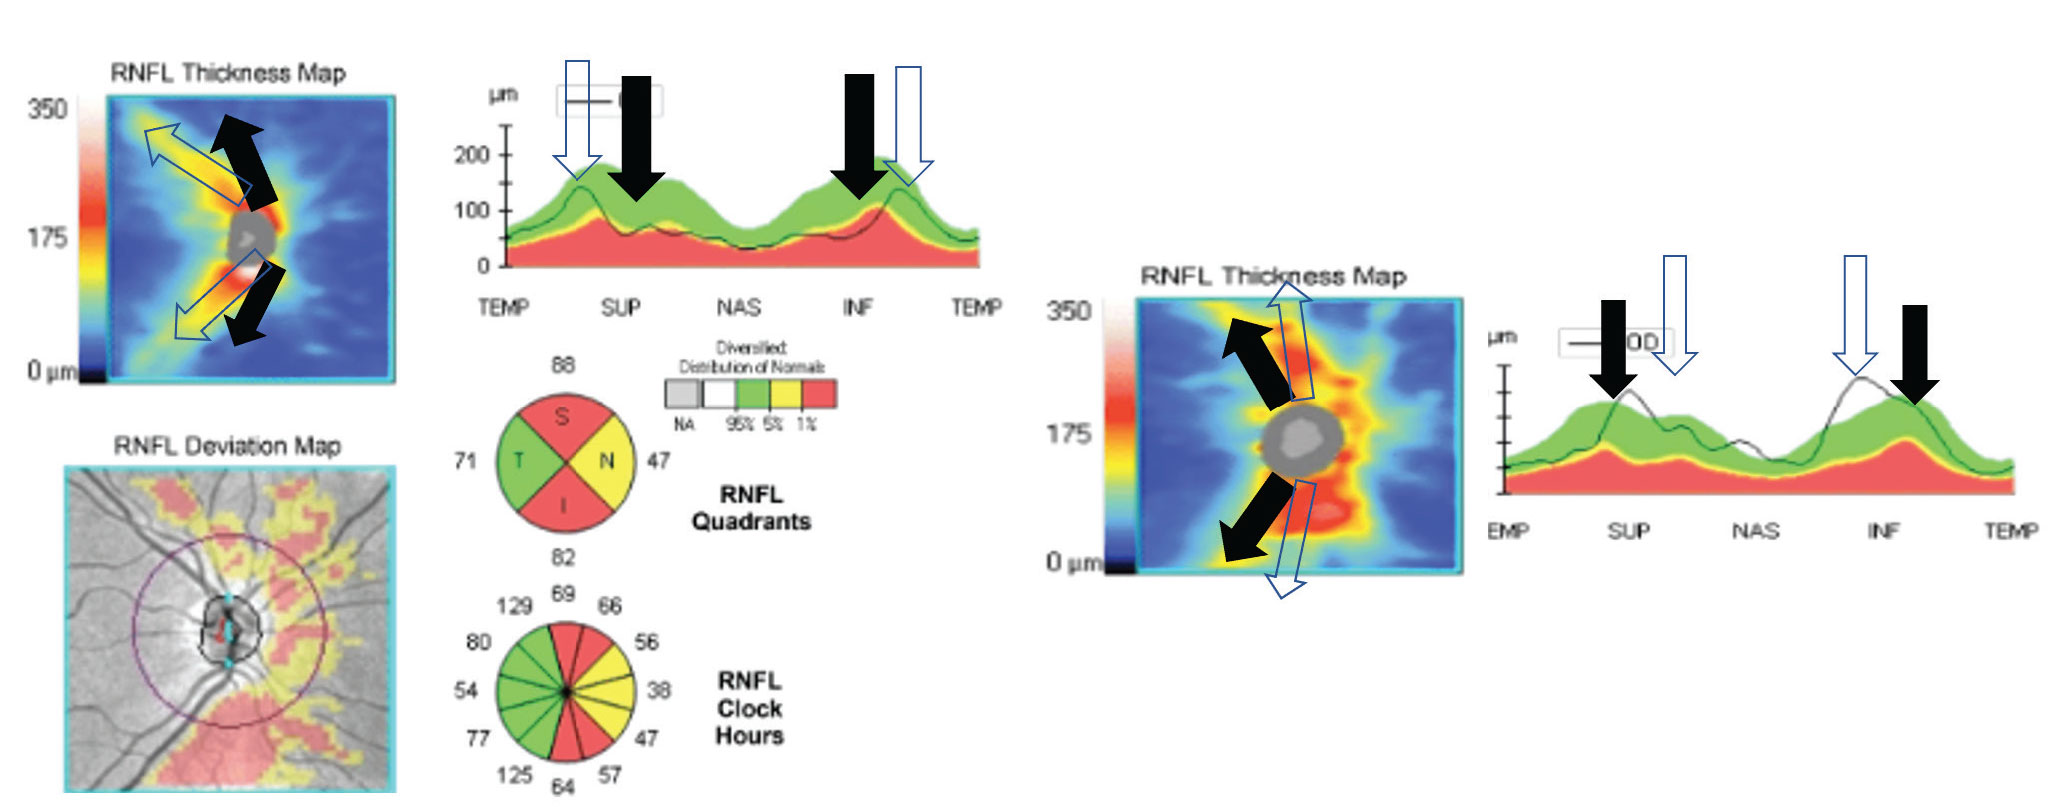 |
| The left image shows congenitally temporalized vasculature. The machine expects the vessels to be where the black arrows are. The clear arrows show the actual distribution of the vessels. This results in false positive thinning in the superior and inferior quadrants in an actually healthy patient. On the right is a congenitally nasalized vasculature, which could create a false positive. Click image to enlarge. |
The Differentials
Glaucoma is a diagnosis of exclusion, albeit in most cases not an extremely difficult one. Among optic neuropathies, glaucoma is unique because it undergoes damage to both connective tissue and neural tissue, whereas other neuropathies result in only neural tissue damage. Glaucoma is a laminopathy.43,44
Accordingly, it is important to recognize typical patterns of tissue loss that might mimic glaucoma but are more consistent with non-glaucomatous neuropathies or retinopathies. The caveat is that there are confounding situations where discernment between glaucoma and non-glaucoma can be difficult. The list of potential differential diagnoses is substantial, so we will concentrate on a few major examples.
Non-arteritic anterior ischemic optic neuropathy (NAION). This is the most common cause of optic disc edema between the ages of 45 and 70 and may appear on the surface to share some features with glaucoma. Once ONH edema resolves, there are many potential presentations of neural tissue damage, most frequently pallor of the neuroretinal rim and axonal loss. NAION patients will have RNFL thinning as glaucoma patients do; however, the majority of RNFL thinning occurs in the superior and temporal quadrants in NAION and typically stabilizes six months post-inception on average.45,46 To differentiate from OCT, patients with NAION will not have BMO-MRW thinning or lamina cribrosa thinning as they do in glaucoma.47,48
Diabetic retinopathy. The population-based Beijing Eye Study showed that localized RNFL defects occurred in 15% of screened patients on OCT, they are not uncommon and it is important to recognize that they are not always indicative of glaucoma. Non-glaucomatous causes of wedges were myopia/higher axial length, diabetes and other vascular conditions resulting in RNFL infarct and age.49 Concentrating on diabetic retinopathy, specifically pre-capillary focal arterial occlusions within the RNFL, the angular width of the RNFL defect and its behavior over time can help differentiate from glaucoma. One study showed that the angular width of localized RNFL defects was substantially smaller in patients with diabetes when compared with their normal-tension glaucoma counterparts (7.7±6.5° vs. 43.5±19.2°). Furthermore, the defect enlarged over time in the glaucoma group.50 So, initial assessment of the defect width—the wider it is, the more likely glaucoma is present—and longitudinal OCT analysis can help discern glaucomatous damage from diabetic damage if a localized infarct has not been witnessed or documented.
When distinguishing between larger caliber vessel occlusions and glaucoma, a study showed that comparing the superior and inferior hemispheres of the macula can be helpful. The authors found that greater global intra-eye asymmetry and tissue thickness, as well as total retinal thickness below 200µm in individual 3°x3° cubes, were diagnostic of previous artery occlusion and not glaucoma.51
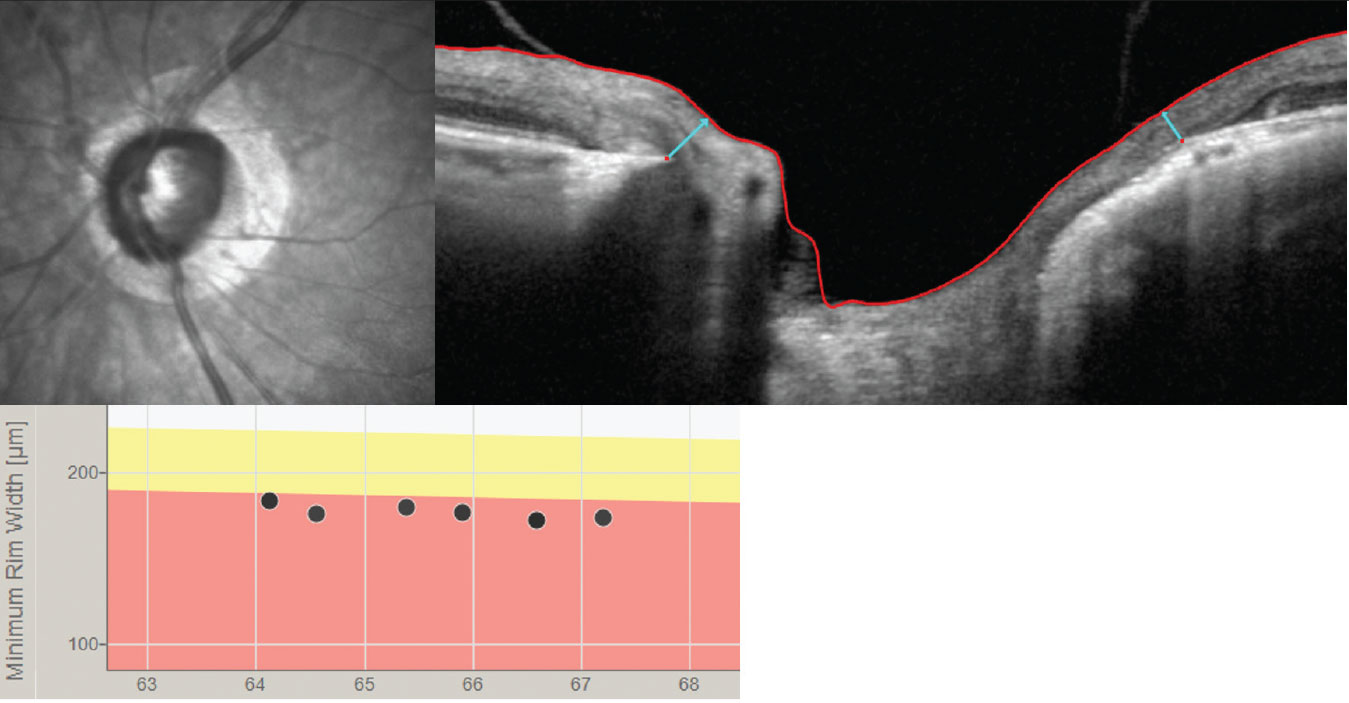 |
| The BMO-MRW (light blue arrows) may be a better way to track progression than the RNFL in high myopes who are suspected of having glaucoma or in those with confirmed myopic glaucoma. Click image to enlarge. |
Myopia. Patients with high myopia are at a two- to threefold increased risk of open-angle glaucoma, and myopic nerves should thus be assessed cautiously.52 To complicate matters, commercially available SD-OCT reference databases do not incorporate axial length-related ocular magnification, meaning that the longer the axial length, the thinner the RNFL and the smaller the ONH.53 Accordingly, many eyes will fall into a statistically abnormal range per the machine, resulting in a false diagnosis of glaucoma when they in fact have healthy nerves.54 To avoid false positives, specifically in myopes between the range of -2.00D to -5.00D, consider the temporal raphe sign in the GC-IPL or MRW scan, which has been shown to have much greater specificity (95% vs. 33%) when compared with the RNFL or GC-IPL. This is due to an improved anatomical and geometrical accuracy in these patients.55-57 Although the aforementioned are better options than the RNFL in moderate and high myopia, it should be noted that there are some cases where none of these parameters can be meaningfully used as some eyes are just too atypical to allow consistent OCT structural capture.
Closing Thoughts
Remaining objective is a difficult skill when considering inter- and intrapersonal assessments of structural changes in the RNFL and ONH. OCT can maintain a level of reproducible objectivity that otherwise plagues even the most sagacious of clinicians. This consideration is important especially when data may not fit perfectly together. Remain objective, consider potential artifacts and differentials and remember that OCTs are devices that require good data acquisition to produce insightful information for the best outcomes.
Dr. Rixon is an attending optometrist at the Memphis VA Medical Center, a member of the Optometric Glaucoma Society and a glaucoma diplomate of the American Academy of Optometry. Dr. Kirk graduated from the Southern College of Optometry, completed her ocular disease residency at the Memphis VA Medical Center and currently practices at Eye Specialty Group in Memphis. They have no financial interests to disclose.
1. Liebmann JM, Hood DC, de Moraes CG, et al. Rationale and development of an OCT-based method for detection of glaucomatous optic neuropathy. J Glaucoma. 2022;31(6):375-381. 2. Heidelberg Engineering. Glaucoma imaging atlas preview. https://media.heidelbergengineering.com/downloads/ebooks/200454-001_Academy_Promotional_Glaucoma_Imaging_Atlas_Preview_web.pdf Accessed November 27, 2022 3. Saini C SL. Monitoring glaucoma progression with OCT. Review of Ophthalmology. May 2020;48-55. https://www.reviewofophthalmology.com/article/monitoring-glaucoma-progression-with-oct Accessed November 28, 2022. 4. Hood DC et al. Glaucomatous damage of the macula. Prog Retin Eye Res. 2013;32C:1-21. 5. Optovue. Direct ganglion cell assessment with the RTVue: The ganglion cell complex analysis https://www.oct-optovue.com/GCC-RTVue-version4.pdf. Accessed November 27, 2022. 6. Shin JW et al. Ganglion cell-inner plexiform layer change detected by optical coherence tomography indicates progression in advanced glaucoma. Ophthalmol. 2017;124(10):1466-1474. 7. Topcon Healthcare. Maestro 2 robotic OCT. https://topconhealthcare.com/products/maestro2/. Accessed November 27, 2022. 8. Sinai, M. The normative database for RTVue, software version 4.0. https://www.oct-optovue.com/Database-RTVue-version4.pdf. Accessed November 27, 2022. 9. Zhang X et al. Comparison of glaucoma progression detection by optical coherence tomography and visual field. Am J Ophthalmol. 2017;184:63-74. 10. Fingeret M. Evaluating the optic nerve for glaucomatous damage with OCT. Glaucoma Today. April/May 2015. https://glaucomatoday.com/articles/2015-mar-apr/evaluating-the-optic-nerve-for-glaucomatous-damage-with-oct Accessed November 28, 2022. 11. Seibold LK, Mandava N, Kahook MY. Comparison of retinal nerve fiber layer thickness in normal eyes using time-domain and spectral-domain optical coherence tomography. Am J Ophthalmol. 2010;150(6):807-814. 12. Cho H kyung, Kee C. Rate of change in Bruch’s membrane opening-minimum rim width and peripapillary RNFL in early normal tension glaucoma. J Clin Med. 2020;9(8):2321. 13. Mwanza JC et al. Macular ganglion cell–inner plexiform layer: Automated detection and thickness reproducibility with spectral domain–optical coherence tomography in glaucoma. Invest Ophthalmol Vis Sci. 2011;52(11):8323-8329. 14. Reimold J, Wroten, C. OCT interpretation for glaucoma: Don’t get fooled. Review of Optometry. 2021;(July):56-61.https://www.reviewofoptometry.com/article/oct-interpretation-for-glaucoma-dont-get-fooled Accessed November 28, 2022. 15. Carl Zeiss Meditec. Cirrus HD-OCT user manual: Models 500, 5000. https://www.zeiss.co.uk/content/dam/Meditec/gb/Chris/Refractive-Business-Builder/2018Updates/UserGuides/oct_usermanual.pdf Accessed November 27, 2022 16. Pennington M, Smith B. OCT: What’s under the hood? Review of Optometry. Sept 15, 2022;44-52. https://www.reviewofoptometry.com/article/oct-whats-under-the-hood Accessed November 28, 2022. 17. Mwanza JC, Lee G, Budenz DL, et al. Validation of the UNC OCT Index for the diagnosis of early glaucoma. Transl Vis Sci Technol. 2018;7(2):16. 18. Chen TC, Hoguet A, Junk AK, et al. Spectral-domain OCT: helping the clinician diagnose glaucoma: a report by the American Academy of Ophthalmology. Ophthalmol. 2018;125(11):1817-27. 19. Hood DC et al. Improving the detection of glaucoma and its progression: a topographical approach. J Glaucoma. 2020;29(8):613-621. 20. La Bruna S, Rai A, Mao G, et al. The OCT RNFL probability map and artifacts resembling glaucomatous damage. Transl Vis Sci Technol. 2022;11(3):18. 21. Chen JJ, Kardon RH. Avoiding clinical misinterpretation and artifacts of optical coherence tomography analysis of the optic nerve, retinal nerve fiber layer, and ganglion cell layer. J Neuroophthalmol. 2016;36(4):417-438. 22. Hardin JS et al. Factors affecting cirrus-HD OCT optic disc scan quality: A review with case examples. J Ophthalmol. 2015;2015:746150. 23. Silverman AL, Hammel N, Khachatryan N, et al. Diagnostic accuracy of the spectralis and cirrus reference databases in differentiating between healthy and early glaucoma eyes. Ophthalmol. 2016;123(2):408-414. 24. Sayed MS, Margolis M, Lee RK. Green disease in optical coherence tomography diagnosis of glaucoma. Curr Opin Ophthalmol. 2017;28(2):139-153. 25. Moghimi S, Bowd C, Zangwill LM, et al. Measurement floors and dynamic ranges of OCT and OCT angiography in glaucoma. Ophthalmol. 2019;126(7):980-988. 26. Medeiros FA et al. The structure and function relationship in glaucoma: implications for detection of progression and measurement of rates of change. Invest Ophthalmol Vis Sci. 2012;53(11):6939-6946. 27. Moraes CG, Paula JS, et al. Relationship between mean follow-up intraocular pressure, rates of visual field progression and current target intraocular pressure guidelines. Br J Ophthalmol. 2022;106(2):229-233. 28. Ghasia FF et al. Reproducibility of spectral-domain optical coherence tomography measurements in adult and pediatric glaucoma. J Glaucoma. 2015;24(1):55-63. 29. Mwanza J-C, Chang RT, Budenz DL, et al. Reproducibility of peripapillary retinal nerve fiber layer thickness and optic nerve head parameters measured with cirrus HD-OCT in glaucomatous eyes. Invest Ophthalmol Vis Sci. 2010;51(11):5724-5730. 30. Tatham AJ, Medeiros FA. Detecting structural progression in glaucoma with optical coherence tomography. Ophthalmol. 2017;124(12S):S57-S65. 31. Park K, Kim J, Lee J. Reproducibility of Bruch membrane opening-minimum rim width measurements with spectral domain optical coherence tomography. J Glaucoma. 2017;26(11):1041-1050. 32. Saks D, Schulz A, Craig J, Graham S, PROGRESSA Study Group. Determination of retinal nerve fibre layer and ganglion cell/inner plexiform layers progression rates using two optical coherence tomography systems: The PROGRESSA study. Clin Exp Ophthalmol. 2020;48(7):915-926. 33. Wu K et al. Wide-field trend-based progression analysis of combined retinal nerve fiber layer and ganglion cell inner plexiform layer thickness: A new paradigm to improve glaucoma progression detection. Ophthalmol.2020;127(10):1322-1330. 34. Melchior B, De Moraes CG, Paula JS, et al. Frequency of optical coherence tomography testing to detect progression in glaucoma. J Glaucoma. 2022;31(11):854-859. 35. Vianna JR, Danthurebandara VM, Sharpe GP, et al. Importance of normal aging in estimating the rate of glaucomatous neuroretinal rim and retinal nerve fiber layer loss. Ophthalmol. 2015;122(12):2392-2398. 36. Lee WJ, Baek SU, Kim YK, et a. Rates of ganglion cell-inner plexiform layer thinning in normal, open-angle glaucoma and pseudoexfoliation glaucoma eyes: A trend-based analysis. Invest Ophthalmol Vis Sci. 2019;60(2):599-604. 37. Jammal AA, Thompson AC, Mariottoni EB, et al. Rates of glaucomatous Structural and functional change from a large clinical population: The Duke Glaucoma Registry Study. Am J Ophthalmol. 2021;222:238-247. 38. Swaminathan SS, Jammal AA, Berchuck SI, et al. Rapid initial OCT RNFL thinning is predictive of faster visual field loss during extended follow-up in glaucoma. Am J Ophthalmol. 2021;229:100-107. 39. Thompson AC, Jammal AA, Medeiros FA. Performance of the rule of 5 for detecting glaucoma progression between visits with OCT. Ophthalmol Glaucoma. 2019;2(5):319-326. 40. Thompson AC, Jammal AA, Berchuck SI, et al. Comparing the Rule of 5 to trend-based analysis for detecting glaucoma progression on OCT. Ophthalmol Glaucoma. 2020;3(6):414-420. 41. Hood DC, Melchior B, Tsamis E, Liebmann JM, De Moraes CG. Did the OCT show progression since the last visit? J Glaucoma. 2021;30(4):e134-e145. 42. Sun A, Tsamis E, Eguia MD, et al. Global optical coherence tomography measures for detecting the progression of glaucoma have fundamental flaws. Eye (Lond). 2021;35(11):2973-2982. 43. Burgoyne C. The morphological difference between glaucoma and other optic neuropathies. J Neuroophthalmol. 2015;35(0 1):S8-S21. 44. Downs JC, Girkin CA. Lamina cribrosa in glaucoma. Curr Opin Ophthalmol. 2017;28(2):113-119. 45. Danesh-Mayer HV, Boland MV, Savino PJ, et al. Author response: Linear relation between structure and function. Invest Ophthalmol Vis Sci. 2010;51(12):6891-6892. 46. Fard MA, Afzali M, Abdi P et al. Comparison of the pattern of macular ganglion cell-inner plexiform layer defect between ischemic optic neuropathy and open–angle glaucoma. Investigative Ophthalmology & Visual Science. 2016;57(3):1011-1016. 47. Fard MA, Ghahvehchian H, Subramanian PS. Optical coherence tomography in ischemic optic neuropathy. Annals of Eye Science. 2020;5(0):6-6. 48. Braga J, Soares R, Loureiro M, et al. Bruch’s membrane opening minimum rim width in the differential diagnosis of optic neuropathies. Neuroophthalmology. 2019;44(2):76-88. 49. Zhao L, Wang YX, Zhang W, et al. Localized retinal nerve fiber layer defects detected by optical coherence tomography: The Beijing Eye Study. PLOS ONE. 2013;8(7):e68998. 50. Lee J, Kim J, Kee C. Characteristics of patients with a localized retinal nerve fiber layer defect and normal optic disc appearance. Eye (Lond). 2012;26(11):1473-1478. 51. Sullivan-Mee M, Amin P, Pensyl D, et al. Differentiating occult branch retinal artery occlusion from primary open-angle glaucoma. Optom Vis Sci. 2018;95(2):106-112. 52. Baptista PM, Vieira R, Ferreira A, et al. The role of multimodal approach in the assessment of glaucomatous damage in high myopes. Clin Ophthalmol. 2021;15:1061-1071. 53. Savini G, Barboni P, Parisi V, et al. The influence of axial length on retinal nerve fibre layer thickness and optic-disc size measurements by spectral-domain OCT. Br J Ophthalmol. 2012;96(1):57-61. 54. Seol BR, Kim DM, Park KH et al. Assessment of optical coherence tomography color probability codes in myopic glaucoma eyes after applying a myopic normative database. Am J Ophthalmol. 2017;183:147-155. 55. Lee J, Kim YK, Ha A, et al. Temporal raphe sign for discrimination of glaucoma from optic neuropathy in eyes with macular ganglion cell-inner plexiform layer thinning. Ophthalmo. 2019;126(8):1131-1139 56. Kim YK, Yoo BW, Jeoung JW,et al. Glaucoma-diagnostic ability of ganglion cell-inner plexiform layer thickness difference across temporal raphe in highly myopic eyes. Invest Ophthalmol Vis Sci. 2016;57(14):5856-5863. 57. Rebolleda G, Casado A, Oblanca N, et al. The new Bruch’s membrane opening - minimum rim width classification improves optical coherence tomography specificity in tilted discs. Clin Ophthalmol. 2016;10:2417-2425. |
