OCT: Eye Care’s All-Purpose ToolThis versatile device has dozens of functions in eye care today. In the January 2023 issue of Review of Optometry, our experts explore its capabilities in full. Check out the other articles featured in this OCT-themed issue:
|

Approaching neuro-ophthalmic disease may be daunting for many eyecare practitioners, given the wide array of possible differential diagnoses and systemic implications. With the ability to visualize structural changes from the retinal nerve fiber layer (RNFL) to the posterior aspects of the lamina cribrosa, optical coherence tomography (OCT) is an indispensable tool for disease screening, differential diagnosis, prognostication and progression analysis for patients with optic nerve disease. This article will answer six neuro-ophthalmic questions optometrists may face in clinical practice with a focus on the role of OCT in clinical decision-making.
1. Can OCT explain non-pathological field loss?
When a patient presents with bitemporal visual field loss, often the first thing that comes to mind is chiasmal syndrome—but is this always the case? Tilted disc syndrome is a benign physiological anomaly that presents with some characteristic clinical features. These include tilt or oblique insertion of the optic nerve, situs inversus of major blood vessels exiting the disc and posterior bowing of the retina in an area surrounding the optic disc.1
Tilted disc syndrome can also present with refractive visual field loss corresponding to the area of retinal ectasia when defocus between the retinal plane and corrective lens results in a refractive field defect.2 As tilted disc syndrome is hypothesized to arise from a fault in embryonic fissure closure, retinal ectasia typically manifests in the inferotemporal aspect of the retina, and thus superotemporal visual field defects are most commonly observed in tilted disc syndrome.3,4 While less common, other defects, such as altitudinal or hemianopic ones, have also been reported.5 An example of tilted disc syndrome is shown in Figure 1.
 |
|
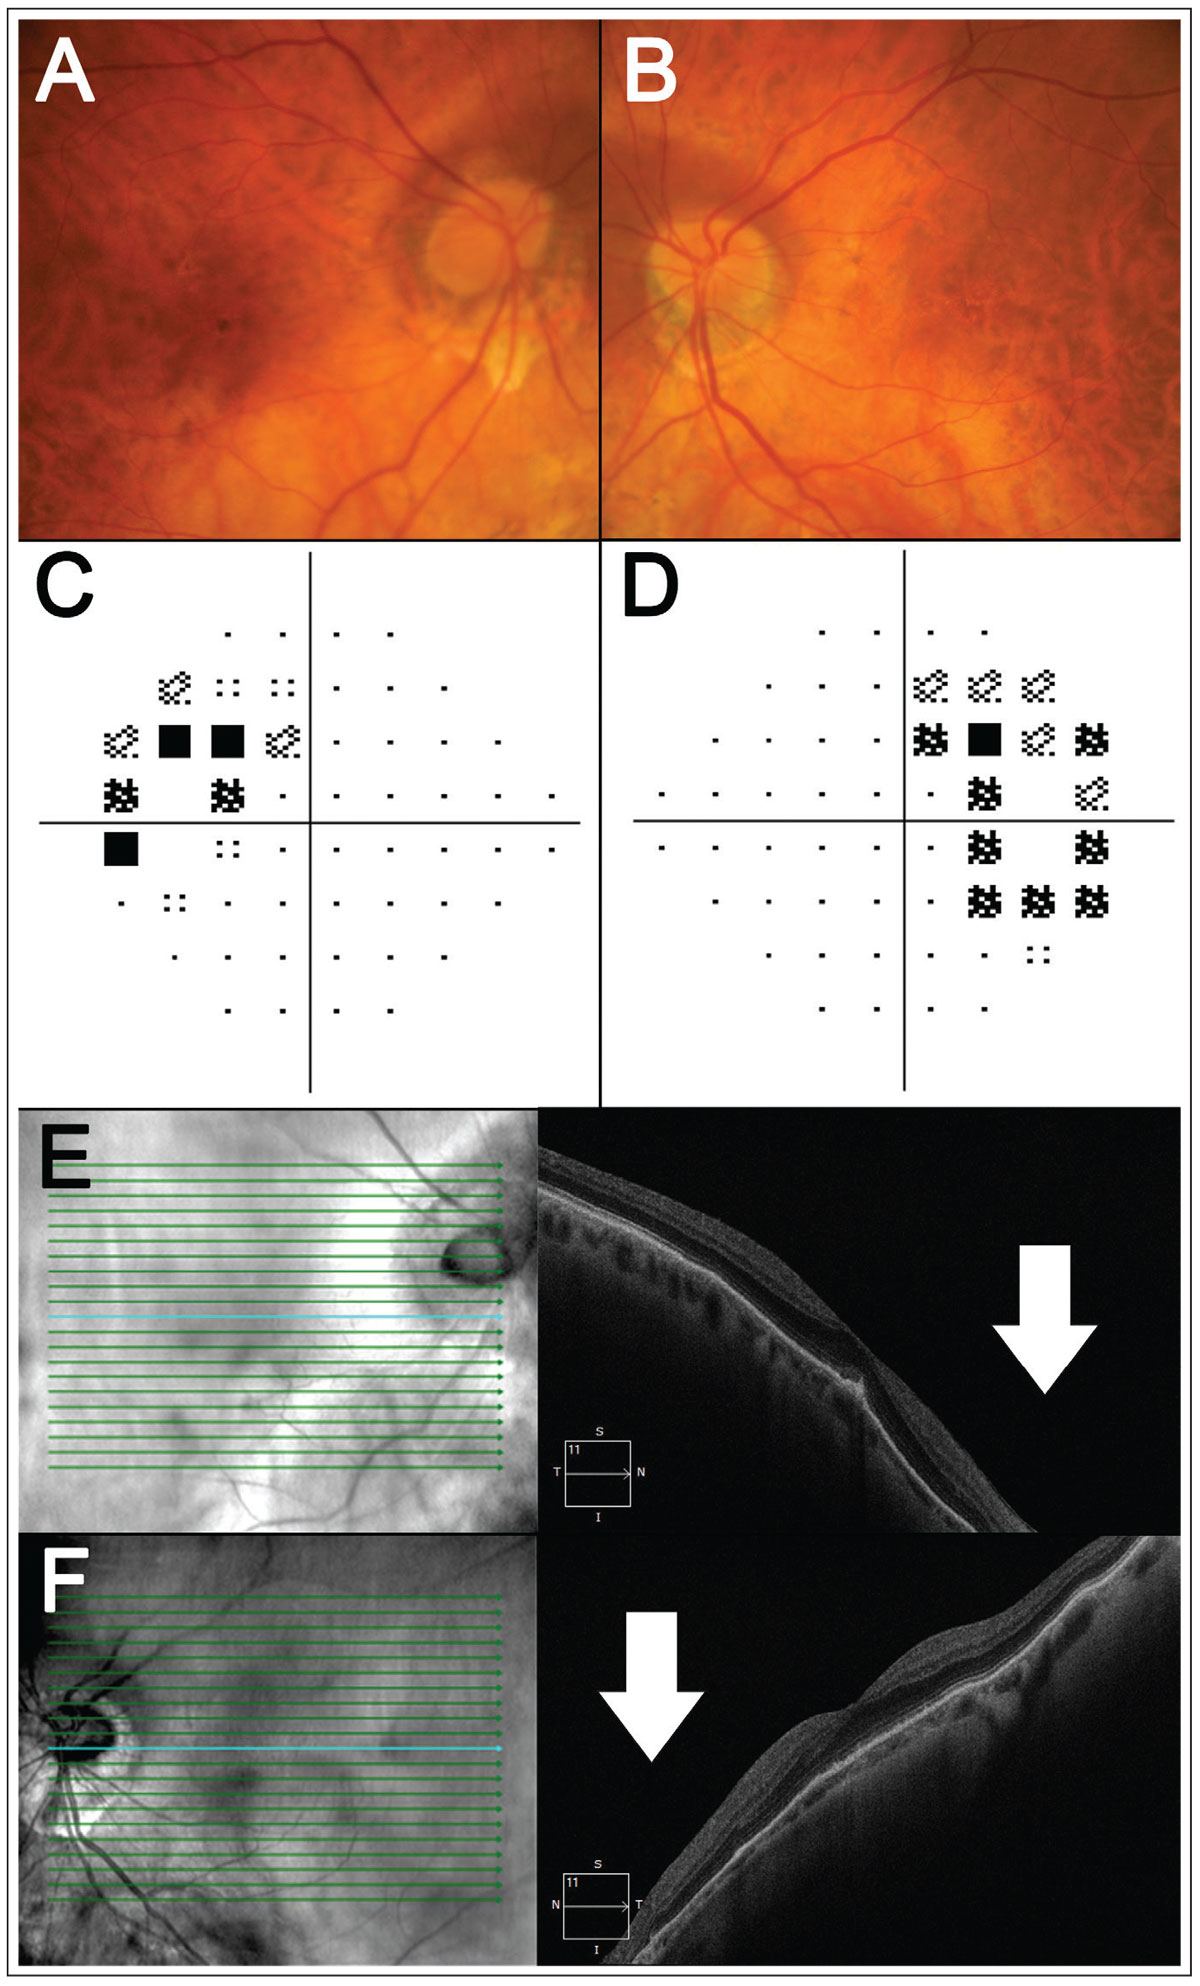
Fig. 1. A patient with bilateral tilted disc syndrome. (A-B) Fundus photography shows tilt and/or oblique insertion of the discs in both eyes with situs invertus of the blood vessels. (C-D) Here, 24-2 visual field testing shows a bitemporal visual field defect. (E-F) Horizontal OCT line scans through the fovea show posterior bowing of the nasal retina relative to the fovea (white arrows), corresponding to the temporal visual field defects. Click image to enlarge. |
To confirm the refractive nature of the defect, negative addition lens testing can be applied (usually a -3.00D negative addition lens is placed on top of the calculated testing refraction).2,6 This results in an improvement of the sensitivity values and probability scores within the region of ectasia, as the new lens results in divergence of light rays to focus more precisely onto the ectatic retina.2
While negative addition lens testing is an effective method for differentiating between pathological and refractive visual field loss, imaging can also be used to guide the process of differentiation by characterizing the retinal profile matching the visual field defect location.2,6 The primary goal of imaging in tilted disc syndrome is to characterize the region of posterior bowing corresponding to the visual field defect. This can be achieved using B-scan ultrasound, which provides an extensive view of the globe and its morphology, whereby the posterior staphyloma corresponds with an outpouching of the retinal profile.7
As many optometric practices may not readily have access to B-scan ultrasounds, OCT can be a suitable alternative.6 On OCT, the staphyloma will manifest as posterior sloping of the retinal profile. A wide, qualitative line scan placed through the region of suspected ectasia is the ideal scan type (e.g., scan the inferonasal retina for superotemporal field defect). Thus, qualitative assessment of the retinal profile on posterior pole OCT line scans can identify variations in the retinal slope to explain visual field loss due to dioptric defocus, rather than true pathology.
2. How can OCT assess for complications associated with congenital optic disc pits?
Similar to tilted disc syndrome, optic disc pits arise from defective embryonic fissure closure.9 They are often encountered incidentally upon routine examination, presenting as focal gray or white excavations of the optic nerve.9,10 While they are most commonly located in the inferotemporal quadrant of the disc, they can also present in other locations.10 Radial OCT line scans through the disc can be helpful in characterizing the profile and extent of the pit.11 On OCT, optic disc pits present as focal loss of the lamina cribrosa with associated tissue herniation (Figure 2A).9 The prognosis of optic disc pits can vary based on the accompanying clinical features, ranging from associated maculopathy to RNFL.
While the pathogenesis of optic disc pit maculopathy is still not well-understood, it is characterized by the accumulation of intraretinal or subretinal fluid as well as retinal pigmentary changes (Figure 2B).13,14 It can present in 25% to 75% of patients with optic disc pits and has the potential to result in progressive visual impairment if left untreated.15 Patients with optic disc pits presenting with reduced visual acuity or symptoms of metamorphopsia would benefit from a macular OCT scan to exclude the presence of associated maculopathy.
Another potential complication associated with optic disc pits are papillomacular RNFL defects.16,17 These are thought to arise from incomplete fusion of the temporal retinal nerve fibers, resulting in the absence of RNFL in the papillomacular region (Figure 2C).16
 |
|
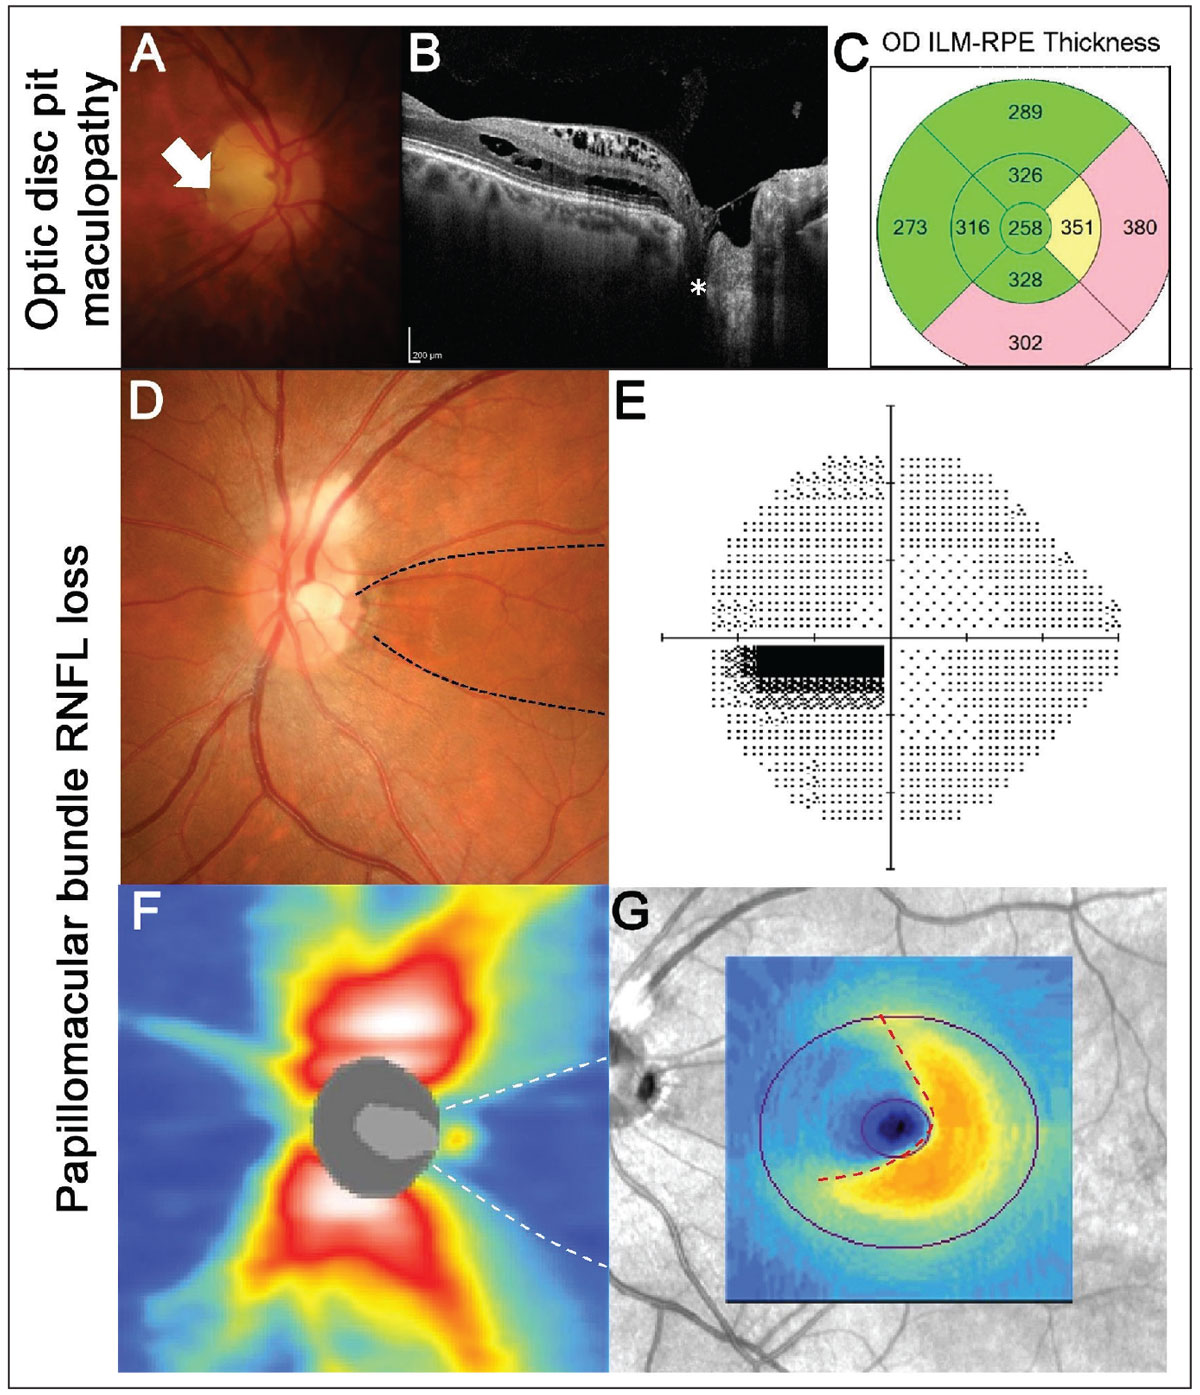
Fig. 2. Example of maculopathy associated with an optic disc pit. (A) Fundus photography shows an optic disc pit temporally (white arrow) in the right eye. (B) OCT line scans show the disc pit (white asterisk) with associated intraretinal fluid accumulation extending from the disc to the fovea. (C) EDTRS macular thickness grid shows thickening of the nasal and inferior subfields corresponding to the regions of fluid. (D-G) An example of papillomacular bundle loss associated with an optic disc pit (black dashed lines). (D) Fundus photography shows a temporal disc pit. Note there is also RNFL myelination superiorly. (E) A 24-2 visual field test showed a centrocecal defect in the left eye, corresponding to the RNFL defect. (F) OCT RNFL thickness heat map shows reduced RNFL thickness temporally (white dashed lines). (G) Macular ganglion cell analysis shows nasal loss (red dashed lines). Click image to enlarge. |
Visual function in these patients is dependent on the extent of RNFL loss. This highlights the importance of quantitative OCT, such as the thickness heat maps and deviation maps, as well as peripapillary ring scans (also called scan circle) to evaluate the depth and extent of associated loss. Unlike glaucoma, RNFL loss associated with optic disc pits is not progressive, and thus observation alone is sufficient for these patients.16
Remember: when examining patients with optic disc pits, both qualitative and quantitative OCT are crucial to assess for associated macular or RNFL complications, particularly for patients with visual symptoms.
3. How can OCT differentiate between various types of optic atrophy?
RNFL loss is a common feature across several forms of optic atrophy, including congenital conditions, ischemic optic nerve disease and hereditary optic neuropathies.18 Although these conditions share several overlapping clinical features, careful inspection of quantitative OCT outputs can provide clinicians with a means of differentiating between them.
Localized retinal ischemic events such as cotton wool spots or branch retinal occlusions can result in colocalized deep and focal loss of the RNFL and ganglion cell layer.19 In these instances, the pattern of loss follows the RNFL bundle trajectories and corresponds to location of ischemic insult (Figure 3A-C).
Qualitative OCT line scans can also highlight inner retinal thinning and disorganisation associated with ischemic retinal damage.20 As expected from a localized insult, the corresponding RNFL loss is deep, focal and well-defined.
In contrast with localized ischemic RNFL loss, the pattern of loss in congenital conditions, such as superior segmental optic nerve hypoplasia (SSONH), present with a more widespread and deep pattern of loss, often with a nasal predilection.21,22 SSONH, also known as ‘topless disc syndrome,’ presents with four distinct features in the superior aspect of the disc: displacement of the central retinal artery, disc pallor, a scleral halo and RNFL loss (Figure 3D-F).23
The location of RNFL loss can also be used in the process of differential diagnosis. For example, Leber’s hereditary optic neuropathy is an autosomal dominant optic atrophy that presents with focal temporal disc pallor and corresponding temporal focal wedge-like RNFL loss (Figure 3G-I).24,25
 |
|
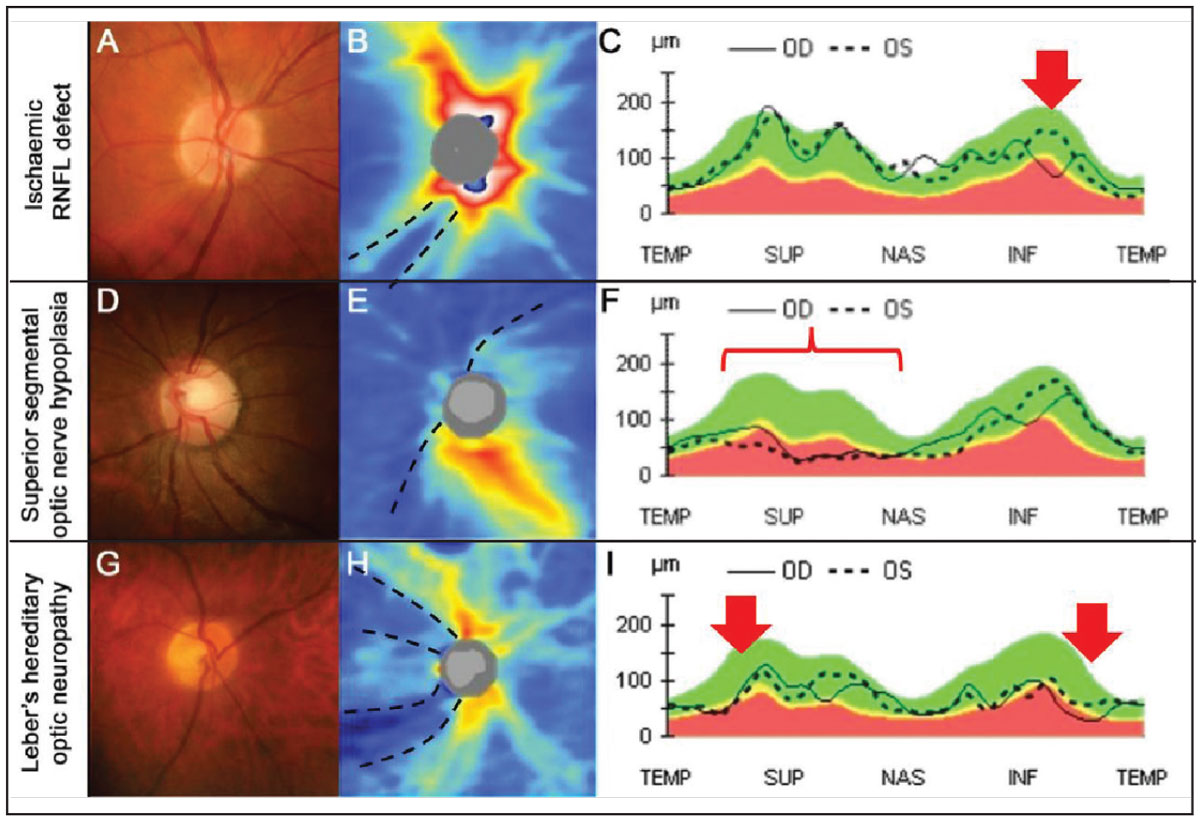
Fig. 3. An example of an ischemic RNFL defect. (A) The right disc has an intact neuroretinal rim with a deep inferior RNFL defect inferiorly. (B) OCT thickness heat map shows deep and focal RNFL thinning that is not contiguous with the disc inferotemporal (black dashed lines). (C) RNFL TSNIT graph shows focal and steep loss of the RNFL inferotemporally in the left eye (red arrow). (D-F) An example of superior segmental optic nerve hypoplasia (SSONH). (D) Classic funduscopic features of SSONH (superior displacement of the central retinal artery with a superior scleral halo. (E) OCT thickness heat map shows diffuse and deep RNFL thinning extending nasally to superiorly in an anti-clockwise manner (black dashed lines). (F) RNFL TSNIT graph shows generalized thinning in the nasal and superior aspects (red bracket). (G-I) An example of Leber’s hereditary optic neuropathy. (G) The right disc shows temporal pallor with an otherwise intact neuroretinal rim. (H) OCT thickness heat map shows deep superotemporal and inferotemporal thinning of the RNFL (black dashed lines). (I) RNFL TSNIT graph shows RNFL thinning, more marked inferotemporally than superotemporally (red arrows). Click image to enlarge. |
OCT thickness heat and deviation maps are useful for characterizing the depth and pattern of loss, while peripapillary RNFL scan circle provide quantitative information for progression analyses. Unlike hereditary optic neuropathies, congenital and ischemic RNFL loss are typically non-progressive when monitored longitudinally.16,19 Overall, it is important to relate the expected pattern of RNFL loss with the understanding of underlying pathological process for accurate differentiation.
4. Can OCT differentiate between different causes of disc elevation?
While not diagnostic, OCT can be a useful tool to guide differentiation of papilledema, optic disc drusen and RNFL protrusion secondary to congenitally crowded optic discs. With careful evaluation of OCT line scans, key features differentiating causes of elevated optic discs can be observed. As these findings can be quite subtle, high definition and high density scans with enhanced depth imaging protocols or swept-source OCT may be required to improve visualization.
With papilledema, Bruch’s membrane—just adjacent to the Bruch’s membrane opening—can protrude anteriorly towards the vitreous due to the increased intracranial pressure causing forward distension.26-28 There may also be intraretinal cystic spaces, due to either fluid leakage or mechanical retinal stretching over the elevated disc.26-28
In contrast, superficial optic disc drusen can be observed as oval, hypo-reflective lesions with hyperreflective margins and are located within the optic nerve.26,29 Horizontal hyperreflective lines observed within the optic nerve may indicate an earlier variant consistent with buried drusen.29 Each of these features is absent in congenitally crowded discs.30
An OCT feature that may be observed in cases of elevated optic discs is peripapillary hyperreflective ovoid mass-like structures (PHOMS), which are thought to represent herniated retinal ganglion cell axons.31 As PHOMS are a nonspecific finding, they are not particularly useful for differential diagnosis of the various causes of elevated optic discs (Figure 4).
 |
|
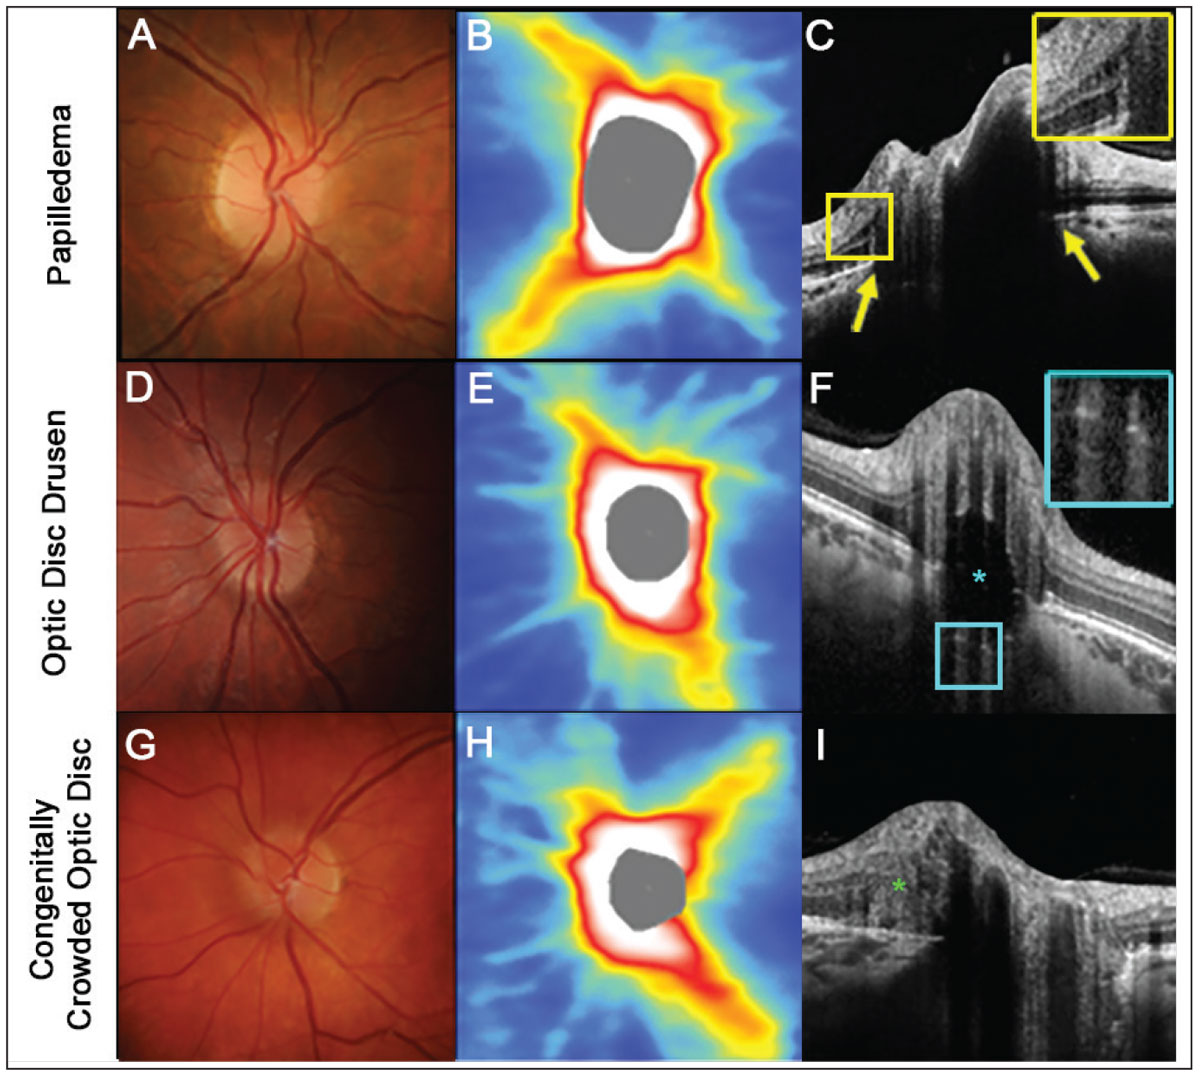
Fig. 4. An example of papilledema. (A) The right disc has minimal visible cup with some subtle blurring of the superonasal disc margin. (B) OCT thickness heat map shows thick superior and inferior RNFL. (C) A high-density OCT line scan shows anterior protrusion of Bruch’s membrane at its opening (yellow arrows) and intraretinal cystic spaces temporal to the disc margin (inset). (D-F) An example of optic disc seen more posteriorly within the optic nerve space (inset). (G-I). An example of a congenitally crowded optic disc. While the fundus photograph and OCT thickness heat map are similar to the other two conditions, there are no other features specific to these conditions visible on a high-density OCT line scan. Note that while a peripapillary hyper-reflective ovoid mass-like structure (PHOMS) can be noted at the nasal neuroretinal rim (green asterisk), this feature is non-specific to various causes of elevated optic discs (I). Click image to enlarge. |
While quantitative peripapillary RNFL data is less useful in differentiating these conditions in a cross-sectional nature, this data proves to be much more useful in longitudinal assessments because of their varying natural histories. Peripapillary increases in RNFL thickness, particularly along the superior, nasal or inferior margins, may be a warning sign of progressive papilloedema, and conversely, reductions in RNFL thickness at these locations can indicate a prior instance of papilledema. Peripapillary increases in RNFL thickness can also occur as optic disc drusen become more superficial; however, this would be accompanied by the OCT line scan findings outlined above.
Further longitudinal changes associated with optic disc drusen include development and/or progression in arcuate RNFL defects that resemble those observed in cases of glaucoma. In contrast, peripapillary RNFL scans from congenitally crowded optic discs should remain stable over time. Overall, it is important to use qualitative OCT line scans and peripapillary RNFL measurements in cases of disc elevation. This is because there are distinct advantages of each technique in various stages of assessment.
5. How can OCT be used to localize lesions along the visual pathway?
Cerebral cortical lesions of at least four weeks’ duration can often be observed on OCT imaging due to retrograde degeneration, eventually affecting the retinal ganglion cells.32 If the cortical lesion is located posterior to the lateral geniculate nucleus, resulting degeneration would cross the synapses connecting the retinal ganglion cell axons and the optic tracts. Hence, this process is sometimes referred to as trans-synaptic retrograde generation.
Assessment of OCT thickness heat and deviation maps from macular inner retinal layer analyses from both eyes are the most useful in these cases, as the location-specific information aids visualization of patterns of change. These analyses include the macular ganglion cell layer (GCL), ganglion cell-inner plexiform layer and ganglion cell complex, which are variably available across different OCT instrument software.
Due to the poor contrast between the inner plexiform and inner nuclear layers and potential for more variable segmentation, complexes including layers other than the GCL are advantageous and more commonly available across OCT software. While concordant RNFL damage will also be observed, interpretation of peripapillary OCT volume scans is more complex, especially in postchiasmal disease, due to differences in temporal vs. nasal retinal involvement between eyes and resultant different RNFL projections to the optic discs.
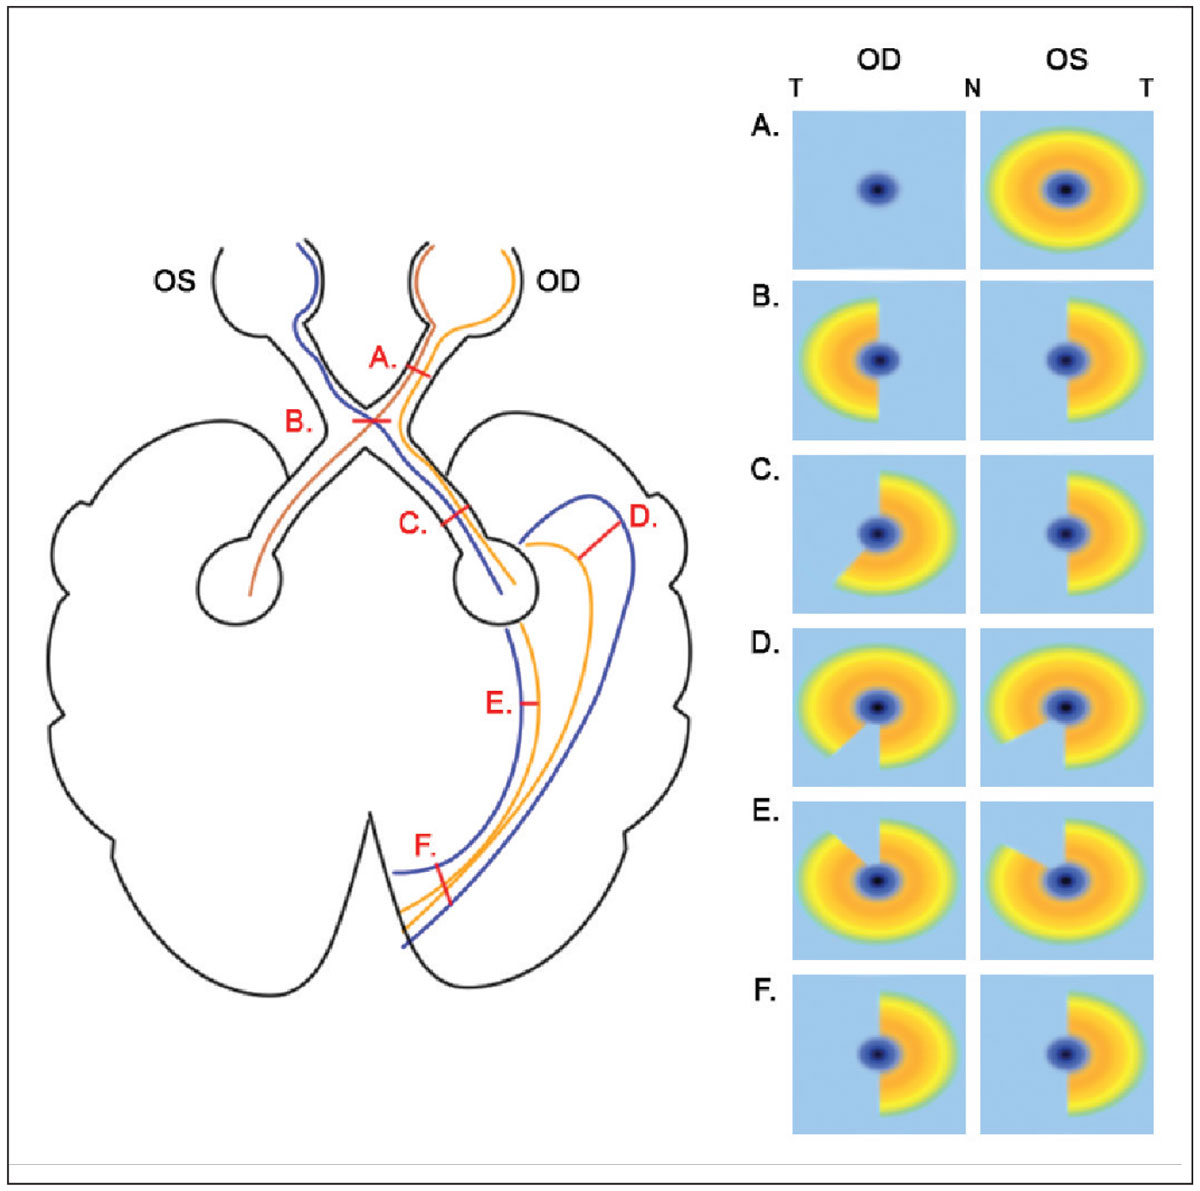
Patterns of structural damage reflect the paths of affected retinal ganglion cell axons and/or optic tracts and mirror concurrent visual field defects. Lesions anterior to the optic chiasm typically present with unilateral, global inner retinal reduction, while those affecting the optic chiasm tend to present with binasal inner retinal loss respecting the vertical midline. This is because of decussation of the nasal retinal ganglion cell axons.28,32,33 Meanwhile, defects posterior to the optic chiasm generally respect the vertical midline and are homonymous, either affecting the left or right hemifield in both eyes and with the lesion located on the same side as the eye with temporal retinal loss. Such defects may be incongruous or not entirely symmetrical, particularly with more anterior involvement at the temporal or parietal lobes, with increasing symmetry observed as lesions involve more posterior locations towards the primary visual cortex.32 A schematic depicting the patterns of inner retinal loss on OCT vs. lesion location is shown (Figure 5).
 |
|
Fig. 5. A schematic of various lesions in the visual pathway and the corresponding changes in macular inner retinal OCT results. Only lesions affecting the right hemisphere are shown for brevity; for the left hemisphere, inner retinal results would be flipped horizontally. T and N denote temporal and nasal OCT locations, respectively. (A) For prechiasmal lesions affecting the right optic nerve only, global reduction in right inner retinal thickness on OCT are observed, and the left eye is unaffected. (B) For chiasmal lesions, due to decussation of nasal retinal ganglion cell axons, binasal loss in inner retinal OCTs are observed. (C) For postchiasmal lesions affecting the right hemisphere, homonymous left losses in inner retinal OCTs are noted; these may not be entirely congruent, given the relatively anterior location. (D) For lesions in the temporal lobe, homonymous superior-left defects are expected, with greater reduction in the eye ipsilateral to the lesion. (E) For lesions in the parietal lobe, homonymous inferior-left defects are expected, with greater reduction in the eye ipsilateral to the lesion. (F) For lesions of the occipital lobe that are at the primary visual cortex, homonymous left losses in inner retinal OCTs are noted. Click image to enlarge. |
It is important to note that large, compressive lesions may not follow these general trends due to extensive involvement. For example, a large prechiasmal lesion may affect both optic nerves and subsequently present bilaterally, while a large chiasmal lesion may extend anteriorly such that temporal inner retinal involvement may be observed. Moreover, as retrograde degeneration is a gradual process, acute cortical injuries with associated visual field changes may present with normal OCT findings. However, changes may begin to occur weeks to months after the original insult and could demonstrate progression with time.
6. Can OCT diagnose neurodegenerative diseases?
In recent years, there has been rich, growing evidence to suggest that OCT can be used in documentation of pathological retinal changes associated with neurodegenerative diseases. Currently included in this list are multiple sclerosis, Parkinson’s disease and Alzheimer’s disease.34-37 Since the retina is often viewed as an extension of the central nervous system and can be visualized non-invasively, it may help aid in providing evidence of diseases like these.
The RNFL has been proposed as a biomarker in neurodegenerative disease that is reflective of axonal and neuronal loss associated with progression of neurodegenerative diseases. While several studies have shown RNFL thickness is reduced in patients with Alzheimer’s disease, multiple sclerosis and Parkinson’s disease, compared to healthy control subjects, there is little agreement in the pattern of RNFL loss to differentiate it from other optic nerve diseases, such as glaucoma.37-39 Interestingly, the relationship between the severity of disease and extent of RNFL thinning in neurodegenerative conditions remains equivocal.35,36,40
Other structural markers that have been examined, but with clinical implications that remain unclear, include the contour and shape of the foveal pit, asymmetry of foveal thickness and alterations in other retinal layer thicknesses.37-39 Before these findings have clear clinically translatable outcomes, more work is necessary to better understand retinal changes associated with neurodegenerative conditions and to differentiate these from changes associated with other ocular pathologies.
Takeaways
OCT is a highly valuable clinical tool complementing the neuro-ophthalmic assessment in optometric practice. With careful choice of scan type, evaluation of both quantitative and qualitative data and holistic interpretation with other aspects of the clinical examination, OCT can provide key additional information for conditions. These range from tilted disc syndrome to cerebral cortical lesions, aiding the diagnostic process and guiding resultant management strategies.
Dr. Wang leads the glaucoma/neuro-ophthalmology unit at the Centre for Eye Health (CFEH) in Australia. She received numerous clinical and academic awards during her undergraduate optometry degree, including a research scholarship for her work in the Retinal Networks Laboratory. Dr. Tong graduated with a bachelor of optometry (hons)/bachelor of science degree from UNSW Australia where she was awarded the University Medal. In addition to her involvement as a clinical optometrist at CFEH, Dr. Tong is currently undertaking her PhD studies with a PhD thesis titled “Application of Novel Techniques Enabling Detection of Early Function Deficits in Ocular Pathologies.”
1. Witmer MT, Margo CE, Drucker M. Tilted optic disks. Surv Ophthalmol. 2010;55(5):403-28. 2. Phu J, Wang H, Miao S, et al. Neutralizing peripheral refraction eliminates refractive scotomata in tilted disc syndrome. Optom Vis Sci. 2018;95(10):959-70. 3. Brazitikos PD, Safran AB, Simona F, Zulauf M. Threshold perimetry in tilted disc syndrome. Arch Ophthalmol. 1990;108(12):1698-700. 4. Gürlü VP, Alimgil ML, Benian O. Topographical analysis of the visual field in tilted disk syndrome. Retina. 2002;22(3):366-8. 5. Giuffrr G. The spectrum of the visual field defects in the tilted disc syndrome Clinical study and review. Neuro-Ophthalmology. 1986;6(4):239-46. 6. Vuori ML, Mäntyjärvi M. Tilted disc syndrome may mimic false visual field deterioration. Acta Ophthalmol. 2008;86(6):622-5. 7. Hoang QV, Silverman RH, Urs R, Chang S. Utility of B-Scan ultrasonography to assess posterior staphyloma in pathologic myopia patients. Inv Ophthalmol Vis Sci. 2012;53(14):2669. 8. Tanaka N, Shinohara K, Yokoi T, et al. Posterior staphylomas and scleral curvature in highly myopic children and adolescents investigated by ultra-widefield optical coherence tomography. PLOS ONE. 2019;14(6):e0218107. 9. Georgalas I, Ladas I, Georgopoulos G, Petrou P. Optic disc pit: a review. Graefes Arch Clin Exp Ophthalmol. 2011;249(8):1113-22. 10. Brown GC, Shields JA, Goldberg RE. Congenital pits of the optic nerve head. II. Clinical studies in humans. Ophthalmology. 1980;87(1):51-65. 11. Ohno-Matsui K, Hirakata A, Inoue M, et al. Evaluation of congenital optic disc pits and optic disc colobomas by swept-source optical coherence tomography. Inv Ophthalmol Vis Sci. 2013;54(12):7769-78. 12. Jain N, Johnson MW. Pathogenesis and treatment of maculopathy associated with cavitary optic disc anomalies. Am J Ophthalmol. 2014;158(3):423-35. 13. Gass JD. Serous detachment of the macula. Secondary to congenital pit of the optic nervehead. Am J Ophthalmol. 1969;67(6):821-41. 14. Johnson TM, Johnson MW. Pathogenic implications of subretinal gas migration through pits and atypical colobomas of the optic nerve. Arch Ophthalmol. 2004;122(12):1793-800. 15. Wan R, Chang A. Optic disc pit maculopathy: a review of diagnosis and treatment. Clin Exp Optom. 2020;103(4):425-9. 16. Meyer CH, Rodrigues EB, Schmidt JC. Congenital optic nerve head pit associated with reduced retinal nerve fibre thickness at the papillomacular bundle. Br J Ophthalmol. 2003;87(10):1300-1. 17. Ehongo A, Cordonnier M. Reduced retinal nerve fiber layer thickness of the papillomacular bundle and congenital pit of the optic nerve head. Neuro-Ophthalmology. 2008;32(5):270-2. 18. Gür Güngör S, Ahmet A. Are all retinal nerve fiber layer defects on optic coherence tomography glaucomatous? Turk J Ophthalmol. 2017;47(5):267-73. 19. Koh JW, Park KH, Kim MS, Kim JM. Localized retinal nerve fiber layer defects associated with cotton wool spots. Jpn J Ophthalmol. 2010;54(4):296-9. 20. Schmid H, Renner M, Dick HB, Joachim SC. Loss of inner retinal neurons after retinal ischemia in rats. Inv Ophthalmol Vis Sci. 2014;55(4):2777-87. 21. Fuse N, Aizawa N, Yokoyama Y, et al. [Analysis of retinal nerve fiber layer thickness in superior segmental optic hypoplasia (SSOH)]. Nippon Ganka Gakkai Zasshi. 2012;116(6):575-80. 22. Yagasaki A, Sawada A, Manabe Y, Yamamoto T. Clinical features of superior segmental optic hypoplasia: hospital-based study. Jpn J Ophthalmol. 2019;63(1):34-9. 23. Kim MR, Park SE, Oh SY. Clinical feature analysis of congenital optic nerve abnormalities. Jpn J Ophthalmol. 2006;50(3):250-5. 24. Hedges TR, Gobuty M, Manfready RA, et al. The optical coherence tomographic profile of leber hereditary optic neuropathy. Neuroophthalmology. 2016;40(3):107-12. 25. Yu-Wai-Man P, Bailie M, Atawan A, et al. Pattern of retinal ganglion cell loss in dominant optic atrophy due to OPA1 mutations. Eye (Lond). 2011;25(5):596-602. 26. Bassi ST, Mohana KP. Optical coherence tomography in papilledema and pseudopapilledema with and without optic nerve head drusen. Indian J Ophthalmol. 2014;62(12):1146-51. 27. Malhotra K, Padungkiatsagul T, Moss HE. Optical coherence tomography use in idiopathic intracranial hypertension. Ann Eye Sci. 2020;5. 28. Chen JJ, Costello F. The role of optical coherence tomography in neuro-ophthalmology. Annals of Eye Science. 2018;3:35-53. 29. Malmqvist L, Bursztyn L, Costello F, et al. The optic disc drusen studies consortium recommendations for diagnosis of optic disc drusen using optical coherence tomography. J Neuroophthalmol. 2018;38(3):299-307. 30. Chiang J, Yapp M, Ly A, et al. Retinal nerve fiber layer protrusion associated with tilted optic discs. Optom Vis Sci. 2018;95(3):239-46. 31. Fraser JA, Sibony PA, Petzold A, et al. Peripapillary hyperreflective ovoid mass-like structure (PHOMS): an optical coherence tomography marker of axoplasmic stasis in the optic nerve head. J Neuroophthalmol. 2021;41(4):431-41. 32. Zangerl B, Whatham A, Kim J, et al. Reconciling visual field defects and retinal nerve fibre layer asymmetric patterns in retrograde degeneration: an extended case series. Clin Exp Optom. 2017;100(3):214-26. 33. Danesh-Meyer HV, Yoon JJ, Lawlor M, Savino PJ. Visual loss and recovery in chiasmal compression. Prog Retin Eye Res. 2019;73:100765. 34. Satue M, Obis J, Rodrigo MJ, et al. Optical coherence tomography as a biomarker for diagnosis, progression, and prognosis of neurodegenerative diseases. J Ophthalmol. 2016;2016:8503859. 35. Al-Mujaini AS, Al-Mujaini MS, Sabt BI. Retinal nerve fiber layer thickness in multiple sclerosis with and without optic neuritis: a four-year follow-up study from Oman. BMC Ophthalmology. 2021;21(1):391. 36. Kim JI, Kang BH. Decreased retinal thickness in patients with Alzheimer's disease is correlated with disease severity. PLoS One. 2019;14(11):e0224180. 37. Kromer R, Serbecic N, Hausner L, et al. Detection of retinal nerve fiber layer defects in Alzheimer's disease using SD-OCT. Front Psychiatry. 2014;5:22. 38. Altıntaş Ö, Işeri P, Ozkan B, Cağlar Y. Correlation between retinal morphological and functional findings and clinical severity in Parkinson's disease. Documenta ophthalmologica Advances in ophthalmology. 2008;116:137-46. 39. Petzold A, de Boer JF, Schippling S, et al. Optical coherence tomography in multiple sclerosis: a systematic review and meta-analysis. Lancet Neurol. 2010;9(9):921-32. 40. El-Kattan MM, Esmat SM, Esmail EH, et al. Optical coherence tomography in patients with Parkinson’s disease. The Egyptian Journal of Neurology, Psychiatry and Neurosurgery. 2022;58(1):21. 41. Parisi V, Restuccia R, Fattapposta F, et al. Morphological and functional retinal impairment in Alzheimer's disease patients. Clin Neurophysiol. 2001;112(10):1860-7. 42. Paquet C, Boissonnot M, Roger F, et al. Abnormal retinal thickness in patients with mild cognitive impairment and Alzheimer's disease. Neurosci Lett. 2007;420(2):97-9. 43. Spund B, Ding Y, Liu T, et al. Remodeling of the fovea in Parkinson disease. J Neural Transm (Vienna). 2013;120(5):745-53. 44. Shrier EM, Adam CR, Spund B, et al. Interocular asymmetry of foveal thickness in Parkinson disease. J Ophthalmol. 2012;2012:728457. 45. Garcia-Martin E, Larrosa JM, Polo V, et al. Distribution of retinal layer atrophy in patients with Parkinson disease and association with disease severity and duration. Am J Ophthalmol. 2014;157(2):470-8.e2. |
