OCT: Eye Care’s All-Purpose ToolThis versatile device has dozens of functions in eye care today. In the January 2023 issue of Review of Optometry, our experts explore its capabilities in full. Check out the other articles featured in this OCT-themed issue:
|

Imaging with optical coherence tomography (OCT) has become standard in retina care. Its widespread use can be attributed to its ability to deliver a vast amount of high-resolution information regarding the structure of the retina both quickly and safely. A strength of OCT is its ability to segment various retina layers, which enables cross-sectional structural examination of the retina along with evaluation of various analytic data such as thickness maps extracted from OCT scans (Figure 1).1 Using this advanced technology, we can diagnose posterior segment disease earlier and more accurately, identify biomarkers that indicate severity of disease and deepen our understanding of the pathological processes that affect the retina.
Here, we’ll discuss how to spot and analyze OCT findings associated with a wide range of retinal pathologies. Keep in mind that this list only scratches the surface of the abundance of information the technology can offer.
Age-related Macular Degeneration (AMD)
A wealth of data can be uncovered when evaluating the OCT cross-section in a patient with confirmed or suspected AMD to better stage the disease and consider the patient’s risk of progression. While most clinicians are aware to look for the presence of drusen on OCT cross-section scans, a variety of additional biomarkers of disease severity can be spotted in regard to atrophic or nonexudative AMD.
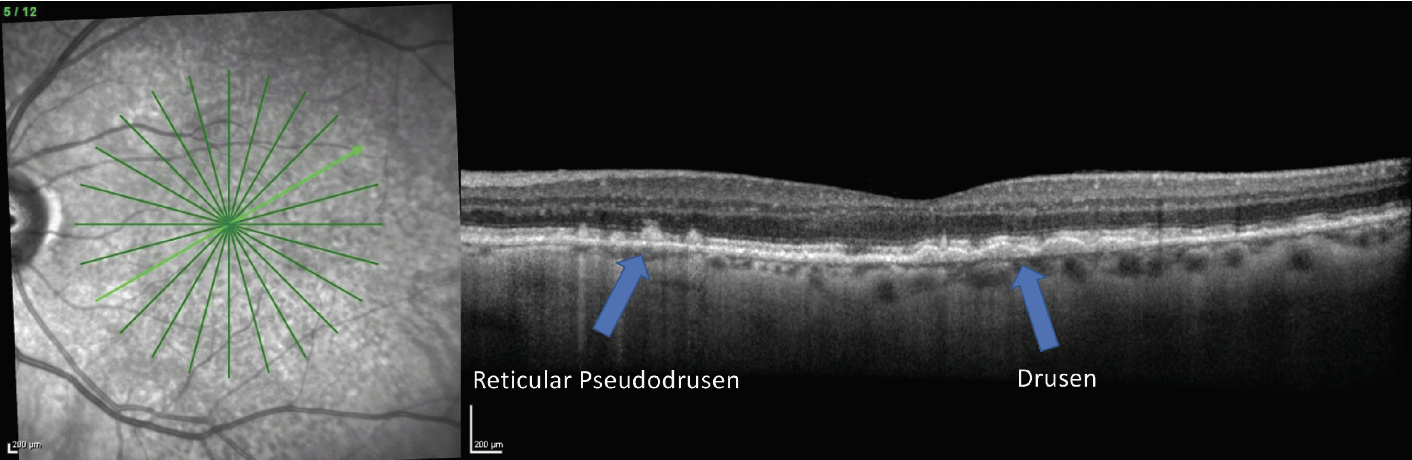
Reticular pseudodrusen (RPD), also called subretinal drusenoid deposits, are a drusen phenotype associated with higher risk of conversion to advanced-stage AMD, particularly development of geographic atrophy (GA).2,3 In addition, patients with RPD tend to have worse visual function. RPD present as hyperreflective deposits on OCT that sit above the retinal pigment epithelium (RPE), as opposed to typical drusen deposits, which are sub-RPE.3 RPD may also be identified by their reticular pattern on imaging such as infrared reflectance or fundus autofluorescence (FAF) (Figure 2).2,3
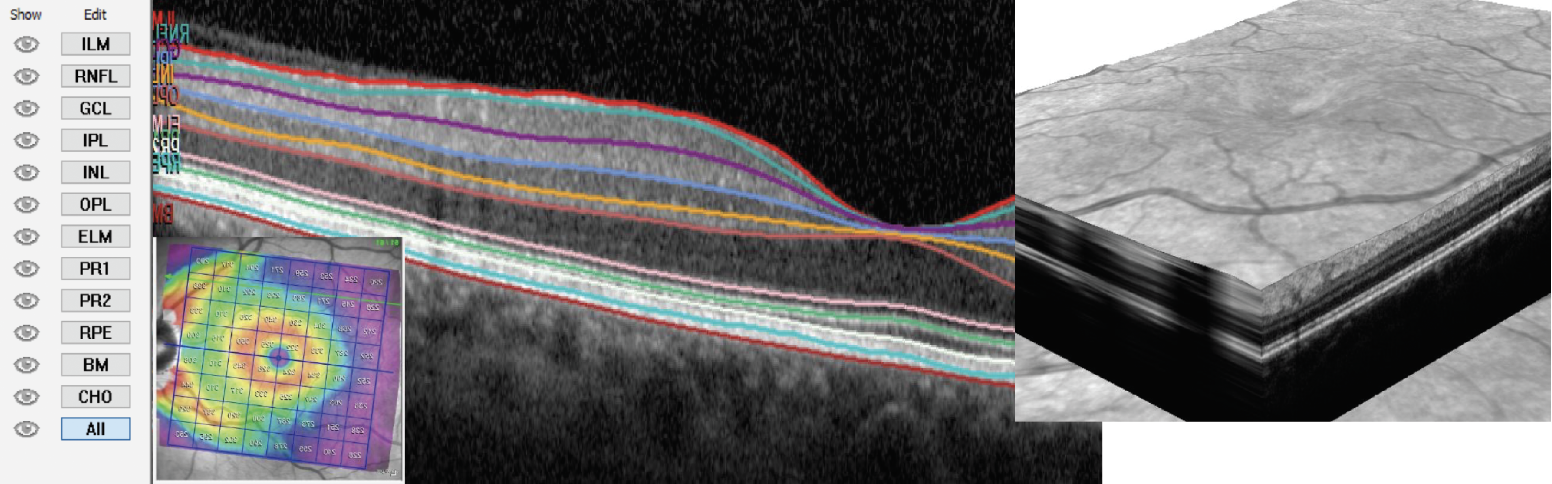 |
| Fig. 1. OCT segmentation allows for various manipulation of images and algorithms for measurable analytics. Click image to enlarge. |
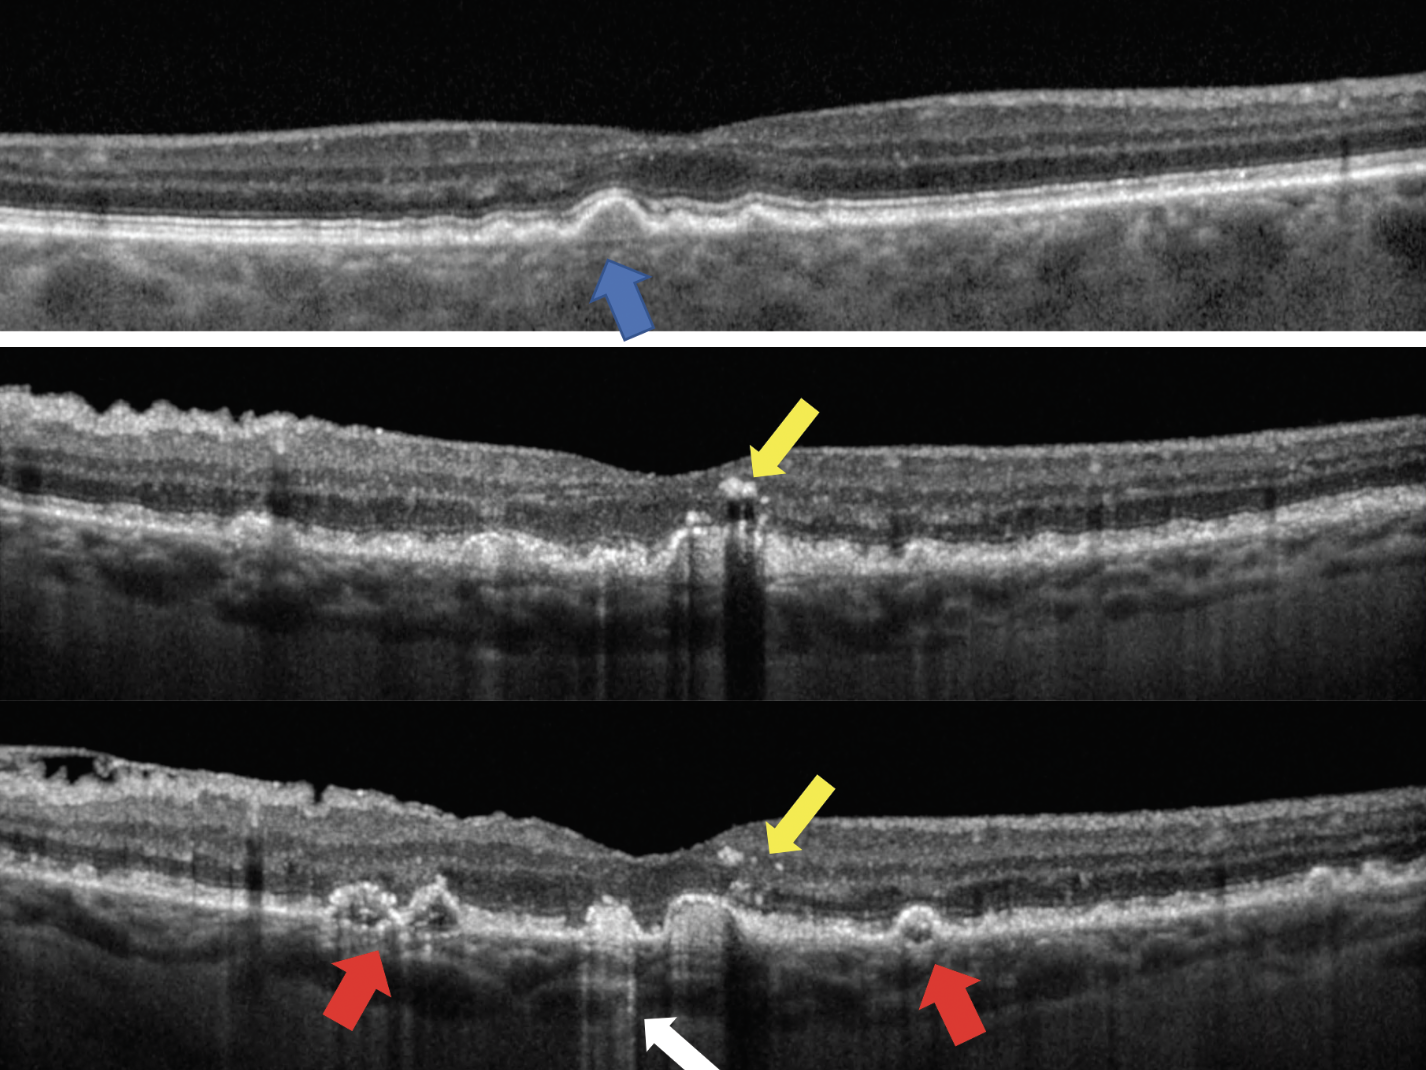
The internal structure of drusen as seen on OCT can also give clues to the severity of disease. Patients who have drusen with homogenous, uniform, moderate internal reflectivity have less risk to develop advanced-stage AMD than those with drusen that are internally hyperreflective, hyporeflective or those with non-uniform internal composition (Figure 3).4-6
 |
|
Fig. 2. A patient with both a typical drusen phenotype presenting on OCT as sub-RPE drusen deposits and RPD that present as hyperreflective deposits sitting on top of the RPE (right image). The infrared reflectance image (left) also demonstrates the reticular pattern consistent with RPD. Click image to enlarge. |
AMD stages in the Beckman Scale rely on the size of the drusen. Using the line caliper on the OCT, you can make a more accurate assessment as to the stage of the AMD based on drusen size.
Hyperreflective foci are associated with higher risk of conversion to advanced-stage AMD.7 They represent a more compromised RPE with anterior migration of pigment. Clinically, these may be observed as pigmentary abnormalities. On OCT, they present as hyperreflective points that are often found overlying large pigment epithelial detachments (PEDs) (Figure 3).7
 |
|
Fig. 3. The top image shows drusen with moderate, uniform internal reflectivity (blue arrow). The bottom two images show a patient with biomarkers of more advanced disease who presents with drusen of irregular, non-uniform internal reflectivity (red arrows), hyperreflective columns (white arrow) and hyperreflective foci (yellow arrows). Click image to enlarge. |
Hyperreflective columns also represent RPE compromise. The RPE is highly reflective and creates an optical barrier for OCT light to penetrate into the choroid. As the RPE degenerates, this optical barrier is broken down and columns of light can cascade into the choroid. On OCT, this presents as hyperreflective light columns extending into the choroid. This may be a precursor to the development of GA (Figure 3).7
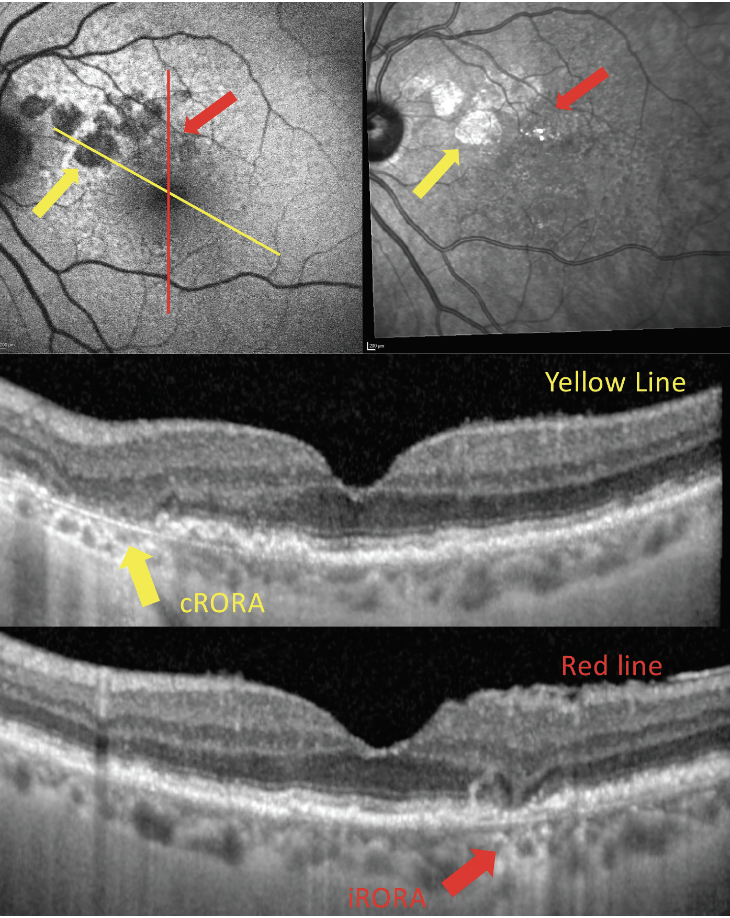
Incomplete RPE and outer retinal atrophy (iRORA) is a relatively new term defined by the Classification of Atrophy Meeting group (Table 1). This is a non-clinical finding that is defined purely by retinal imaging, primarily OCT. On OCT, iRORA presents as loss of outer retinal integrity that may include loss or thinning of the RPE, ellipsoid zone and outer nuclear layer; however, it doesn’t yet meet the criteria of complete RPE and outer retinal atrophy (cRORA). iRORA is an important OCT finding, as it’s a precursor to cRORA.8,9
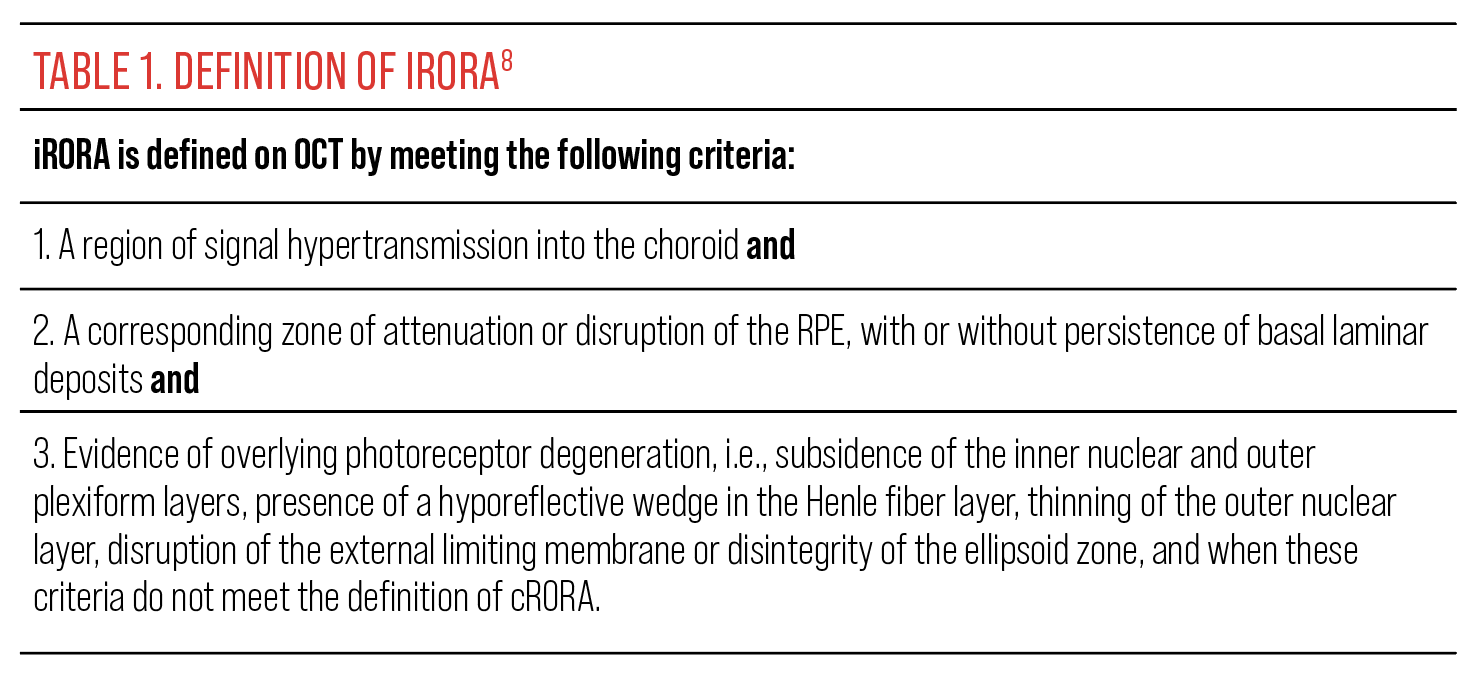 |
| Click image to enlarge. |
OCT is also a valuable tool in the detection of GA, the presence of which constitutes advanced-stage nonexudative AMD. On OCT, GA presents as a complete loss of the RPE, photoreceptor integrity line and atrophy of the outer nuclear layer. There is also increased light transmission into the choroid in regions of GA.
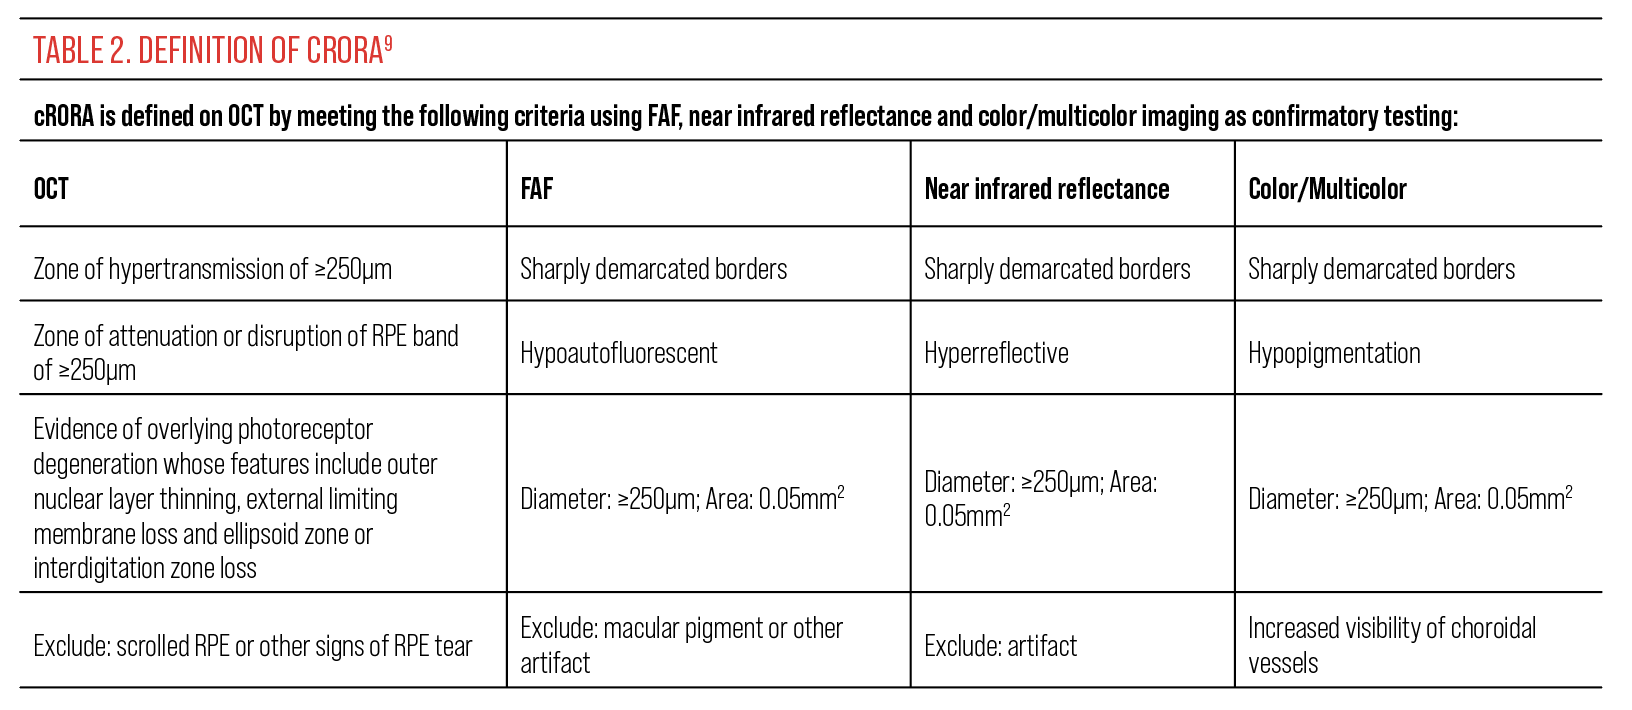
Historically, GA was defined as a clinical finding. More recently, the Classification of Atrophy Meeting group defined the term cRORA based on OCT, near infrared reflectance imaging and FAF (Figure 4). The criteria for a diagnosis of cRORA using OCT are described in Table 2.
 |
|
Fig. 4. OCT, FAF (top left) and infrared reflectance (top right) imaging of a patient with regions of both cRORA and iRORA. Click image to enlarge. |
While the terms “GA” and “cRORA” are similar, they are not entirely interchangeable.9 For example, the term “GA” is suggested to be used only in the absence of macular neovascularization (MNV), whereas the term cRORA can be used whether there is or is not associated MNV.9
 |
| Click image to enlarge. |
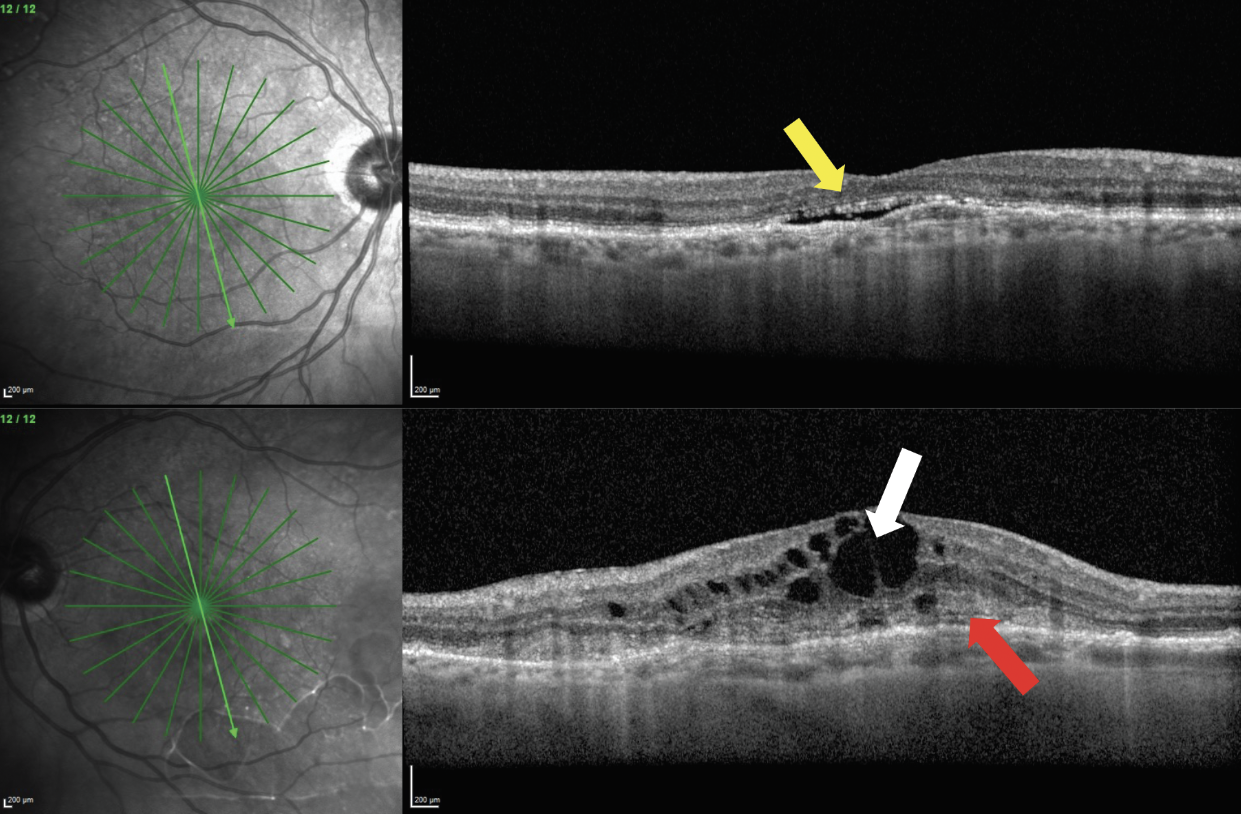
OCT is highly sensitive in detecting signs of exudation that may constitute exudative AMD. These findings may be visualized on OCT prior to ophthalmoscopic detection or patient symptoms. When evaluating an OCT cross-section scan in a patient with AMD, be careful to note any presence of potential subretinal fluid (hyporeflective space between the RPE and neurosensory retina) and intraretinal fluid (hyporeflective cystic spaces in the neurosensory retina). These can be signs of exudation from MNV (Figure 5).
 |
|
Fig. 5. A patient presents with bilateral MNV. The right eye (top images) has presence of subretinal fluid (yellow arrow). The left eye (bottom images) has intraretinal fluid (white arrow) and subretinal hyperreflective material (red arrow). Click image to enlarge. |
Another OCT-specific finding in MNV is subretinal hyperreflective material. This will present on the scan as moderately reflective, disheveled material between the neurosensory retina and the RPE. It can indicate exudative material from MNV (Figure 5). Presence of intraretinal fluid and/or subretinal hyperreflective material is related to poorer visual outcomes in patients with MNV.10
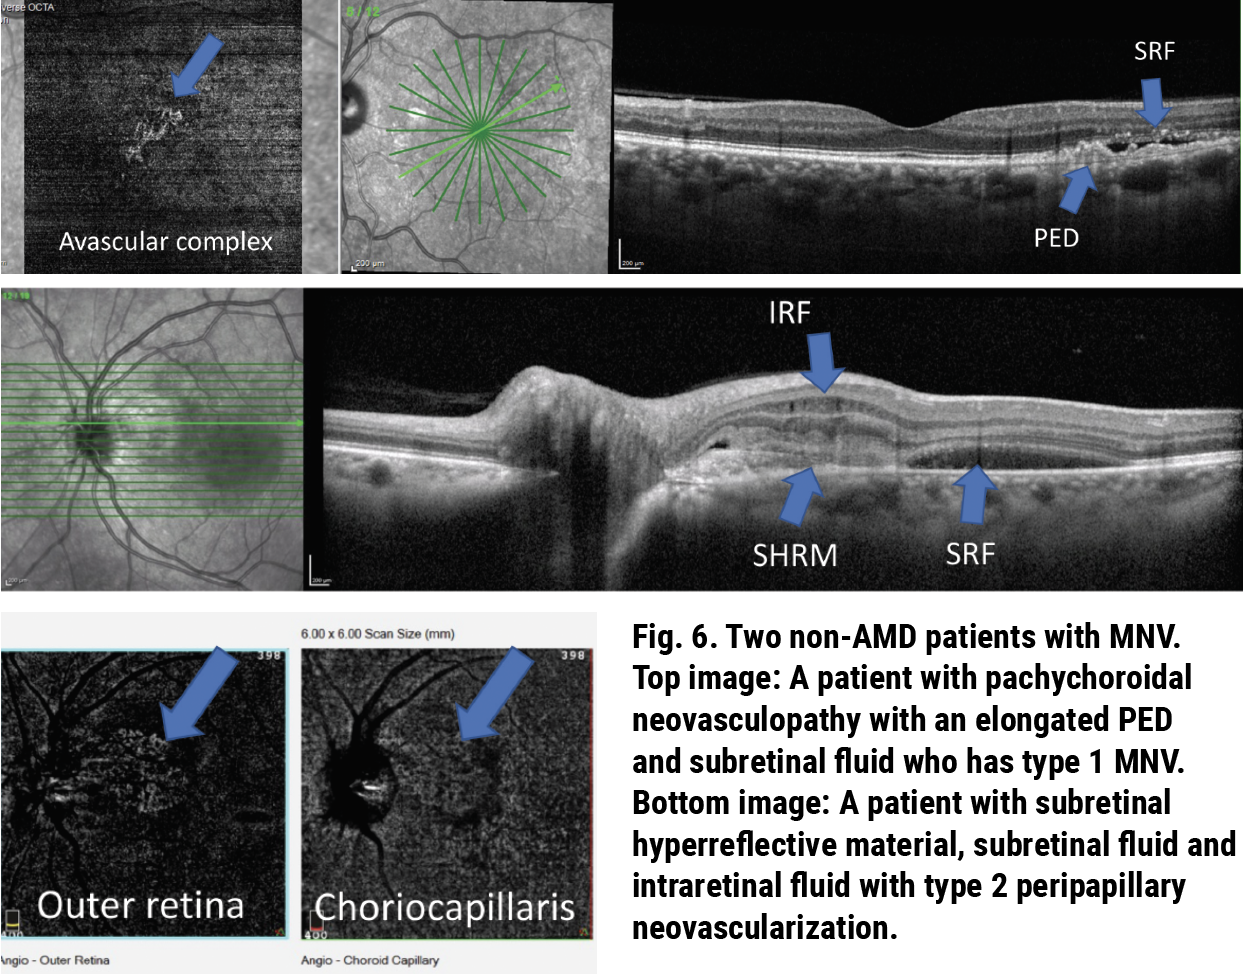
MNV occurs in four different types depending on the location and origin of the neovascular network. Type 1 is located beneath the RPE. Type 2 is located above the RPE. Type 3 or retinal angiomatous proliferation originates in the deep neurosensory retina, and type 4 is mixed type MNV. The variability of MNV presentation leads to a variety of presentations on OCT. For example, patients with type 1 MNV will present with a PED often with overlying subretinal fluid, while those with types 2 or 3 may not have a clearly visible PED and tend to have more subretinal hyperreflective material and intraretinal fluid. Due to these variations in presentation, it is important to consider any possible signs of exudation as a potential MNV—especially in those at risk (i.e., patients with AMD) (Figure 6).11
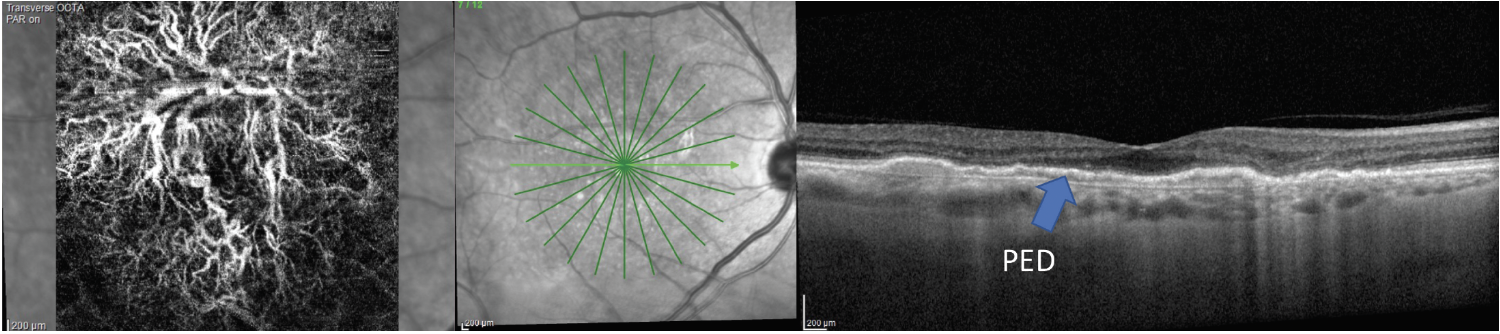
OCT angiography (OCT-A) is also available on some OCT platforms and may aid in the diagnosis of MNV. On OCT-A, attention should be paid to the avascular complex and the choriocapillaris for presence of irregular vascular flow. OCT-A has brought about new categorization of MNV called subclinical or nonexudative MNV. This type of MNV presents as a PED that is often shallow and elongated. There is minimal or no sign of subretinal or intraretinal fluid on the OCT, but the PED is harboring MNV that is evident on OCT-A. These patients have a strong likelihood of developing exudation (Figure 7).12
 |
| Click image to enlarge. |
 |
|
Fig. 7. AMD patient with a large, elongated PED and no sign of fluid on the OCT has an extensive MNV network present on the avascular complex of his OCT-A scan. Click image to enlarge. |
Diabetic Retinopathy (DR)
In regards to DR, OCT has become the standard by which to diagnose and follow the course of diabetic macular edema (DME). Historically, DME was described as clinically significant or not based on criteria set forth in the Early Treatment DR Study. The term “clinically significant macular edema” has come to be outdated, with DME now being described as either center-involving (comprising the central 1000µm subfield) or non-center-involving based on OCT scans.13
Imaging with OCT can easily reveal cases of DME that aren’t detectable on the clinical exam, and the topographical distribution of edema can be visualized through evaluation of retinal thickness maps (Figure 8). It’s important to note that evaluating OCT cross-section scans is critical to arrive at an accurate DME diagnosis rather than relying on data from thickness, as DME is only one condition of many that may thicken the retina. It’s important to look at the retinal thickness maps alongside the B-scans.
 |
|
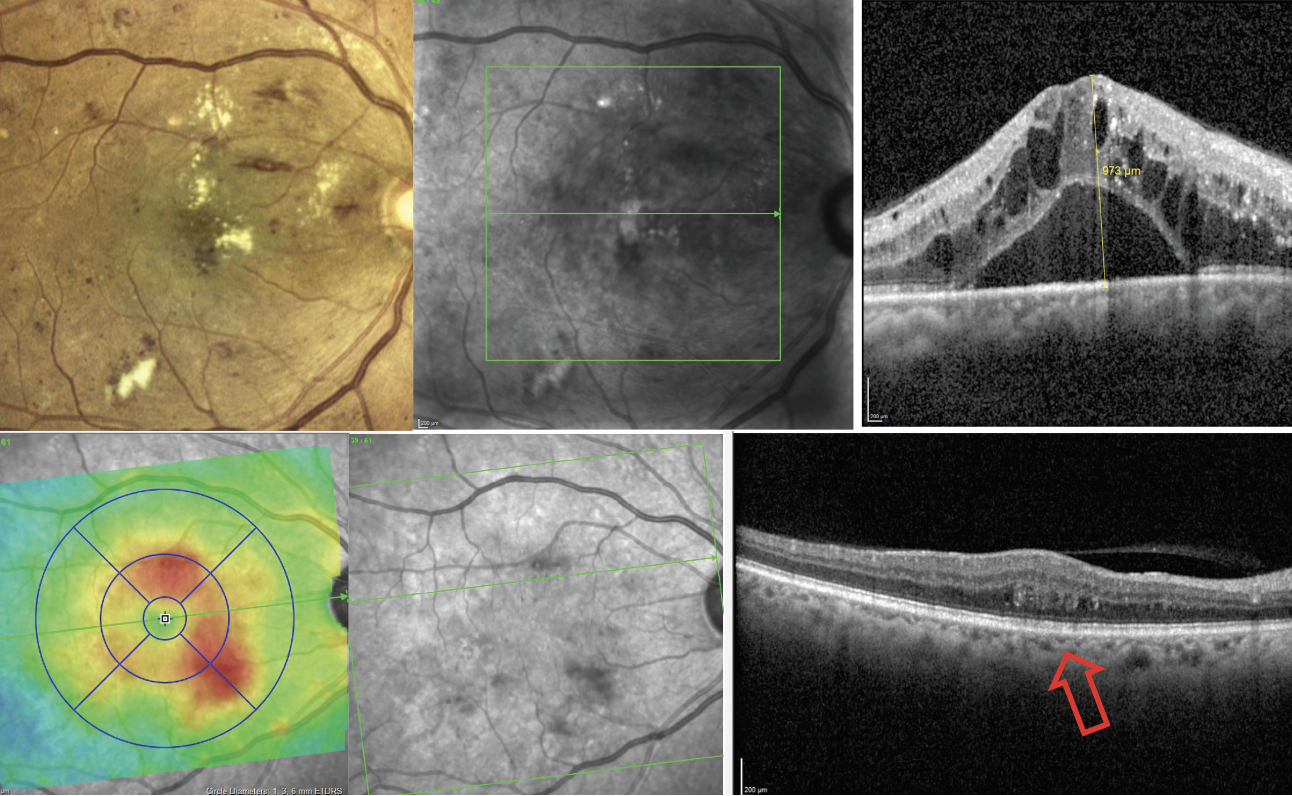
Fig. 8. OCT can be used to detect DME that is either clinically visible (top images) or not (bottom images). The bottom left image is a retinal thickness map that helps display the distribution of macular thickening from edema. Click image to enlarge. |
Findings such as exudate and cotton wool spots can also be identified on OCT. Exudates appear as hyperreflective deposits often within the neurosensory retina (specifically the outer plexiform layer) but can also accumulate in the subretinal space. Subretinal exudation in the fovea is an indicator of poor visual prognosis. Cotton wool spots appear as hyperreflective thickening in the retinal nerve fiber layer (RNFL).
Retinal hemorrhages may also be visible on OCT. Hemorrhage typically presents as a hyperreflective alteration on the OCT. Intraretinal hemorrhages that are common in DR may be difficult to distinguish on the OCT scan as they may blend into other hyperreflective retinal layers. However, one use for imaging over hemorrhages may be to determine their location. Patients with proliferative DR are prone to developing preretinal and vitreous hemorrhage as blood vessels from fragile retinal neovascular networks bleed on the surface of the retina and into the vitreous. Preretinal hemorrhages may present as hyperreflective deposits on the retinal surface between the RNFL and internal limiting membrane (ILM) or between the ILM and the posterior vitreous hyaloid. Vitreous hemorrhage may present as hyperreflective clumps in the vitreous, shadowing on the OCT image, or as small hyperreflective pinpoints within the vitreous (red blood cells).
 |
|
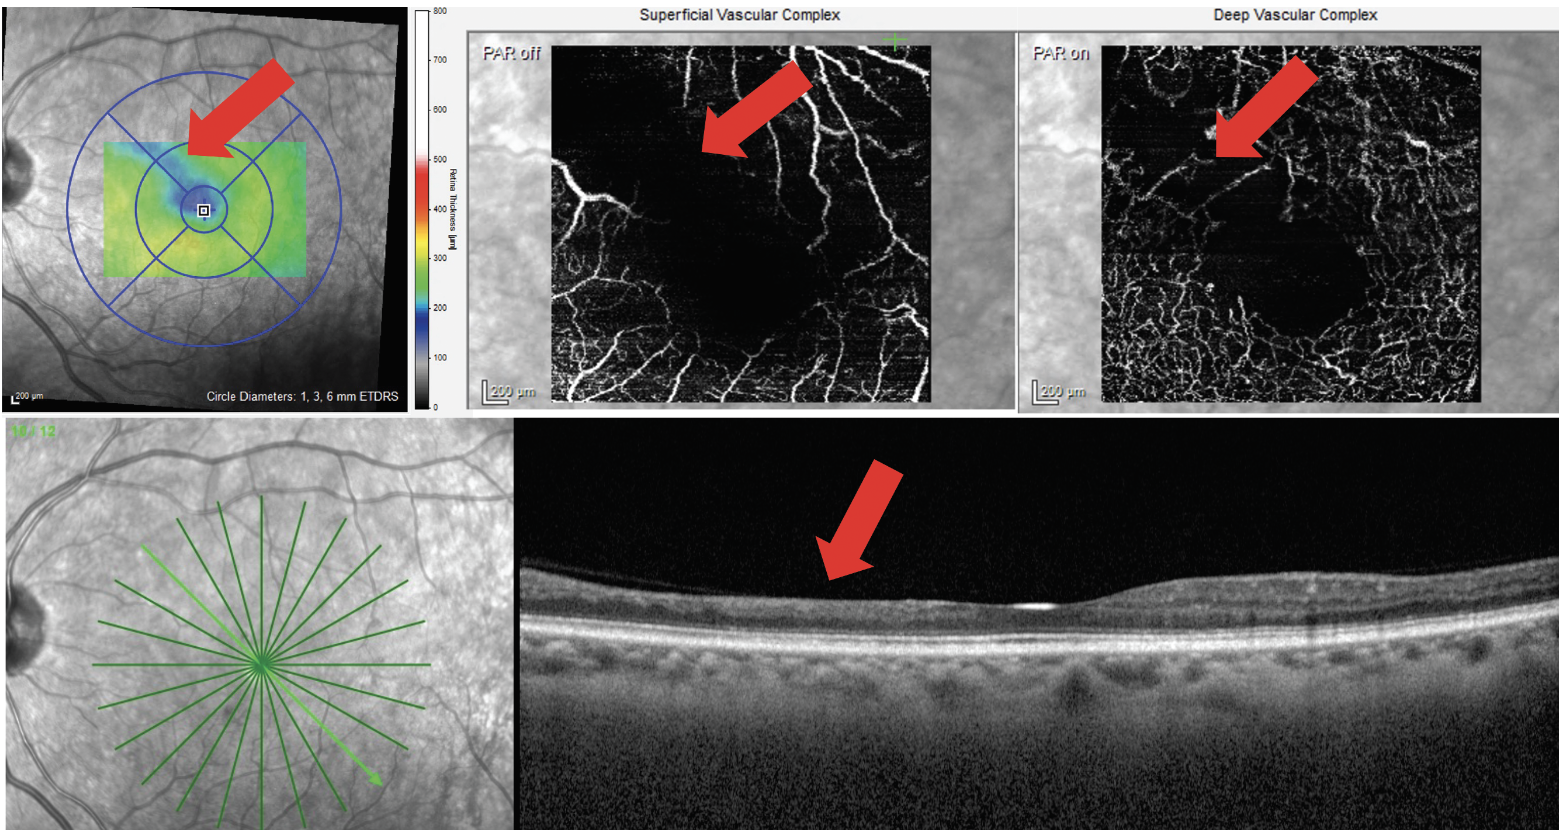
Fig. 9. A patient with DR presents with a localized area of inner retinal thinning on OCT cross-section scan. This corresponds to an area of macular thinning on the thickness map (top left image) as well as capillary non-perfusion in the superficial and deep capillary plexi (top middle and top right images). Click image to enlarge. |
In addition to the detection of DME, exudate and cotton wool spots, changes on the OCT cross-section scan can reveal clinically invisible data about your patient’s disease severity. As we know, diabetes causes capillary damage that leads to a cascade of events with potential sight-threatening sequelae including DME and complications from neovascularization. Destruction of capillaries and capillary nonperfusion in the macula can also lead to decreased visual sensitivity and even severe central vision loss. As the retinal vasculature feeds the inner retina, its atrophy leads to OCT findings such as inner retinal atrophy and retinal thinning as well as disorganization of the retinal inner layers (DRIL).14
 |
|
Click image to enlarge. |
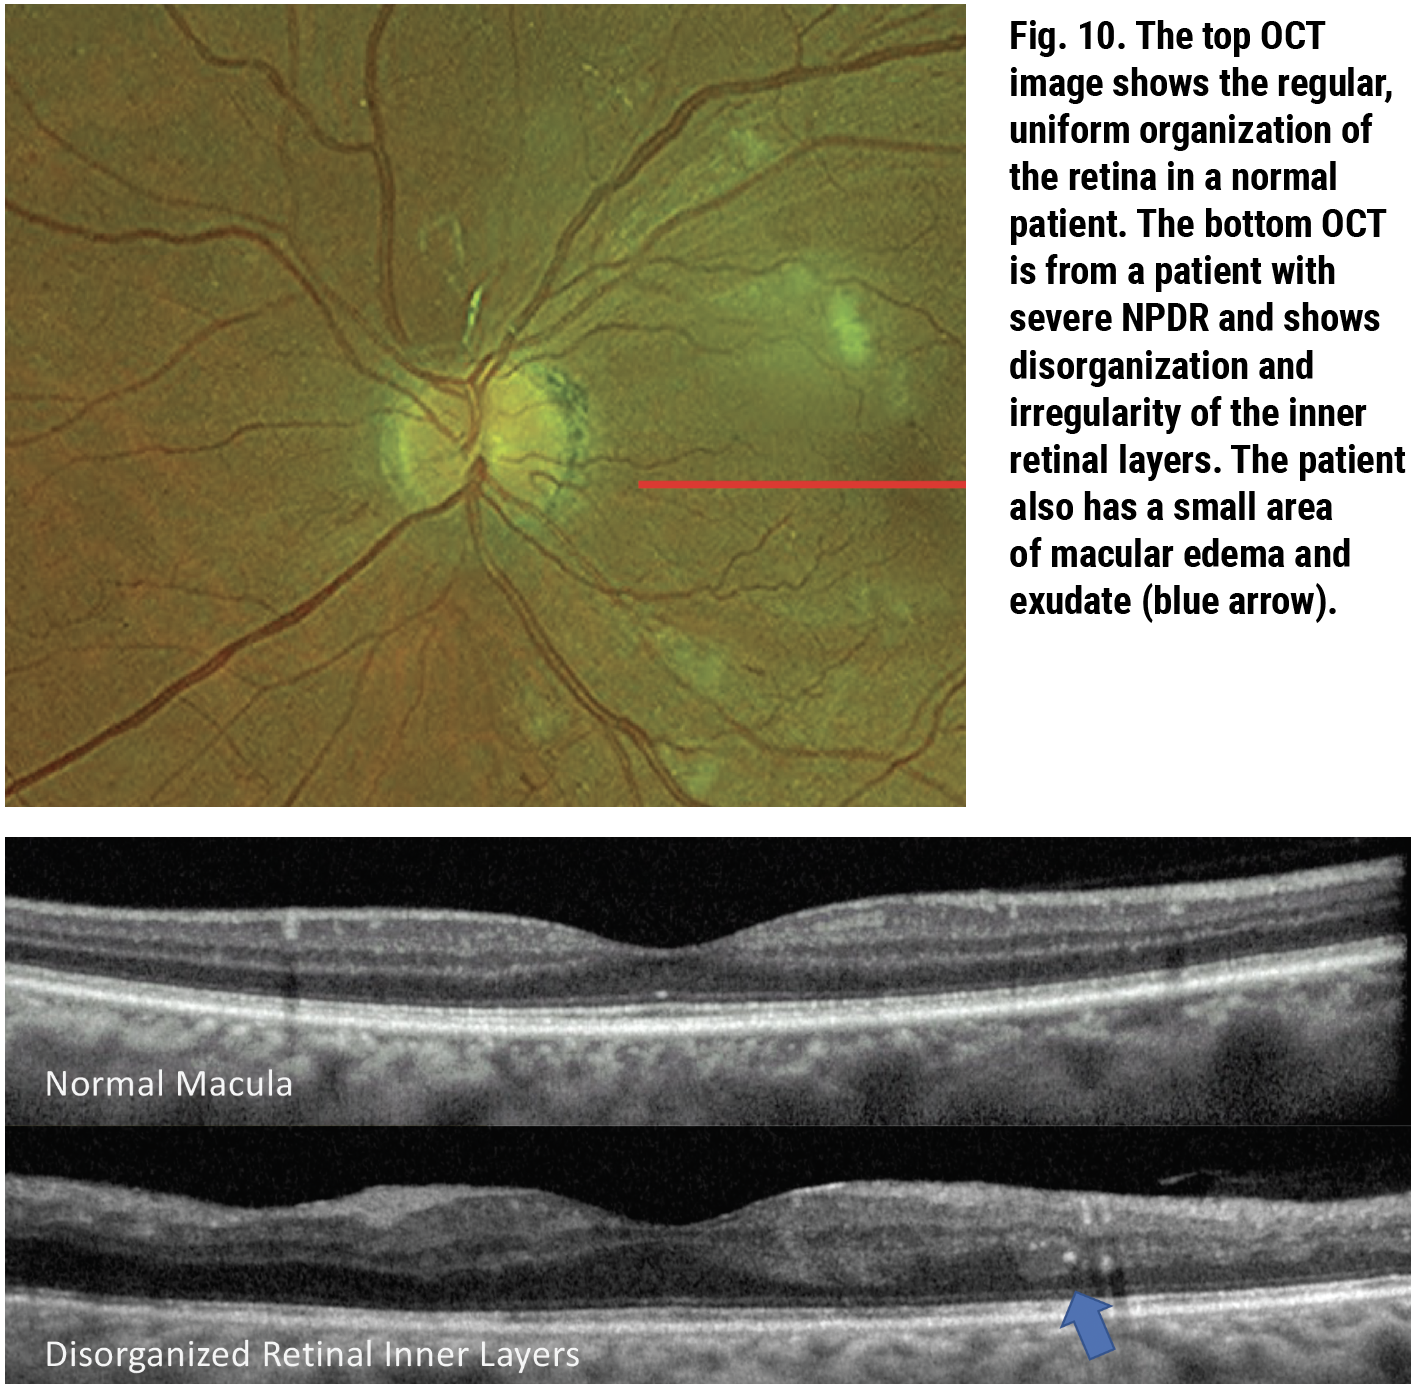
Macular thinning contributing to or found in DR is associated with macular non-perfusion on fluorescein angiography (FA) and OCT-A. This OCT biomarker is also associated with decreased visual function and more severe retinopathy (Figure 9). In addition to causing this frank thinning of the inner retinal layers, capillary non-perfusion can lead to DRIL.15,16 This is another OCT-based finding where the regular and well-defined pattern of the inner retinal layers becomes disorganized with less regularity and indistinct retinal layers (Figure 10). Since DRIL is related to macular non-perfusion, its presence is also related to non-perfusion visualized on FA and OCT-A.
One unconventional use for OCT in diabetic retinopathy is identifying neovascularization of the disc or elsewhere. Traditionally, FA has been used to differentiate retinal neovascularization from other vascular abnormalities, such as intraretinal microvascular abnormalities (IRMA) and shunt vessels, by evaluating the vascular permeability of the vessels. Neovascularization leaks prominently on FA. More recently, OCT-A has been helpful in making this distinction by determining the location of the vasculature: IRMA is intraretinal vasculature while retinal neovascularization exists on the retinal surface and vitreoretinal interface. However, OCT itself may also be helpful. Retinal neovascularization grows in optically dense networks and presents as hyperreflective fibrotic opacities on the retinal surface or vitreous—often on the back surface of the posterior vitreous cortex.17
Central Serous Retinopathy (CSR)
Two improvements in OCT imaging that had a major impact on how we monitor and detect retinal disease include enhanced-depth imaging (EDI) and swept-source OCT (SS-OCT). EDI-OCT is a modified method of imaging acquisition with spectral-domain (SD)-OCT to provide deeper cuts, improving the structural details of the choroid. Using a different laser with a wavelength of 1050nm, which is 180nm longer than that used in SD-OCT, SS-OCT enables greater tissue penetration and better visibility of the choroid.18
 |
|
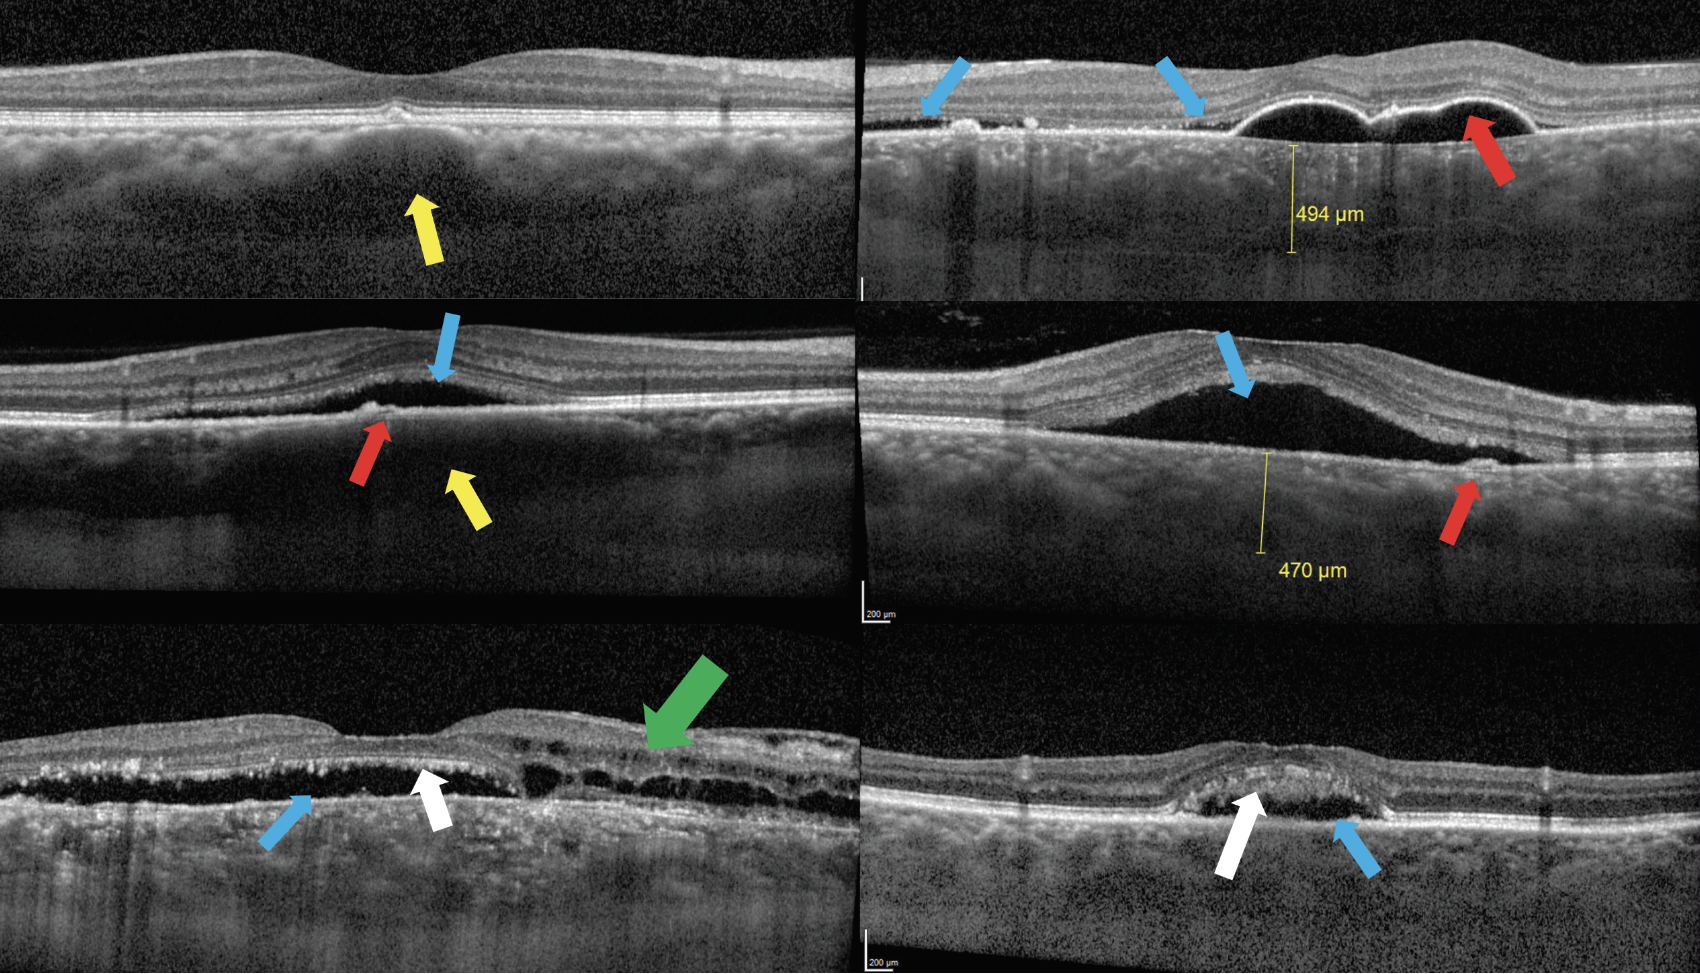
Fig. 11. Top left: Patient with pachydrusen overlying a pachyvessel (yellow arrow) with compression of Sattler’s layer and choriocapillaris. Top right: Patient with chronic case of CSR presents with pachychoroid, large serous PED (red arrow) and subretinal fluid (blue arrows). Middle left: Acute case of CSR presents with small PED (red arrow) and subretinal fluid (blue arrow) with underlying pachyvessel (yellow arrow) with compression of Sattler’s layer and choriocapillaris. Middle right: Acute case of CSR with pachychoroid, small PED (red arrow) and subretinal fluid (blue arrow). Bottom left and right: Chronic CSR presents with subretinal fluid (blue arrows) as well as intraretinal fluid (green arrow) and photoreceptor outer segment elongation or “shaggy photoreceptors” (white arrows). Click image to enlarge. |
These two innovations in OCT revealed information about the choroid that previously remained unattainable, leading to an entire spectrum of disease: the pachychoroidal disease spectrum. This includes pachychoroid pigment epitheliopathy; pachychoroid neovasculopathy, polypoidal choroidal vasculopathy and peripapillary pachychoroid syndrome, as well as CSR. Classic OCT findings in acute CSR include PED (not always present) with overlying or adjacent subretinal fluid. As the disease becomes chronic, OCT findings such as shaggy photoreceptors and intraretinal fluid may be present (Figure 11).19
Evaluation of the choroid with OCT is important in the diagnosis of CSR and other pachychoroidal diseases. Choroidal thickness varies based on many factors including age and refractive error, making it difficult to define a “typical” choroidal thickness. Reports of normal subfoveal choroidal thickness vary from 190µm to 350µm. In general, patients with CSR tend to have thicker than average subfoveal choroid or pachychoroid; however, they may have relatively normal subfoveal thickness and have localized regions of pachychoroid. In addition to the strict thickness of the choroid, the characteristics of choroidal vessels can also be a clue as to the disease process at hand. Pachyvessels, or vessels with abnormally large lumen, may be present, particularly in the deeper Haller’s layer of the choroid. These vessels may displace smaller vessels in the more superficial Sattler’s layer and choriocapillaris (Figure 11).19
 |
|
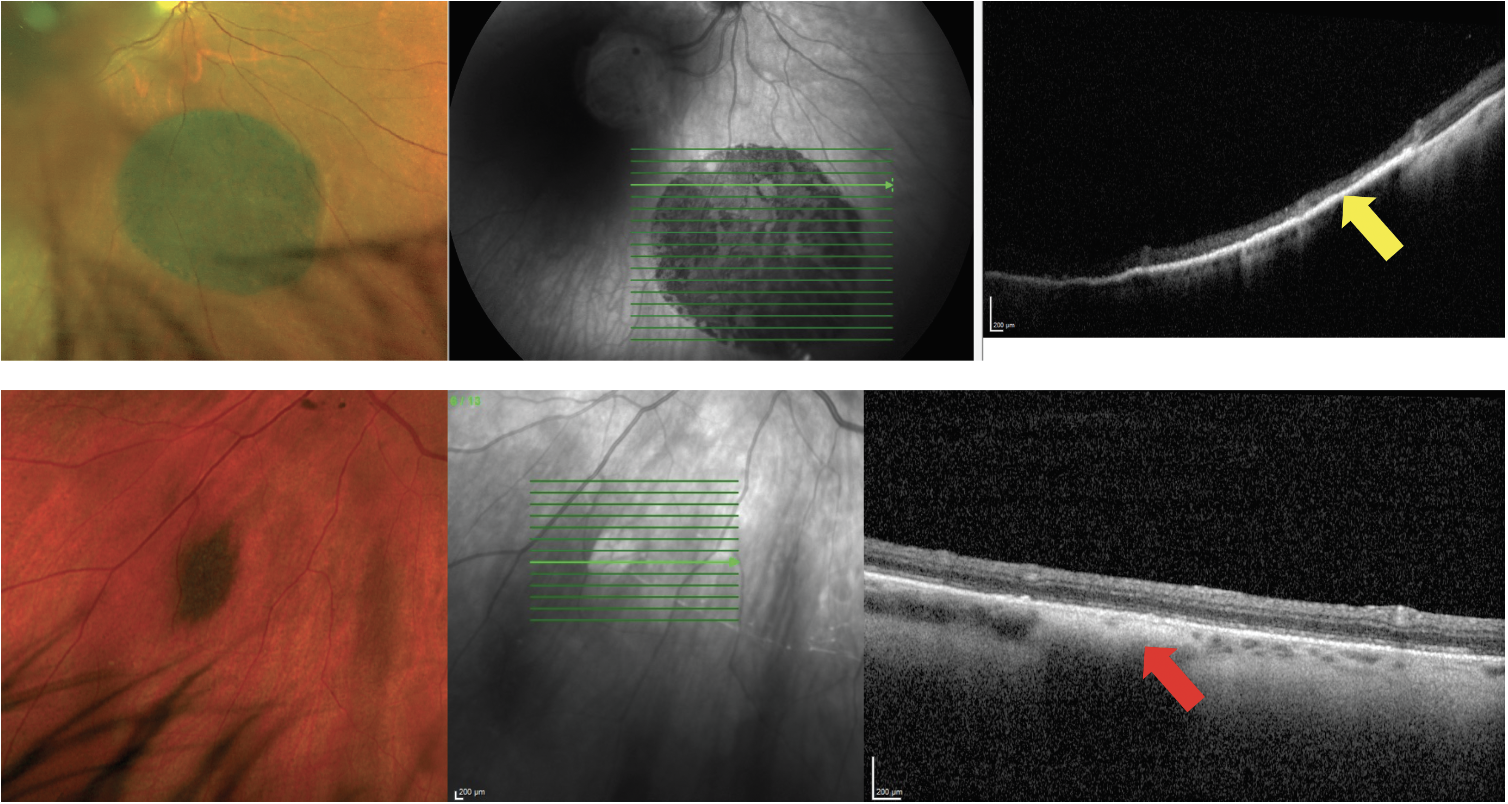
Fig. 12. OCT can be used to differentiate between pigmented lesions of the posterior segment, such as congenital hypertrophy of the RPE (CHRPE), which are lesions of the RPE (top images), and choroidal nevi (bottom images). This pigmented CHRPE shows hyperreflectivity and thickening of the RPE with posterior shadowing but no involvement of the choroid (yellow arrow). The small nevus shows hyperreflectivity and posterior shadowing within the choroid (red arrow). Click image to enlarge. |
Posterior Segment Tumors
The same advancements in technology that allow better visualization of the choroid with OCT have also improved our ability to evaluate choroidal lesions. OCT imaging of posterior segment lesions can help to confirm the location of a tumor which may affect the retina, RPE or choroid (Figure 12). In addition, OCT imaging adds value in the ever-important distinction between a benign choroidal nevus and a choroidal melanoma. In smaller lesions, OCT imaging allows for evaluation of anterior-posterior thickness and can help monitor thickness changes over time.
 |
|
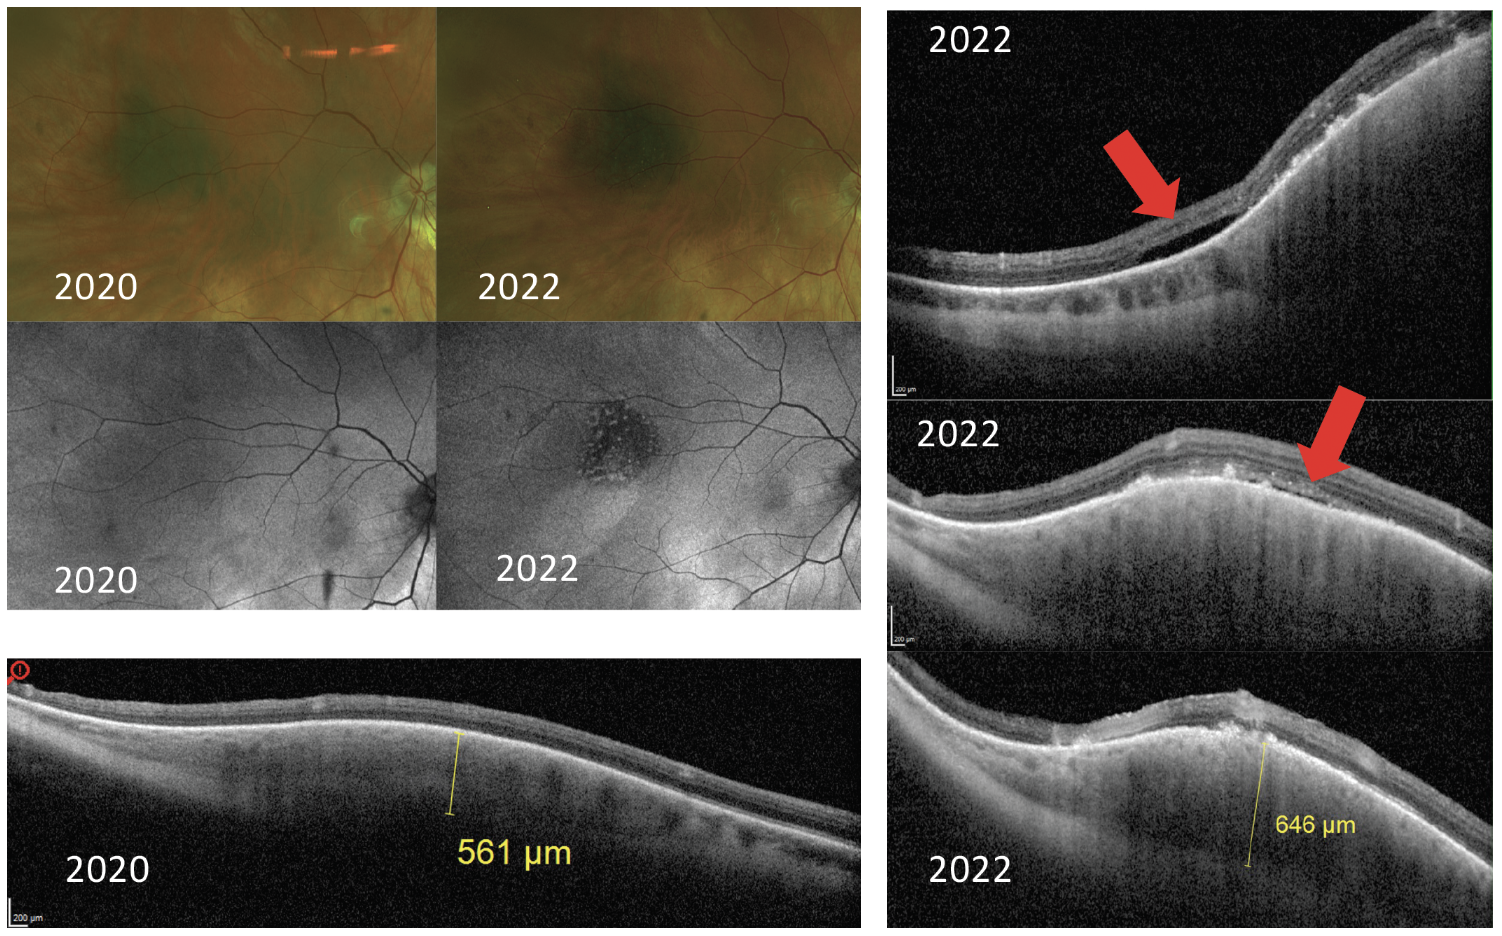
Fig. 13. A patient presents with a choroidal nevus in 2020 with normal overlying autofluorescence, total thickness on OCT of 561μm and no sign of subretinal fluid on OCT. In 2022, the lesion has mild growth in diameter, but there are concerning findings of hyper-autofluorescence on FAF, growth in thickness shown on OCT and new presence of subretinal fluid on OCT (red arrows). These findings are concerning due to the risk of conversion to ocular melanoma. Click image to enlarge. |
OCT scans also play a very important role in the detection of subretinal fluid, which is an important risk factor for choroidal melanoma. Chronic subretinal fluid can lead to the presence of shaggy photoreceptors, another negative prognostic factor.20 OCT is more sensitive in the detection of subretinal fluid than clinical examination and ultrasonography (Figure 13). Multimodal imaging of choroidal lesions is now advised with use of fundus photography, ultrasonography, OCT and FAF.21
Vitreomacular Interface Findings and Abnormalities
The next few sections discuss a variety of vitreomacular and vitreoretinal interface findings that can be revealed upon OCT examination. Note that when assessing this layer of the retina, it’s best not to use EDI to maximize inner retinal resolution.
 |
|
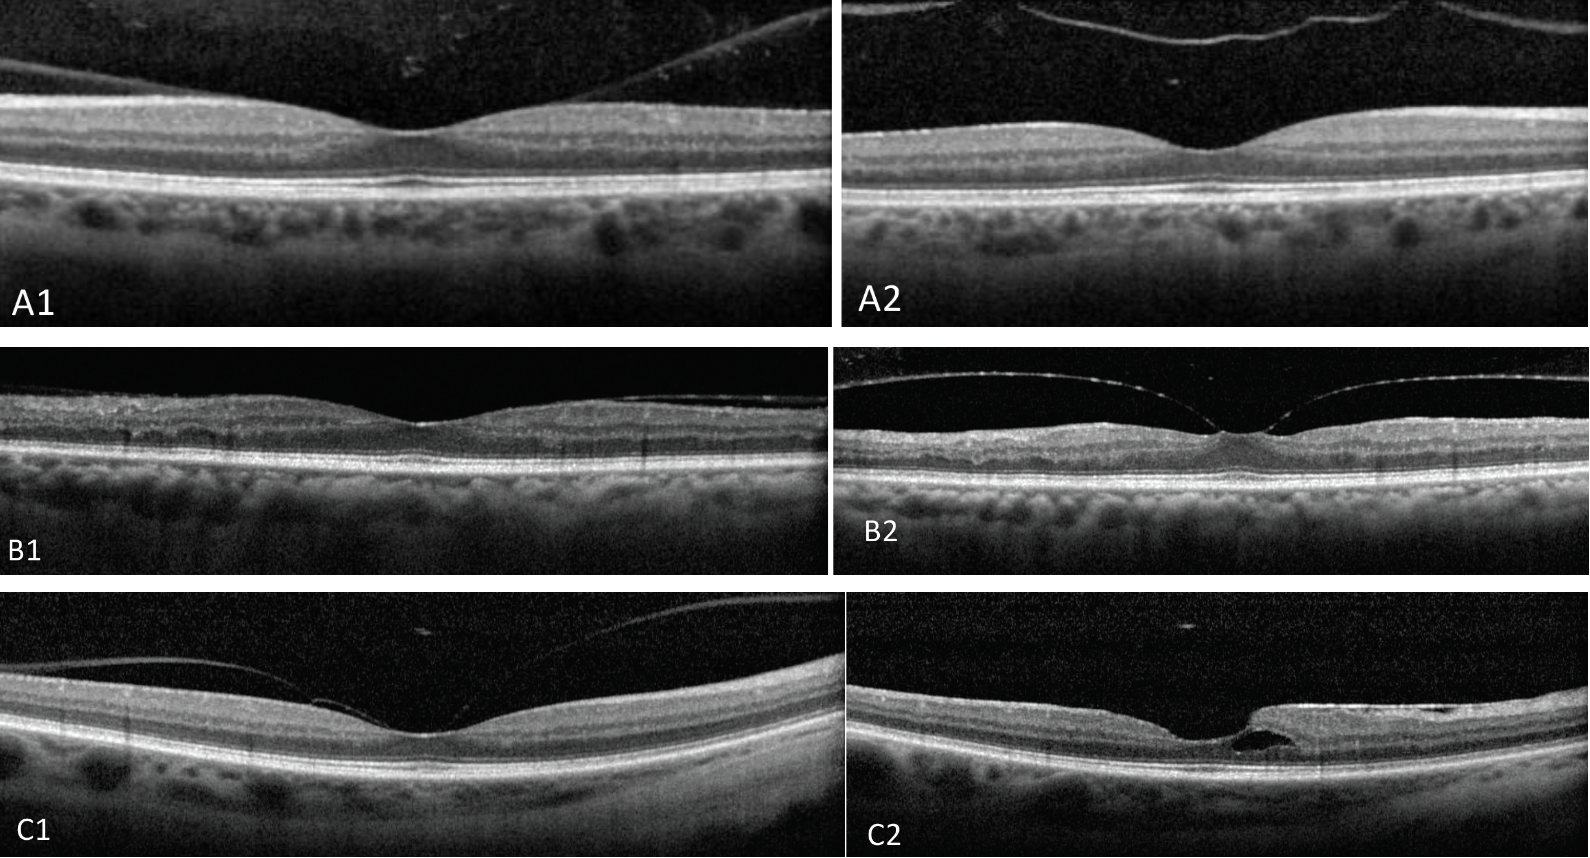
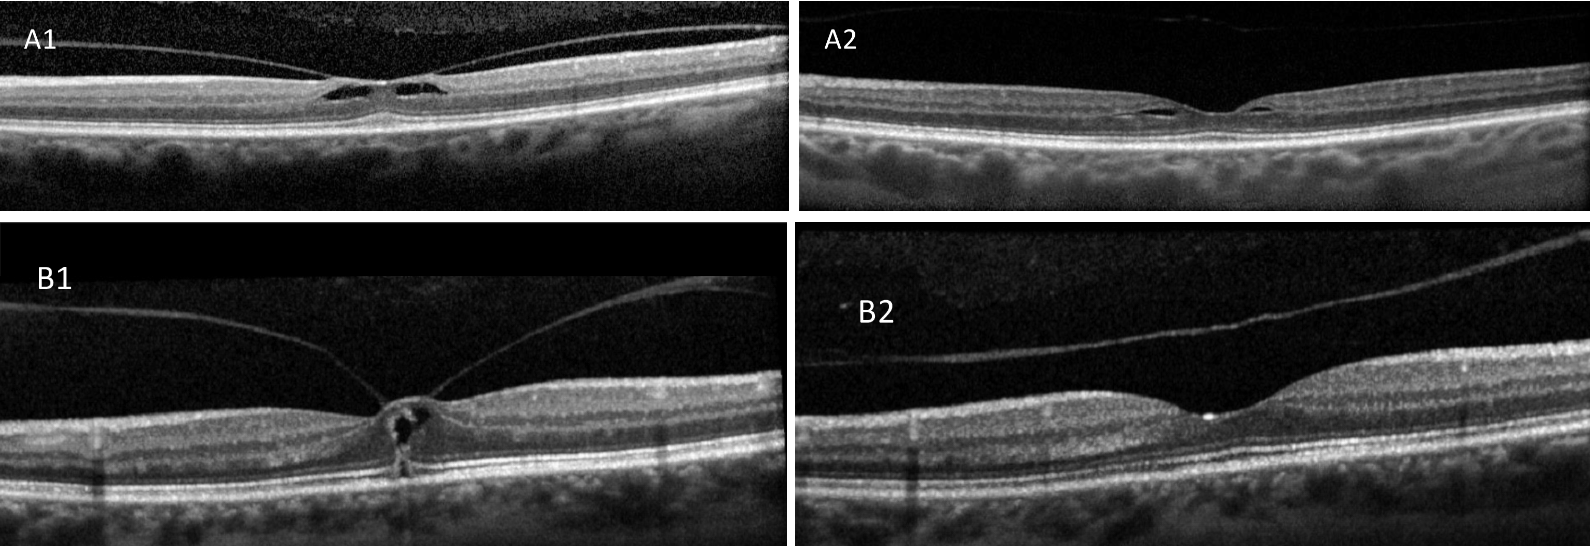
Fig. 14. In the first row of images, VMA (A1) leads to PVD (A2) without consequence. In another case, VMA (B1) progresses to focal VMT (B2). In the third case, VMA (C1) after release results in epiretinal membrane and small foveal schisis (C2). Click image to enlarge. |
Vitreomacular Adhesion (VMA)
This complication has been defined as a partial separation of the posterior vitreous cortex from the macular surface in the perifoveal region without any alteration to the macular or foveal structure.22 This could be considered a normal state of aging as there is forward prolapse of the posterior vitreous cortex during the development of posterior vitreous detachment (PVD). However, this process of normal aging can become anomalous, leading to a disease state such as vitreomacular traction (VMT), which we’ll talk about next (Figure 14).23 Once VMA is detected on OCT, it should be followed periodically to assess for further pathologic findings.
 |
|
Fig. 15. Local VMT with foveoschisis (A1) spontaneously releases with improved macular contour (A2). Focal VMT with macular hole (B1) spontaneously released with normalized macular contour (B2). Click image to enlarge. |
VMT
This common finding discovered by the advent of SD-OCT, is an abnormal PVD with persistent attachment resulting in an anatomic alteration or deformity over the area within 3mm of fovea.23 VMT can spontaneously resolve without consequence (Figure 15). However, a focal (≤1500µm) VMT over the fovea can result in development of a partial-, lamellar- or full-thickness macular hole, while a board VMT (>1500µm) can progress to the epiretinal (or epimacular) membrane (Figures 16 and 17).24
 |
|
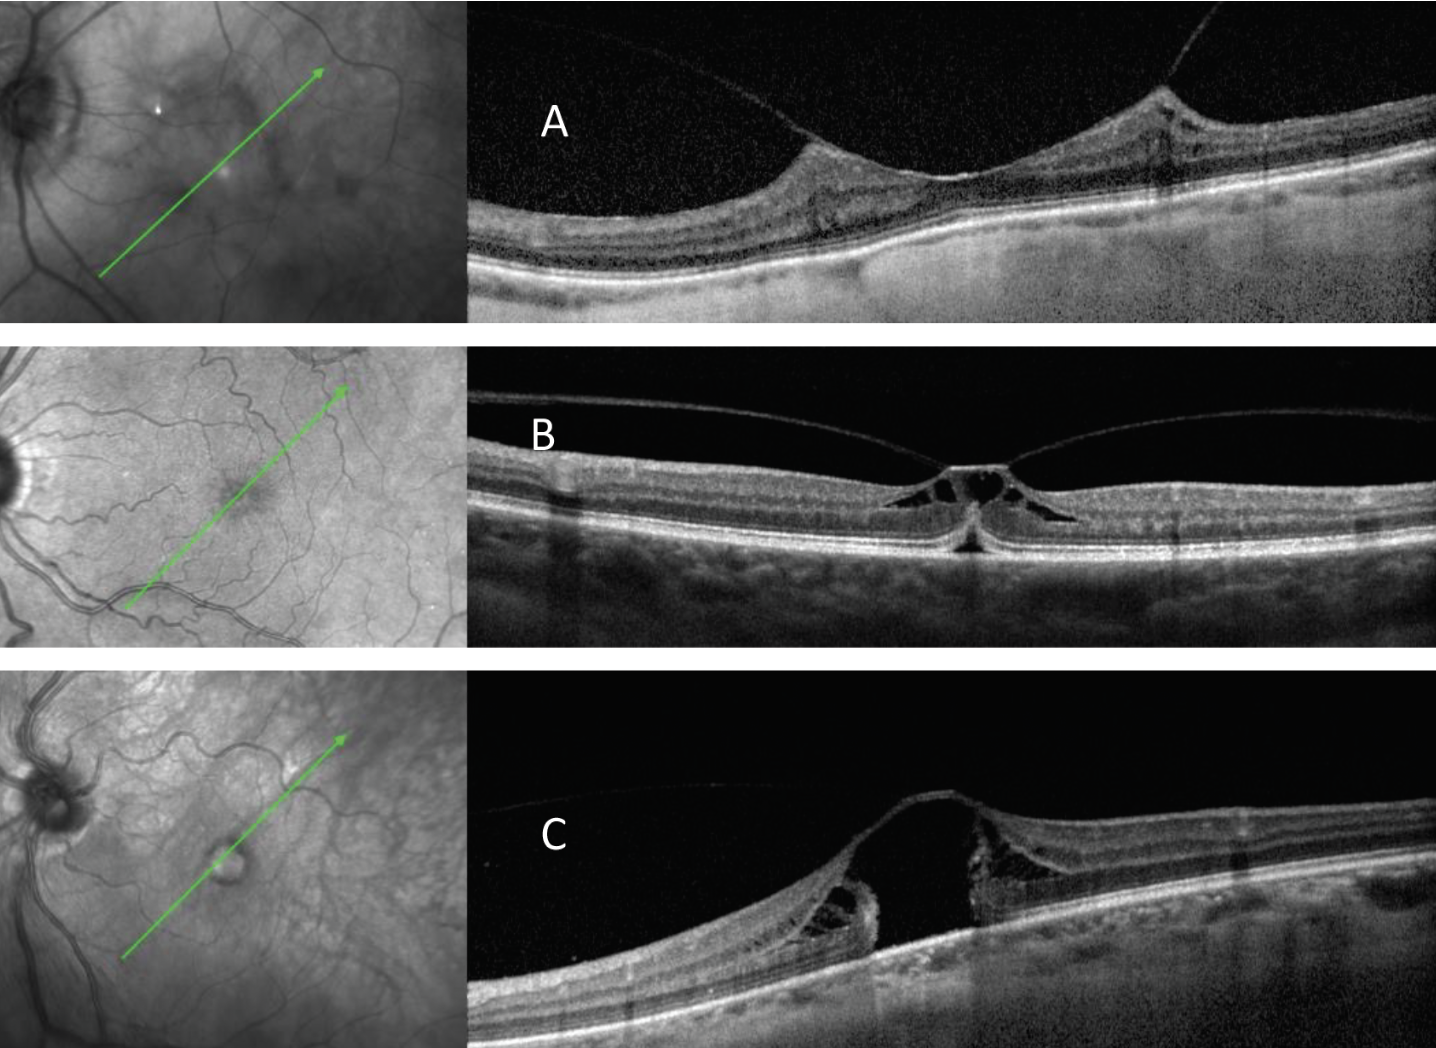
Fig. 16. Broad VMT with epiretinal membrane (A) vs. focal VMT (B and C) with two different macular hole configurations. Click image to enlarge. |
Macular Hole
As previously mentioned, macular holes form as a result of abnormal vitreous traction as a consequence of PVD. The old staging of various macular holes has been somewhat replaced by the evaluation of their configuration as detected by SD-OCT. There are many different shapes which can be marked as partial- vs full-thickness forms (Figure 16).
The management of macular holes primarily depends upon the patient’s visual symptoms plus hole configuration. While many partial-thickness holes are asymptomatic and can be clinically monitored, full-thickness macular holes usually require surgical intervention.25
Epiretinal and Epimacular Membranes
Epiretinal membranes are glial cell proliferations that develop at the vitreomacular interface. These are also typically post-PVD findings that can result in different visual symptoms like blurred vision and metamorphopsia with varying degrees based on the severity of the disease.
On SD-OCT, a hyperreflective band on the macular surface can be detected which results in tractional thickness of the retina, with surface folds or striae and often an inversion of the foveal contour can be seen (Figure 17). The radial traction by epimacular membranes can also result in separation of retinal layers leading to various degrees of schisis, often misinterpreted as macular edema (Figure 17). Partial-thickness macular holes are also not uncommon in the presence of epiretinal or epimacular membranes. Surgical intervention in these cases depends on patients’ visual symptoms as well as the degree of dysmorphic macular changes.26
 |
|
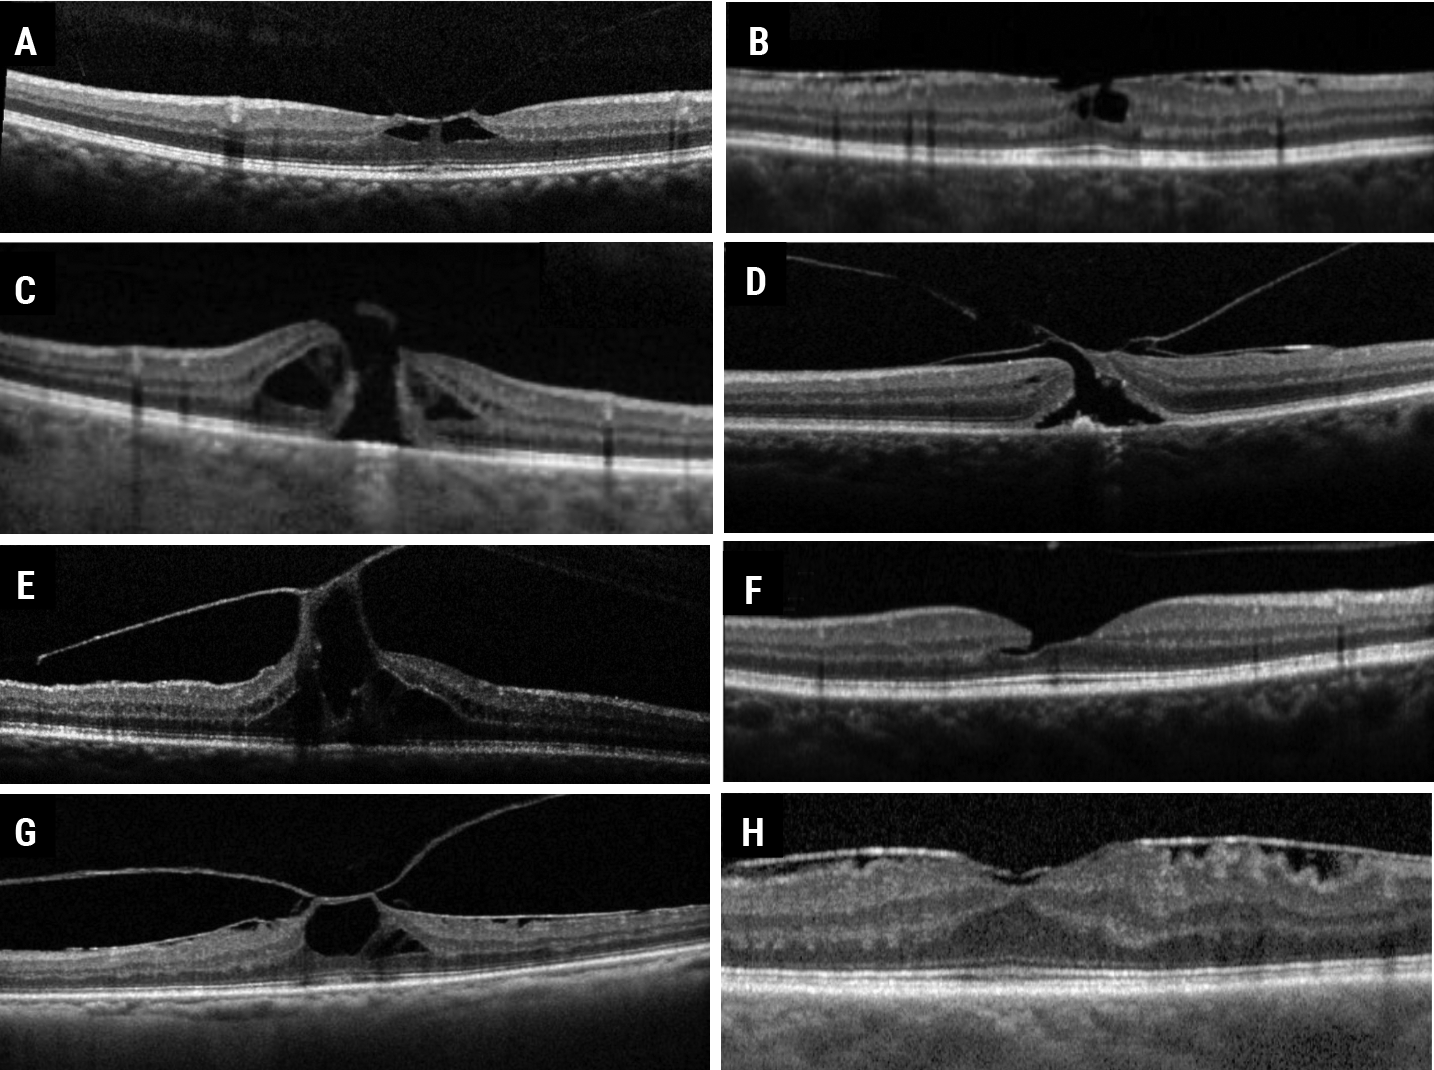
Fig. 17. VMT (A) taxonomy leading to one of the following potential clinical courses: epiretinal or epimacular membrane and lamellar macular hole (B), full-thickness macular hole (C), full-thickness macular hole with epimacular membrane (D), persistent VMT combined with macular hole (E), or released with lamellar macular hole (F), or persistent with epimacular membrane and macular hole (G) or epimacular membrane (H). Click image to enlarge. |
Takeaway
OCT imaging has provided us with a wealth of new information on a variety of retinal disease states. The findings described above represent only a small sampling of the abundance of data that OCT provides, which is what makes this clinical tool indispensable in retina care.
The ability to view and analyze the structure of the retina in this way has revolutionized how disease is detected and managed. When possible, clinicians should take advantage of the available technology to provide a higher level of care to their patients.
Dr. Haynes is a consultative optometrist at the Charles Retina Institute in Germantown, TN, and consulting faculty at Southern College of Optometry in Memphis. She is a fellow of the American Academy of Optometry (AAO). She is a paid speaker for Heidelberg Engineering and a consultant for Notal Vision. Dr. Rafieetary is also a consultative optometric physician at the Charles Retina Institute and a fellow of the AAO. He is on advisory boards for Heidelberg Engineering, Optos, Regeneron, Notal Vision and Cardinal Health.
1. Kafieh R, Rabbani H, Kermani S. A review of algorithms for segmentation of optical coherence tomography from retina. J Med Signals Sens. 2013;3(1):45-60. 2. Ly A, Nivison-Smith L, Assaad N, Kalloniatis M. Fundus autofluorescence in age-related macular degeneration. Optom Vis Sci. 2017;94(2):246-59. 3. Querques G, Massamba N, Srour M, et al. Impact of reticular pseudodrusen on macular function. Retina. 2014;34(2):321-29. 4. Khanifar AA, Koreishi AF, Izatt JA, Toth CA. Drusen ultrastructure imaging with spectral domain optical coherence tomography in age-related macular degeneration. Ophthalmol. 2008;115(11). 5. Veerappan M, El-Hage-Sleiman AKM, Tai V, et al. Optical coherence tomography reflective drusen substructures predict progression to geographic atrophy in age-related macular degeneration. Ophthalmol. 2016;123(12):2554-70. 6. Leuschen JN, Schuman SG, Winter KP, et al. Spectral-domain optical coherence tomography characteristics of intermediate age-related macular degeneration. Ophthalmol. 2013;120(1):140-50. 7. Flores R, Carneiro Â, Tenreiro S, Seabra MC. Retinal progression biomarkers of early and intermediate age-related macular degeneration. Life. 2021;12(1):36. 8. Guymer RH, Rosenfeld PJ, Curcio CA, et al. Incomplete retinal pigment epithelial and outer retinal atrophy in age-related macular degeneration: classification of atrophy meeting report 4. Ophthalmol. 2020;127:394-409. 9. Sadda SR, Guymer R, Holz FG, et al. Consensus definition for atrophy associated with age-related macular degeneration on oct: classification of atrophy report 3. Ophthalmol. 2018;125(4):537-48. 10. Metragolo C, Donati S, Mazzola M, et al. OCT biomarkers in neovascular age-related macular degeneration: a narrative review. J Ophthalmol. 2021. 11. Spaide RF, Jaffe GJ, Sarraf D, et al. Consensus nomenclature for reporting neovascular age-related macular degeneration data: consensus on neovascular age-related macular degeneration nomenclature study group. Ophthalmol. 2020;127(5):61-636. 12. de Oliveira Dias JR, Zhang Q, Garcia JMB, et al. Natural history of subclinical neovascularization in nonexudative age-related macular degeneration using swept-source OCT angiography. Ophthalmol. 2018;125(2):255-66. 13. Wong TY, Sun J, Kawasaki R, et al. Guidelines on diabetic eye care: the international council of ophthalmol recommendations for screening, follow-up, referral and treatment based on resource settings. Ophthalmol. 2018;125(10):1608-22. 14. Joltikov KA, Sesi CA, de Castro VM, et al. Disorganization of retinal inner layers (DRIL) and neuroretinal dysfunction in early diabetic retinopathy. Invest Ophthalmol Vis Sci. 2018;59(13):5481-6. 15. Jenkins AJ, Joglekar M V, Hardikar AA, et al. Biomarkers in diabetic retinopathy. Rev Diabet Stud. 2015;12(1-2):159-95. 16. Markan A, Agarwal A, Arora A, et al. Novel imaging biomarkers in diabetic retinopathy and diabetic macular edema. Ther Adv Ophthalmol. 2020;12:251584142095051. 17. Lee C, Lee AY, Sim DA, et al. Reevaluating the definition of intraretinal microvascular abnormalities and neovascularization elsewhere in diabetic retinopathy using optical coherence tomography and fluorescein angiography. Am J Ophthalmol. 2015;159(1):101-10. 18. Verner-Cole EA, Campbell JP, Hwang TS, et al. Retinal and choroidal imaging with 870nm spectral-domain OCT compared with 1050-nm spectral-domain OCT, with and without enhanced depth imaging. Trans Vis Sci Tech. 2014;3(3):3 19. Cheung CMG, Lee WK, Koizumi H, et al. Pachychoroid disease. Eye. 2019;33(1):14-33. 20. Shields CL, Kaliki S, Rojanaporn D, Ferenczy SR, Shields JA. Enhanced depth imaging OCT of small choroidal melanoma: comparison with choroidal nevus. Arch Ophthalmol. 2012;130(7):850-6. 21. Shields CL, Dalvin LA, Ancona-Lezama D, et al. Choroidal nevus imaging features in 3,806 cases and risk factors for transformation into melanoma in 2,355 cases: The 2020 Taylor R. Smith and Victor T. Curtin Lecture. Retina. 2019;39(10):1840-51. 22. Duker JS, Kaiser PK, Binder S, et al. The international vitreomacular traction study group classification of vitreomacular adhesion, traction, and macular hole. Ophthalmol. 2013;120(12):2611-19. 23. Liao DY, Liu, JH, Zheng YP, et al. OCT proves that vitreomacular adhesion is significantly more likely to develop vision-threatening retinal complications than vitreomacular separation. BMC Ophthalmol. 2020;20:163. 24. Bottós J, Elizalde J, Arevalo JF, Rodrigues EB, Maia M. Vitreomacular traction syndrome. J Ophthalmic Vis Res. 2012;7(2):148-61. 25. Bikbova G, Oshitari T, Baba T, Yamamoto S, Mori K. Pathogenesis and management of macular hole: review of current advances. J Ophthalmol. 2019;2019:3467381. 26. Tsotridou E, Loukovitis E, Zapsalis K, et al. A review of last decade developments on epiretinal membrane pathogenesis. Med Hypothesis Discov Innov Ophthalmol. 2020;9(2):91-110. |
