Focus on RetinaJune's issue is our 13th annual retina report, which explores the latest in clinical research and innovation in the detection and management of retinal diseases. Check out the other featured articles here: |
New drugs continue to emerge at a steady rate for neovascular macular degeneration (nAMD). The past two years alone have seen a refillable port delivery system, a biosimilar anti-VEGF and a new therapeutic, Vabysmo (Genentech/Roche).
Geographic atrophy (GA), on the other hand, has been plagued by failed treatments for a disease that has no proven therapeutic intervention. The unmet need is high. For eyecare providers, it is gut-wrenching to watch GA patients eventually succumb to severe loss of central acuity, while at the very least, we have treatment to offer to those who develop nAMD. But is there hope on the horizon? We will dive into the elusive disease of GA to break down the complex pathophysiology and provide insight on potentially promising treatments and updates in multimodal disease monitoring.
 Click image to enlarge. Click image to enlarge. |
Pathophysiology Breakdown
The mechanisms of dry AMD and GA are complex and multifactorial. Genetics, aging and environmental stressors are all thought to contribute. The first clinically visible sign of dry AMD is the accumulation of drusen, an extracellular deposit composed of lipids, proteins and debris. Photoreceptor outer segment turnover from aging and retinal pigmented epithelium (RPE) stress leads to lipofuscin deposition. These by-products of oxidative stress, among others, are thought to lead to inflammation through the complement cascade and the NLRP3 inflammasome.1 As dysfunction occurs in these pathways, inflammation induces the retinal cell death that is distinctive to GA.1
Complement Cascade
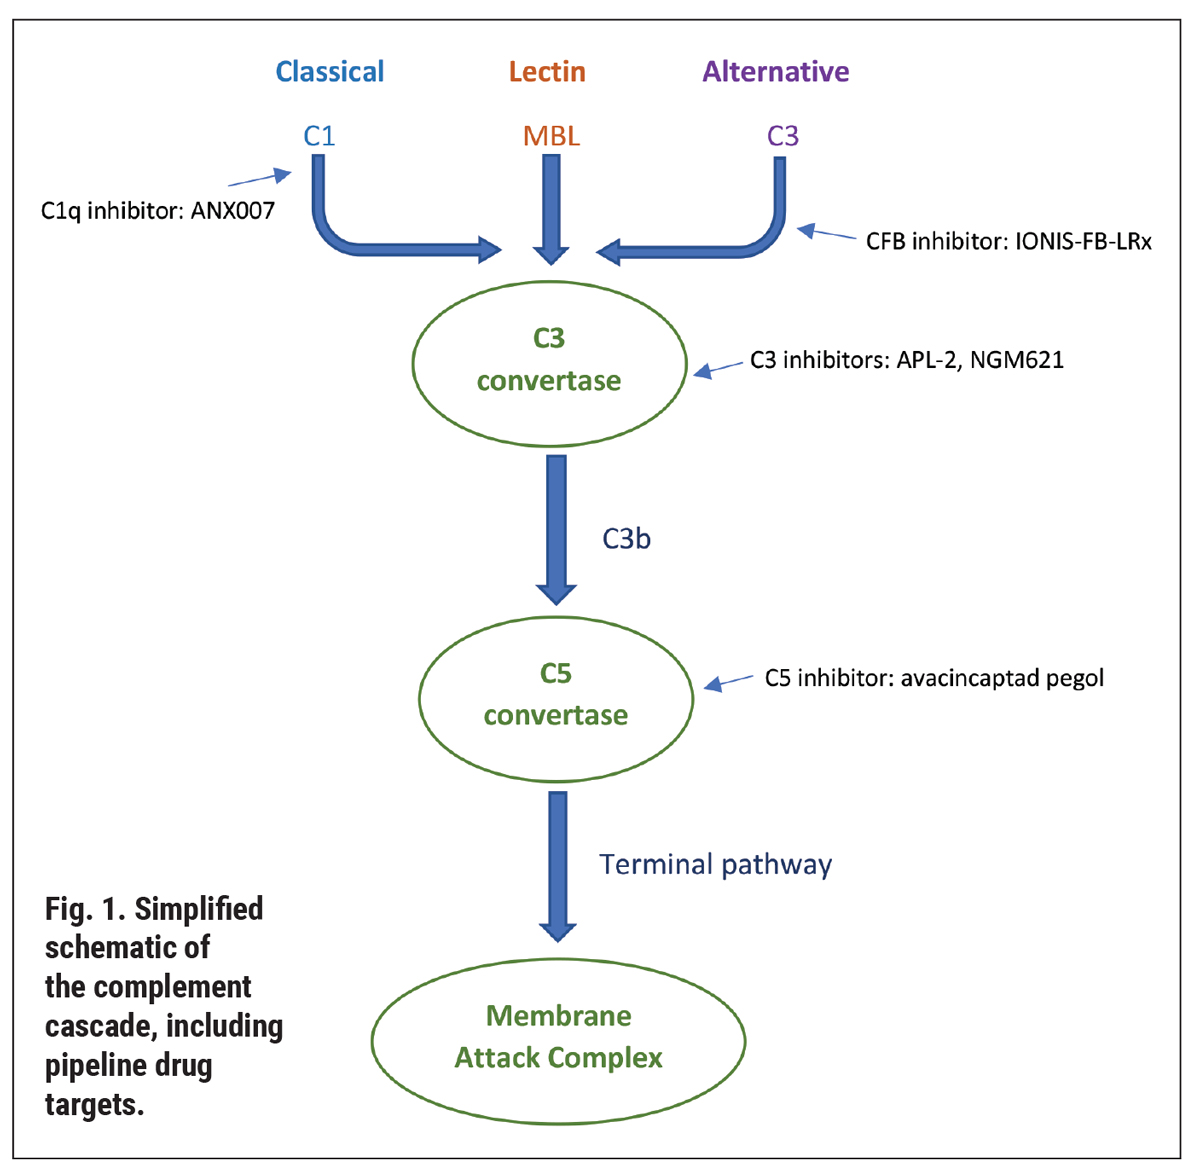
Understanding the pipeline therapeutics, in turn, necessitates a refresher on the complement cascade. This is an immune response to recognize and remove pathogens and cellular debris.1,2 Over 50 proteins make up the cascade, which ultimately lead to the formation of the membrane attack complex (Figure 1). There are three pathways: classical, lectin and alternative, which converge into the formation of a protein complex—the C3 convertase. The path travels from there toward the C5 convertase and the membrane attack complex, which creates a pore on pathogen material to facilitate its cell lysis.1,2
In AMD, the complement cascade is activated by inflammation, reactive oxygen species and macrophages. As well, genetic polymorphisms result in complement dysfunction. Most notably, Y402H, a variant in complement factor H, has been linked with GA and found to be present in half of individuals with AMD.3-5
 |
|
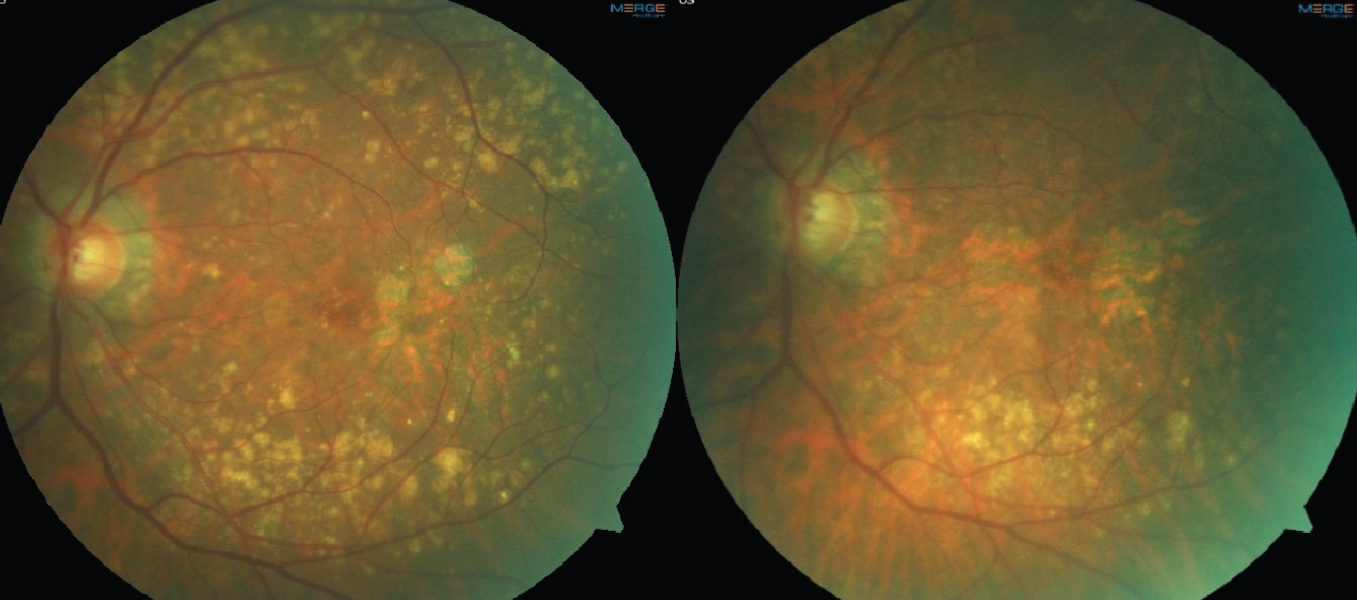
Fig. 2. Color fundus photos demonstrating drusen regression in a patient with multifocal GA lesions. The left image is baseline. The right image is four years later, showing a decrease in drusen volume and progression of GA lesions. Click image to enlarge. |
Therapeutic Pipeline
There are multiple therapeutic contenders targeting all aspects of the complement cascade. By inhibiting C3 cleavage, pegcetacoplan (APL-2, Apellis Pharmaceuticals) stops the downstream progression of the complement cascade. After a successful Phase II study, FILLY, pegceptacoplan moved into phase 3 studies, OAKS and DERBY. In the OAKS 12-month results, those randomized to monthly injections of 15mg/0.1 mL pegcetacoplan had a 22% reduction in GA growth compared with every-other-month treatment at a 16% reduction.6 DERBY narrowly missed its primary endpoint to significantly reduce GA lesion growth. Of important note, when data from the two Phase III trials were pooled, pegcetacoplan performed better for extrafoveal GA, decreasing lesion growth by 26% (monthly) and 23% (every-other-month).6 However, the combined trial data also noted increased conversion to nAMD of 6.0% (monthly) and 4.1% (every-other-month) compared to a rate of 2.4% in the sham arm.6
In a March 2022 press release, Apellis announced 18-month data for DERBY and OAKS. In pooled analysis, the reduction of GA lesion growth in monthly treatment went from 13% in months zero to six to 21% in months 12 to 18.7 In the EOM group, the decrease in growth went from 12% in months zero to six to 17% for months 12 to 18.7 The company noted its plans to submit for a new drug approval to the FDA in the second quarter of 2022.7
Also gaining promise in clinical trial is a C5 inhibitor, avacincaptad pegol (Zimura, Iveric Bio). In the Phase III trial GATHER1, avacincaptad pegol met its primary outcome to slow the growth of extrafoveal GA in both the 2mg and 4mg doses of intravitreal injection.8 The 2mg group saw a 27.4% reduction in GA growth, and a 27.8% reduction was observed in the 4mg treatment arm.8 However, the treated arms did show high rates of conversion to choroidal neovascularization (CNV) compared with sham. The CNV conversion rate at one year was 2.7% in the sham arm compared to 9% and 9.6% in the 2mg and 4mg groups, respectively.8 This increased at the 18-month mark to 11.9% and 15.7%, respectively, while sham rates did not change.9
A second Phase III trial (which anticipates completion next year) is GATHER2, evaluating just the 2mg dose against sham. Participants randomized to treatment will receive 2mg intravitreal injection monthly for year one and then will be randomized for year two to receive treatment either monthly or every-other-month.10
As the closest of the Phase III candidates, will either of these drugs have enough positive data to garner an FDA approval? If so, how will they be used? The answer will depend on how much these drugs slow GA growth (extrafoveal in particular), the risk of conversion to nAMD and the treatment burden for patients. Will there be enough gain to be worth the frequent treatment? Some would argue that with no other treatment available for GA, anything is better than offering nothing to slow down a visually debilitating disease.
Other contenders targeting the complement cascade include NGM621 (NGM Biopharmaceuticals), a humanized IgG1 monoclonal antibody that inhibits cleavage of C3. In contrast to other complement-targeting drugs, NGM621 is not pegylated, which could play a role in not eliciting the conversion to nAMD. Phase II trial, CATALINA, is underway for NGM621 with an enrollment of 320 participants estimating topline data in late 2023.11
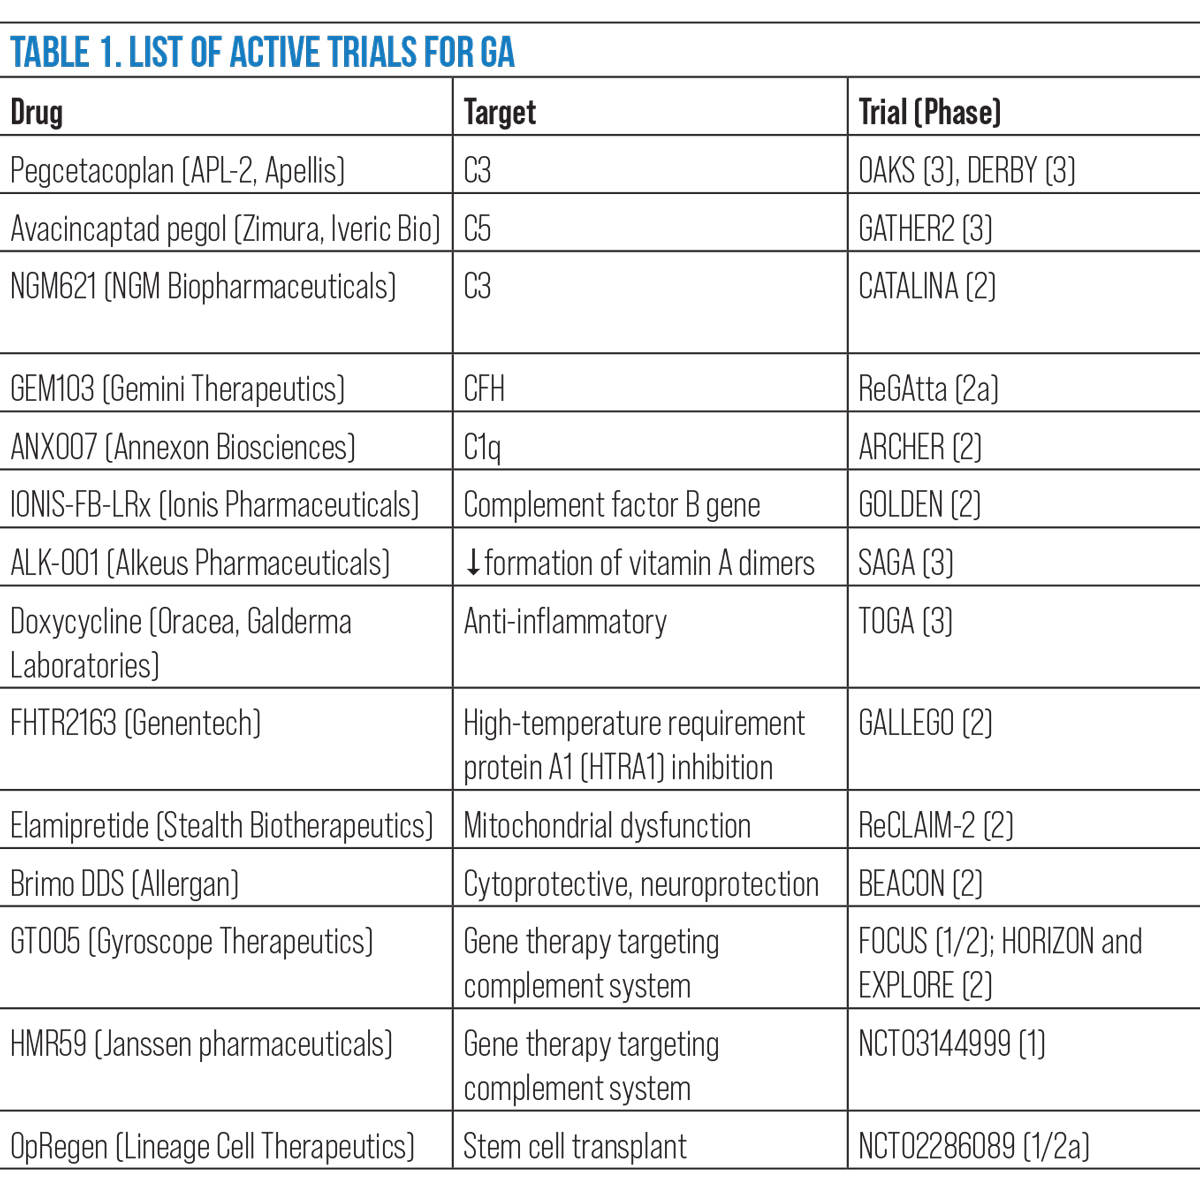
ANX007 (Annexon Biosciences), a monoclonal antibody antigen-binding fragment, binds to C1q to inhibit downstream components of the classical pathway. It is recruiting for Phase II trial, ARCHER.12 Table 1 provides a summary of active clinical trials for GA.
 |
| Click image to enlarge. |
Non-complement Contenders
Even though therapeutic intervention for GA may seem to be just focused on the complement cascade, other targets and mechanisms continue to be explored. Oral treatments, which are of particular interest in an optometric setting, are also under exploration, including the anti-inflammatory effects of doxycycline (Oracea) in a Phase III trial called ToGA.13
Another potential oral GA treatment, ALK-001 (C20-D3-vitamin A, Alkeus Pharmaceuticals), is in a Phase III trial known as SAGA.14 ALK-001 targets modulation of the visual cycle by slowing the formation of vitamin A dimers, thought to be toxic to the retina.15 Alkeus is also exploring the drug for macular atrophy caused by Stargardt’s disease, which is now in recruitment for the Phase II TEASE trial.16
A familiar drug, brimonidine, has also been trialed due its known cytoprotective and neuroprotective properties.17 The Brimonidine Drug Delivery System (Brimo DDS), a biodegradable intravitreal implant, showed statistically significant reduction in GA growth at three months that waned over the course of the Phase II trial.17
Gene therapy and stem cell transplantation also show promise in GA but are in far earlier stage development.
Targeting Risk Factors
Until a treatment is approved for GA (and even after), patient counseling should focus on modifiable risk factors. Smoking is at the top of that list. Evidence shows that current smoking, not just former, is linked to development of advanced AMD.18 Obesity and alcohol consumption have also been suggested to contribute.19,20 Counseling patients on lifestyle choices may help to lower the risk for GA development and progression.
Vitamin supplementation continues to be a hot button topic for any stage of AMD. What combination of vitamins? Which dose? Is genetic testing necessary prior to recommending? These questions continue to linger. The risk reduction found in the original AREDS, for intermediate AMD patients on a combination of high-dose antioxidants and zinc, was only statistically protective toward reducing development of nAMD.21 Even in AREDS2, the addition of lutein, zeaxanthin and omega-3 fatty acids did not show additional protection for nAMD or GA.22 However, the AREDS2 participants were a well-nourished and well-educated population.
This raises the question: would our patients with AMD and poor dietary habits benefit more from supplementation? Twenty years after the original AREDS, it’s still not clear if a specific supplement can target GA. A healthy diet, on the other hand, does show a clear role in reducing the incidence of AMD.23 In particular, a Mediterranean diet rich in fruits, vegetables, legumes and fish has been linked to a decreased incidence of GA.24,25 Until a treatment can also be offered, the chairside discussion for patients with GA and dry AMD alike should focus on modifiable risk factors, diet and supplementation.
Multimodal Imaging
On fundus exam and color photos, GA appears as well-defined areas of RPE loss with increased visibility of the underlying choroidal vasculature. Atrophy can occur as a unifocal lesion or multifocal lesions, and the latter is known to progress at a faster rate and go on to involve the fovea quicker.18,26,27 Natural history studies have observed a variable rate of progression of GA lesions ranging from 0.53-2.6mm2/year (median of 1.78mm2/year) with larger lesions expanding at a faster rate.17,26-29 Color photography serves as a useful tool to image drusen over time, particularly monitoring for drusen regression. The regression and collapse of drusen has been linked to the development of GA, as well as nAMD (Figure 2).30,31
 |
|
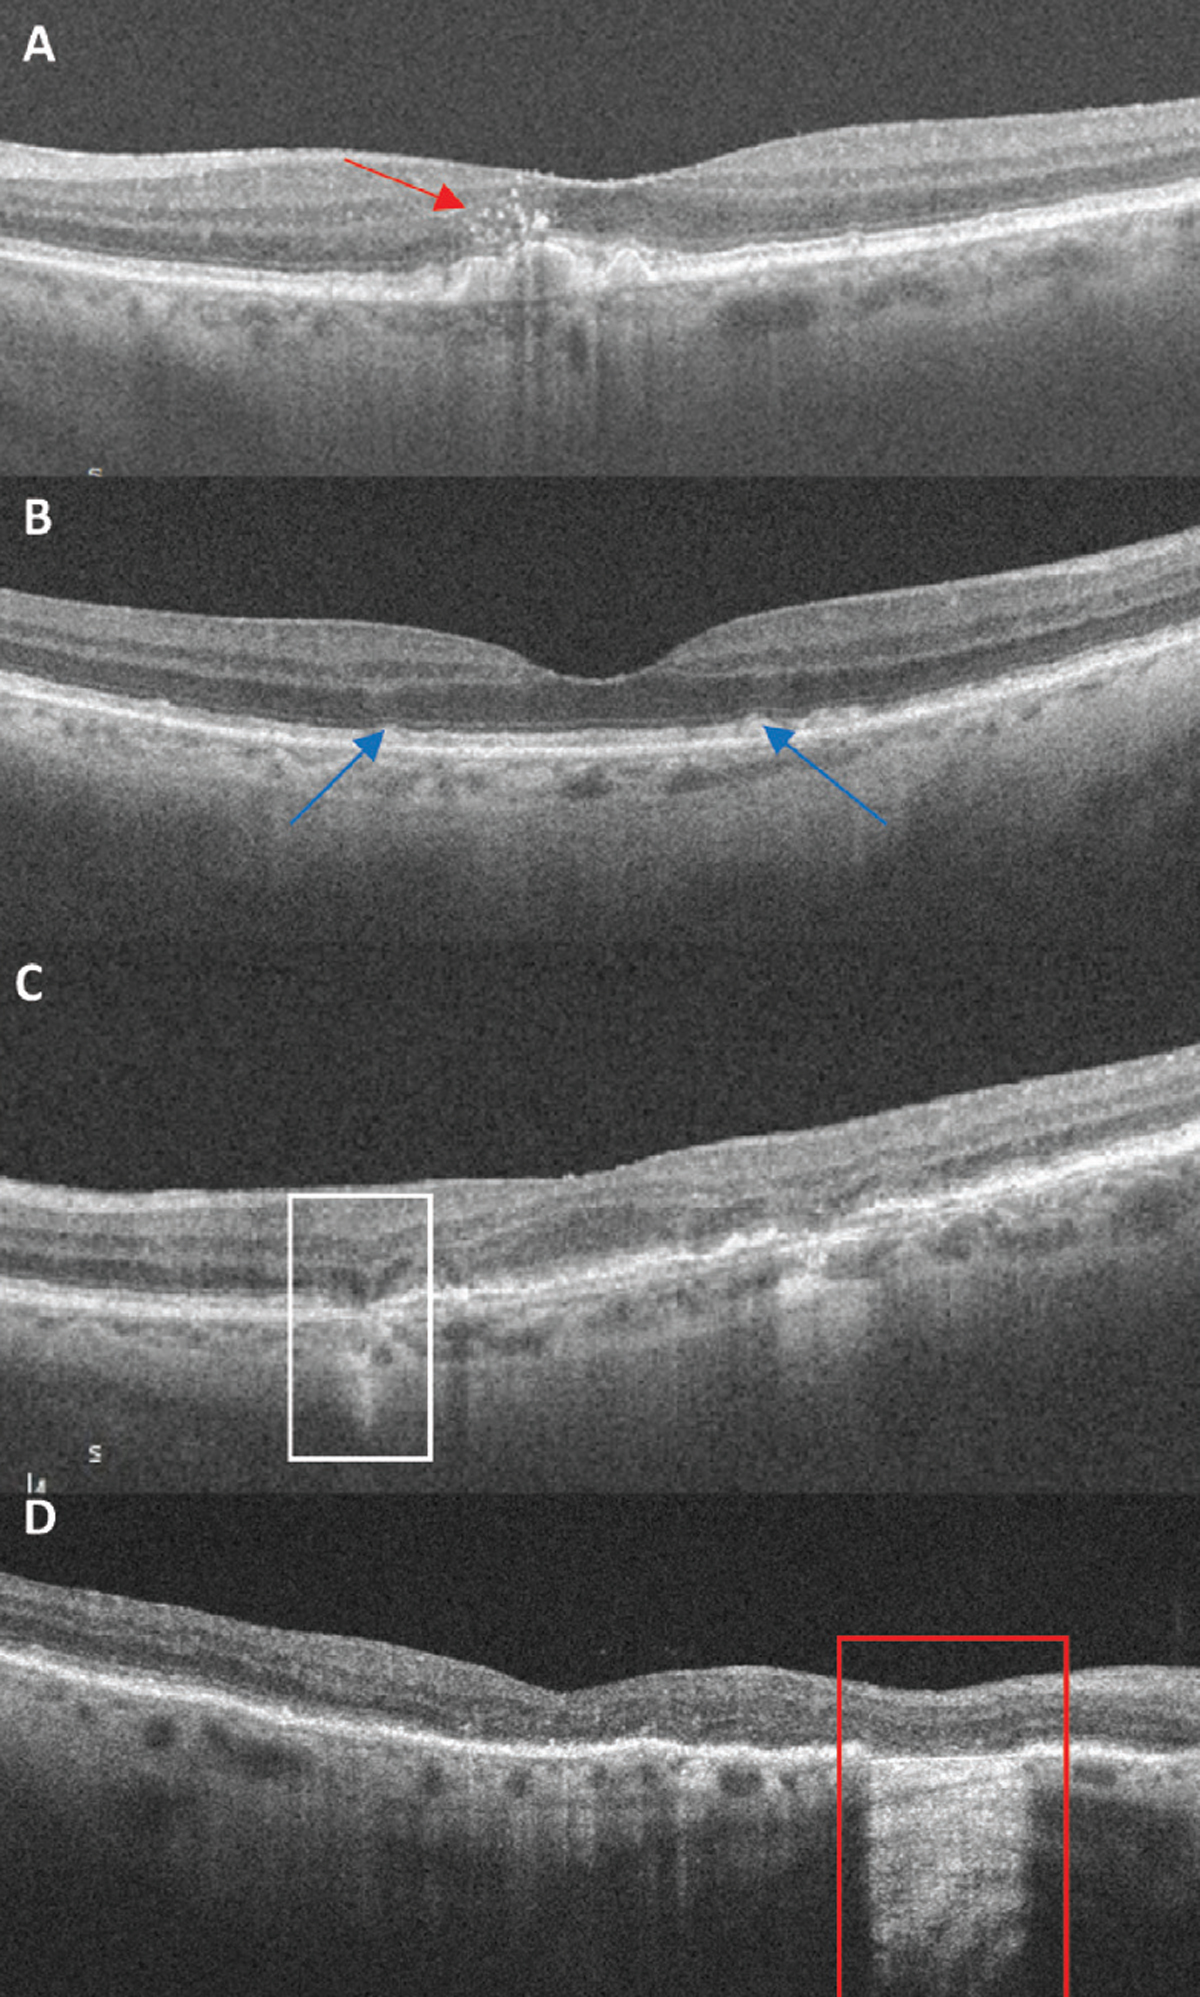
Fig. 3. OCT biomarkers: (A) Red arrow points to numerous hyperreflective foci located above large drusen. (B) Blue arrows indicate subretinal drusenoid deposits, a granular elevation below the EZ. (C) The white box highlights an area of iRORA. There is a subsidence to the OPL and INL with a hyporeflective wedge-shaped band to the OPL. There is attenuation to the RPE with a hypertransmission defect. (D) The red box indicates an area of cRORA. Note the loss of the EZ and RPE with subsequent hypertransmission defect of 607µm in width. Click image to enlarge. |
Fundus autofluorescence (FAF), in particular, highlights the distinct atrophic patches, which image as a dark hypofluorescence due of the loss of RPE cells and absence of lipofuscin. The junctional zone, the edge between GA lesions and the intact outer retina, provides insight into progression rate. On FAF, GA lesions without fluorescence at the junctional zone show a slower rate of change, progressing at a rate of 0.38 mm2/year, compared with banded and diffuse patterns of hyperautofluorescence which progressed at 1.81 and 1.77mm2/year, respectively.29 Simply put, hyperautofluorescence around GA lesions is a poor prognostic sign for fast progression.
SD-OCT provides insight into the status of all the retinal layers. The structural changes in GA are most prominent in the outer retina as disruption and/or loss to the external limiting membrane (ELM), ellipsoid zone (EZ) and RPE/Bruch’s membrane complex. Because of the outer retinal loss, there is subsequent hypertransmission through to the choroid.
GA Biomarkers
It has been well-established that risk factors of large, soft drusen and pigmentary abnormalities signify a higher risk for progression from intermediate AMD to GA. Other high-risk biomarkers have risen over the past decade, particularly with the widespread use of multimodal imaging that correlates to a high risk for GA development. If a treatment for GA becomes approved, recognizing risk factors and the earliest signs of GA will become even more critical. A recent collaborative effort by the Classification of Atrophy Meeting (CAM) group took to defining biomarkers and nomenclature in GA, emphasizing SD-OCT to recognize biomarkers and differentiate the extent of atrophy as it progresses.32
Hyperreflective foci. This finding is only appreciated on SD-OCT as punctate intraretinal lesions often located at the apex of drusen.33 They can be isolated or in a cluster. Hyperreflective foci often correspond clinically to focal hyperpigmentation and likely represent pigment granules. The foci originate in the outer retina and can migrate inward over time. An AREDS2 ancillary study of SD-OCT found the presence of hyperreflective foci in dry AMD is associated with a five-times higher risk of GA within two years.34
Subretinal drusen deposits (SDD). These are an atypical form of drusen that are also referred to as reticular pseudodrusen. The former term was chosen by the CAM group as the preferred nomenclature, as it correctly identifies the known histologic location of the deposits in the subretinal space above the RPE layer.33 It is challenging to distinguish SDDs from true drusen when visualizing on color photography but rather best appreciated with SD-OCT to confirm the subretinal location. In the earliest development of SDD, SD-OCT shows a granular hyperreflective deposit below the EZ.35 As SDDs progress, the material accumulates into small mounds that break through the EZ.35
FAF is also sensitive in detecting SDDs. Individually, an SDD is hypo- or isoautofluorescent with a hyperautofluorescent surrounded in a target shape. Collectively, this forms a diffusely reticular pattern. The presence of SDDs represents a higher risk of progression to advanced AMD, particularly GA.33,36-38
Hypertransmission defects. Hypertransmission occurs as disruption to the RPE develops, leading to increased OCT reflectivity in the choroid. Hypertransmission defects can be seen on individual OCT B-scans as areas of increased choroidal reflectivity or on en face choroidal slabs. Even though the overlying RPE may appear intact, hypertransmission indicates loss of integrity to the RPE. Hypertransmission defects, even as a stand-alone finding, portend a high risk of progression towards nascent GA.39
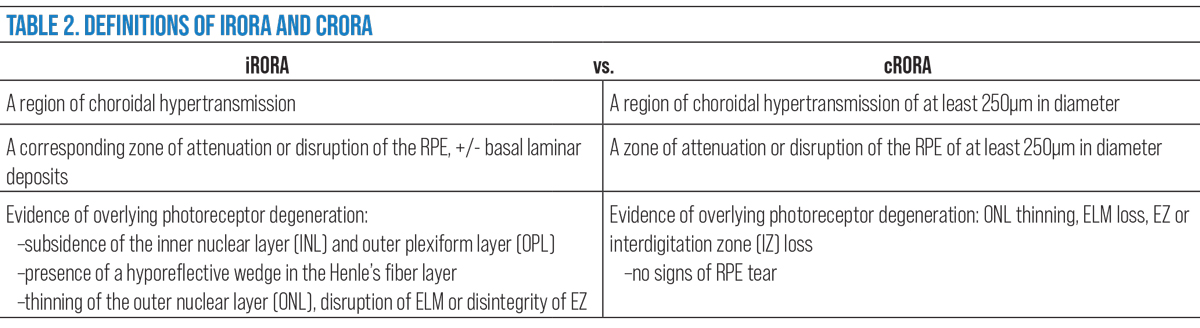
In the CAM group definitions, hypertransmission defects were emphasized as an importance characteristic to define incomplete RPE and outer retinal atrophy (iRORA) and complete RPE and outer retinal atrophy (cRORA).32,33
 |
| Click image to enlarge. |
Nascent GA/iRORA. In 2014, the term nascent GA was used to describe an SD-OCT biomarker that showed in a longitudinal study to impend a 78 fold-risk for transition to GA.40,41 This was defined as a “subsidence,” or collapse of the outer plexiform layer (OPL) and inner nuclear layer (INL) and a hyporeflective wedge-shaped band within the OPL.40 Taking this a step further, the CAM group established the preferred term iRORA by adding the presence of a choroidal hypertransmission defect, signs of photoreceptor degeneration and RPE attenuation/disruption to the definition.42 The terms are synonymous, both indicative of the precursor changes seen prior to the development of complete atrophy.
cRORA. The progression of iRORA, typically in the timeline of one to two years, leads to a complete loss known as cRORA. This represents an endpoint in the development of atrophy in GA, which the CAM group defines as:
- A region of choroidal hypertransmission of at least 250µm in diameter.
- A zone of attenuation or disruption of the RPE of at least 250µm in diameter.
- Evidence of overlying photoreceptor degeneration (ONL thinning, ELM loss, EZ or IZ loss).
- All occur in the absence of signs of an RPE tear.32
The OCT finding cRORA is evident simultaneous to the same area showing hypoautofluorescence on FAF but may occur prior to clinical evidence of GA on color photography. It is the “end-stage” result of GA where subjectively a patient may notice absolute scotoma. While cRORA describes an OCT finding (in GA and other conditions), the term GA is still used to describe that cRORA is specifically caused by AMD.
 |
|
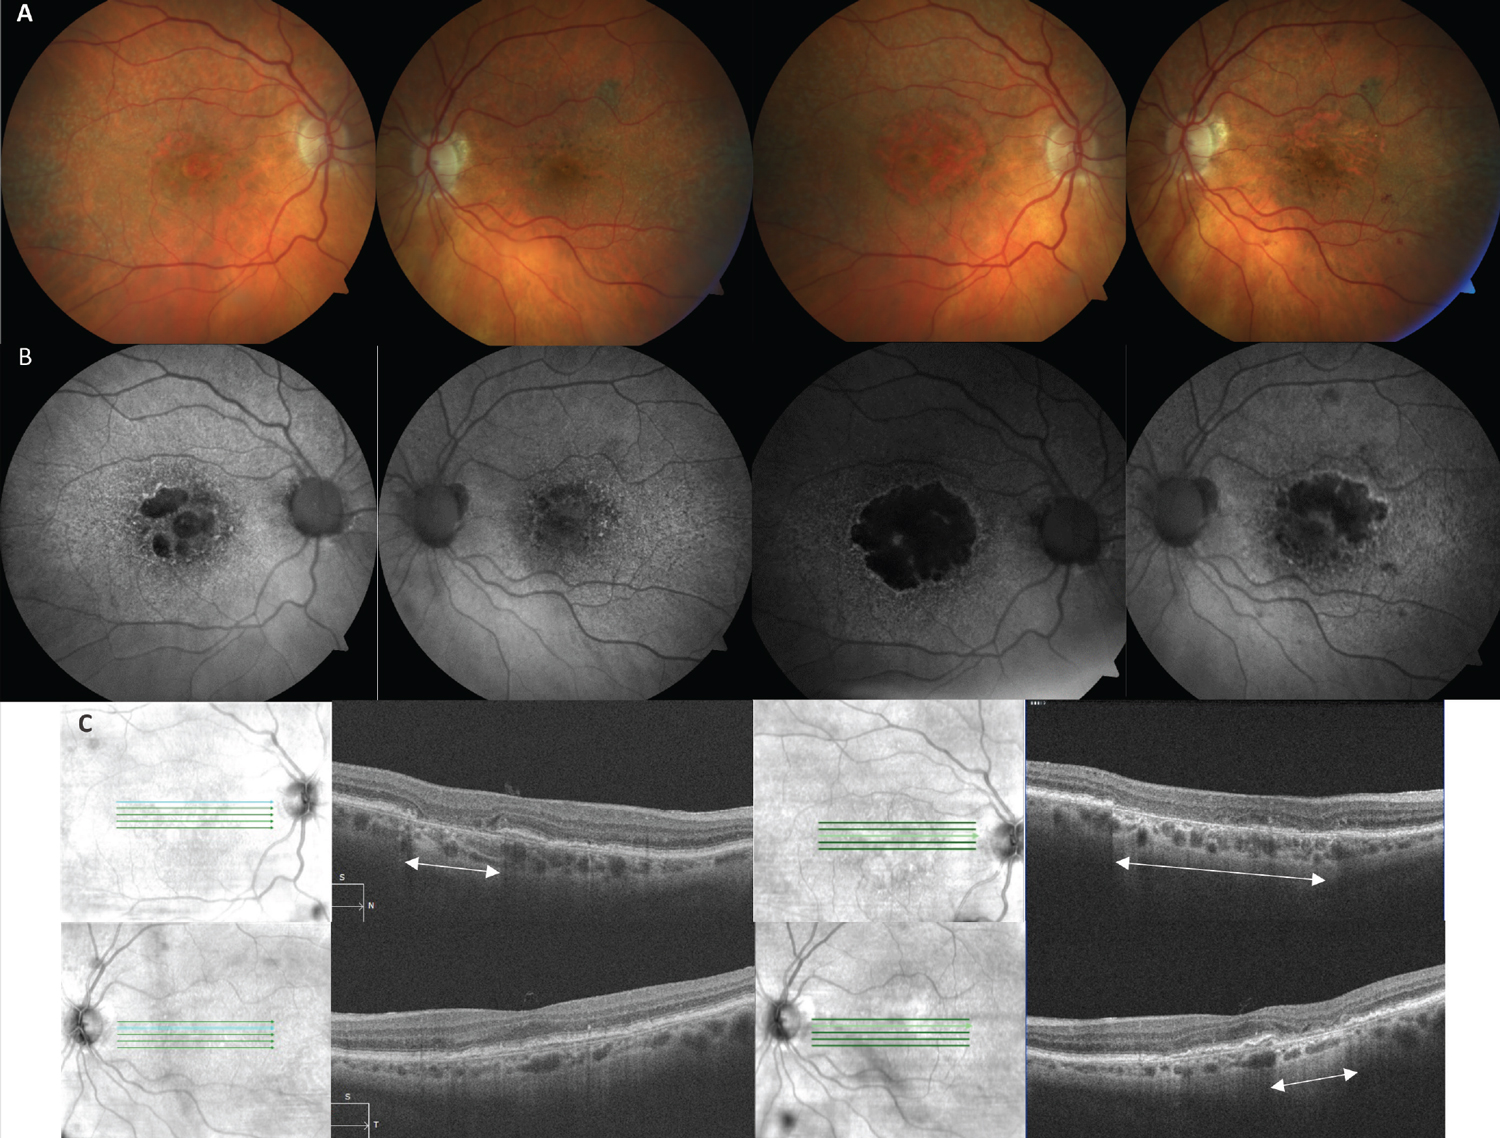
Fig. 4. (A) Color fundus photos of a 90-year-old Caucasian female with bilateral GA AMD. The images on the left are baseline and on the right are 29 months later. (B) FAF images on the left highlight hypoautofluorescence of multifocal lesions of GA in both eyes (OD>OS) that on the right side have expanded and coalesced over time. (C) SD-OCT image of the right eye (top left) shows an area of cRORA (white arrows) that expanded to a much wider lesion (top right). The left eye OCT at baseline (bottom left) did not have cRORA, which then developed after 29 months (bottom right). Click image to enlarge. |
Takeaways
There is an unmet need to serve our patients with GA, to give them hope that their disease can be slowed and their functional vision maintained for a longer time period. The trials reviewed here provide optimism that the retina world may be moving in that direction. If an intervention is approved, optometry will be on the forefront to educate and refer the proper patients, which means understanding GA and therapeutic targets. Optometrists would need to recognize early GA and high-risk OCT biomarkers to help identify at-risk intermediate AMD patients for early invention before advanced atrophy sets in.
Dr. Bedwell is a clinical associate professor at Indiana University School of Optometry. She is a fellow of the American Academy of Optometry and the Optometric Retina Society, as well as a member of the American Optometric Association. She also serves as editor of the Optometric Retina Society’s e-newsletter. She has no financial interests to disclose.
1. Boyer DS, Schmidt-Erfurth U, van Lookeren Campagne M, et al. The pathophysiology of geographic atrophy secondary to age-related macular degeneration and the complement pathway as a therapeutic target. Retina. 2017;37(5):819-35. 2. Armento A, Ueffing, M, Clark, SJ. The complement system in age-related macular degeneration. Cell Mol Life Sci. 2021;78(10):4487-505. 3. Sepp T, Khan JC, Thurlby DA, et al. Complement factor H variant Y402H is a major risk determinant for geographic atrophy and choroidal neovascularization in smokers and nonsmokers. Invest Ophthalmol Vis Sci. 2006;47(2):536-40. 4. Scholl HP, Fleckenstein M, Fritsche LG, et al. CFH, C3 and ARMS2 are significant risk loci for susceptibility but not for disease progression of geographic atrophy due to AMD. PLoS One. 2009;4(10):e7418. 5. Hageman GS, Anderson DH, Johnson LV, et al. A common haplotype in the complement regulatory gene factor H (HF1/CFH) predisposes individuals to age-related macular degeneration. Proc Natl Acad Sci USA. 2005;102(20):7227-32. 6. Apellis announces top-line results from phase 3 DERBY and OAKS studies in geographic atrophy (GA) and plans to submit NDA to FDA in the first half of 2022. https://investors.apellis.com/news-releases/news-release-details/apellis-announces-top-line-results-phase-3-derby-and-oaks. September 9, 2021. Accessed March 22, 2022. 7. Apellis announces pegcetacoplan showed continuous and clinically meaningful effects at month 18 in phase 3 DERBY and OAKS studies for geographic atrophy (GA) [press release]. https://investors.apellis.com/news-releases/news-release-details/apellis-announces-pegcetacoplan-showed-continuous-and-clinically. March 16, 2022. Accessed March 22, 2022. 8. Jaffe GJ, Westby K, Csaky KG, et al. C5 inhibitor avacincaptad pegol for geographic atrophy due to age-related macular degeneration: a randomized pivotal phase 2/3 trial. Ophthalmology. 2021;128(4):576-86. 9. Iveric Bio announces positive Zimura 18 month data supporting the 12 month efficacy findings: continuous positive treatment effect with favorable safety profile in geographic atrophy secondary to age-related macular degeneration in a phase 3 trial [press release]. https://investors.ivericbio.com/news-releases/news-release-details/iveric-bio-announces-positive-zimura-18-month-data-supporting-12. June 15, 2020. Accessed March 25, 2022. 10. A phase 3 safety and efficacy study of intravitreal administration of Zimura (Complement 5 Inhibitor). ClinicalTrials.gov. Accessed March 22, 2022. www.clinicaltrials.gov/ct2/show/NCT04435366. 11. NGM Bio. Our Pipeline. www.ngmbio.com/pipeline. Accessed March 22, 2022. 12. A study investigating the efficacy and safety of intravitreal injections of ANX007 in patients with geographic atrophy (ARCHER). ClinicalTrials.gov. www.clinicaltrials.gov/ct2/show/NCT04656561. Accessed March 22, 2022. 13. Clinical study to evaluate treatment with ORACEA for Geographic Atrophy (TOGA). ClinicalTrials.gov. www.clinicaltrials.gov/ct2/show/NCT01782989. Accessed March 22, 2022. 14. A phase 3 study of ALK-001 in geographic atrophy (SAGA). ClinicalTrials.gov. www.clinicaltrials.gov/ct2/show/NCT03845582. Accessed March 22, 2022. 15. Alkeus Pharmaceuticals ALK-001: once-a-day oral, investigation therapy to prevent blindness. www.alkeuspharma.com/pipeline.html#alk-001. Accessed March 22, 2022. 16. Phase 2 tolerability and effects of ALK-001 on stargardt disease (TEASE). ClinicalTrials.gov. www.clinicaltrials.gov/ct2/show/NCT02402660. Accessed March 22, 2022. 17. Kuppermann BD, Patel SS, Boyer DS, et al. Phase 2 study of the safety and efficacy of brimonidine drug delivery system (Brimo DDS) generation 1 in patients with geographic atrophy secondary to age-related macular degeneration. Retina. 2021;41(1):144-55. 18. Klein R, Meuer SM, Knudtson MD, Klein BE. The epidemiology of progression of pure geographic atrophy: the Beaver Dam Eye Study. Am J Ophthalmol. 2008 Nov;146(5):692-9. 19. Zhang QY, Tie LJ, Wu SS, et al. Overweight, obesity and risk of age-related macular degeneration. Invest Ophthalmol Vis Sci. 2016;57(3):1276-83. 20. Kuan V, Warwick A, Hingorani A, et al. Association of smoking, alcohol consumption, blood pressure, body mass index and glycemic risk factors with age-related macular degeneration: a mendelian randomization study. JAMA Ophthalmol. 2021;139(12):1299-306. 21. Age-Related Eye Disease Study 2 Research Group. A randomized, placebo-controlled, clinical trial of high-dose supplementation with vitamin C and E, beta carotene and zinc for AMD and vision loss: AREDS report no. 8. Arch Ophthalmol. 2001;119(10):1417-36. 22. Age-Related Eye Disease Study 2 Research Group. Lutein + zeaxanthin and omega-3 fatty acids for age-related macular degeneration: the Age-Related Eye Disease Study 2 (AREDS2) randomized clinical trial. JAMA 2013;309(19):2005-15. 23. de Koning-Backus APM, Buitendijk GHS, Kiefte-de Jong JC, et al. Intake of vegetables, fruit and fish is beneficial for age-related macular degeneration. Am J Ophthalmol. 2019;198:70-9. 24. Merle BMJ, Colijn JM, Cougnard-Grégoire A, et al. EYE-RISK Consortium. Mediterranean diet and incidence of advanced age-related macular degeneration: The EYE-RISK Consortium. Ophthalmology. 2019;126(3):381-90. 25. Keenan TD, Agrón E, Mares J, et al. Adherence to the mediterranean diet and progression to late age-related macular degeneration in the age-related eye disease studies 1 and 2. Ophthalmology. 2020;127(11):1515-28. 26. Schmitz-Valckenberg S, Sahel JA, Danis R, et al. Natural history of geographic atrophy progression secondary to age-related macular degeneration (Geographic Atrophy Progression Study). Ophthalmology. 2016;123(2):361-8. 27. Fleckenstein M, Mitchell P, Freund KB, et al. The progression of geographic atrophy secondary to age-related macular degeneration. Ophthalmology. 2018;125(3):369-90. 28. Sunness JS, Margalit E, Srikumaran D, et al. The long-term natural history of geographic atrophy from age-related macular degeneration: enlargement of atrophy and implications for interventional clinical trials. Ophthalmology. 2007;114(2):271-7. 29. Holz FG, Bindewald-Wittich A, Fleckenstein M, et al; Progression of geographic atrophy and impact of fundus autofluorescence patterns in age-related macular degeneration. Am J Ophthalmol. 2007;143(3):463-72. 30. Yehoshua Z, Wang F, Rosenfeld PJ, et al. Natural history of drusen morphology in age-related macular degeneration using spectral domain optical coherence tomography. Ophthalmology. 2011;118(12):2434-41. 31. Schlanitz FG, Baumann B, Kundi M et al. Drusen volume development over time and its relevance to the course of age-related macular degeneration. Br J Ophthalmol. 2017;101(2):198-203. 32. Sadda SR, Guymer R, Holz FG, et al. Consensus definition for atrophy associated with age-related macular degeneration on OCT: classification of atrophy report 3. Ophthalmology. 2017;125(4):537-48. 33. Jaffe GJ, Chakravarthy U, Freund KB, et al. Imaging features associated with progression to geographic atrophy in age-related macular degeneration: classification of atrophy meeting report 5. Ophthalmol Retina. 2021;5(9):855-67. 34. Christenbury JG, Folgar FA, O’Connell RV, et al. Progression of intermediate age-related macular degeneration with proliferation and inner retinal migration of hyperreflective foci. Ophthalmology. 2013;120(5):1038-45. 35. Zweifel SA, Spaide RF, Curcio CA, et al. Reticular pseudodrusen are subretinal drusenoid deposits. Ophthalmology. 2010;117(2):303-12.e1. 36. Finger RP, Wu Z, Luu CD, et al. Reticular pseudodrusen: a risk factor for geographic atrophy in fellow eyes of individuals with unilateral choroidal neovascularization. Ophthalmology. 2014;121(6):1252-6. 37. Joachim N, Mitchell P, Rochtchina E, et al. Incidence and progression of reticular drusen in age-related macular degeneration: findings from an older Australian cohort. Ophthalmology. 2014;121(4):917-25. 38. Finger RP, Chong E, McGuinness MB, et al. Reticular pseudodrusen and their association with age-related macular degeneration: the Melbourne collaborative cohort study. Ophthalmology. 2016;123(3):599-608. 39. Shi Y, Yang J, Feuer W, et al. Persistent hypertransmission defects on en face OCT imaging as a stand-alone precursor for the future formation of geographic atrophy. Ophthalmol Retina. 2021;5(12):1214-25. 40. Wu Z, Luu CD, Ayton LN, et al. Optical coherence tomography-defined changes preceding the development of drusen-associated atrophy in age-related macular degeneration. Ophthalmology. 2014;121(12):2415-22. 41. Wu Z, Luu CD, Hodgson LAB, et al. Prospective longitudinal evaluation of nascent geographic atrophy in age-related macular degeneration. Ophthalmol Retina. 2020;4(6):568-75. 42. Guymer RH, Rosenfeld PJ, Curcio CA, et al. Incomplete retinal pigment epithelial and outer retinal atrophy in age-related macular degeneration: classification of atrophy meeting report 4. Ophthalmology. 2020;127(3):394-409. |
